The jet-powered optical nebula of Cygnus X–1
Abstract
We present H and [O III] (5007 Å) images of the nebula powered by the jet of the black hole candidate and microquasar Cygnus X–1, observed with the 2.5m Isaac Newton Telescope (INT). The ring-like structure is luminous in [O III] and there exists a thin outer shell with a high [O III] / H flux ratio. This outer shell probably originates in the collisionally excited atoms close to the front of the bow shock. Its presence indicates that the gas is shock excited as opposed to photoionised, supporting the jet-powered scenario. The shock velocity was previously constrained at 20 km s-1; here we show that km s-1 (1 confidence) based on a comparison of the observed [O III] / H ratio in the bow shock with a number of radiative shock models. From this we further constrain the time-averaged power of the jet: – erg s-1. The H flux behind the shock front is typically erg s-1 cm-2 arcsec-2, and we estimate an upper limit of erg s-1cm-2arcsec-2 (3) to the optical (-band) continuum flux of the nebula. The inferred age of the structure is similar to the time Cyg X–1 has been close to a bright H II region (due to the proper motion of the binary), indicating a dense local medium is required to form the shock wave. In addition, we search a degree2 field of view to the south of Cyg X–1 in H (provided by the INT Photometric H Survey of the Northern Galactic Plane; IPHAS) for evidence of the counter jet interacting with the surrounding medium. Two candidate regions are identified, whose possible association with the jet could be confirmed with follow-up observations in [S II] and deeper observations in [O III] and radio.
keywords:
accretion, accretion discs, black hole physics, ISM: jets and outflows, shock waves, X-rays: binaries, stars: individual: Cygnus X–11 Introduction
Galactic black holes release an unknown fraction of their accreting matter and energy in the form of collimated outflows (or jets) that travel into the surrounding medium (for a review see Fender, 2006). These accreting black hole candidate X-ray binaries (BHXBs) spend a large fraction of their lifetimes in a ‘hard’ X-ray state (Homan & Belloni, 2005; McClintock & Remillard, 2006) which is ubiquitously associated with the formation of partially self-absorbed synchrotron emitting radio jets (e.g. Fender, Belloni & Gallo, 2004). While the presence of these jets is commonly inferred from a flat radio-through-infrared spectral component, radio observations of the nearby (d = 2.10.1 kpc; Massey, Johnson & Degioia-Eastwood, 1995) high-mass BHXB Cygnus X–1 have directly resolved a collimated jet 30 AU in length (Stirling et al., 2001), whilst in this X-ray state. A transient radio jet has also been observed of length 140 AU that was launched during a period of X-ray state transitions (Fender et al., 2006). Transient jets with high Lorentz factors are sometimes seen when a BHXB leaves the hard state (e.g. Fender et al., 2004).
The power carried by the self-absorbed, steady hard state jets when averaged over their lifetime stands as one of the key questions in our understanding of BHXB accretion, and possibly for black hole accretion on all mass scales. In recent years it has become apparent that a significant fraction of the liberated accretion power is ejected as outflows in hard state BHXBs (e.g. Gallo, Fender & Pooley, 2003), and it now seems likely that in hard X-ray states the accretion flow is ‘jet-dominated’ (Fender, Gallo & Jonker, 2003), with more power in the jets than in X-rays. Clearly, measuring as accurately as possible the jet power is key to understanding both the overall physics of the accretion process and the matter and energy input from BHXBs into the interstellar medium (ISM).
Attempts at estimating the jet power content from core radio luminosities are riddled with assumptions about its spectrum and radiative efficiency, the latter of which is poorly constrained (e.g. Ogley et al., 2000; Fender, 2001; Homan et al., 2005; Heinz, 2006). The jet power estimated in this way is highly sensitive to the location of the high-frequency break of the flat (spectral index where ) optically thick part of the jet spectrum, as the radiative power is dominated by the higher energy photons (Blandford & Königl, 1979). This break is likely to be at m, at least for BHXBs at high luminosities ( erg s-1) in the hard state (Corbel & Fender, 2002; Nowak et al., 2005; Russell et al., 2006).
The jet power may alternatively be constrained by analysing its interaction with the surrounding medium, without requiring prior knowledge of the jet spectrum and radiative efficiency. Radio lobes associated with jets from Active Galactic Nuclei (AGN) are commonly used as accurate calorimeters of the power lifetime product of the jets (Burbidge, 1959), a method only very recently applied to jets from stellar mass black holes. Radio lobes have been identified and associated with an increasing number of BHXBs (Mirabel et al., 1992; Rodríguez et al., 1992; Corbel et al., 2002) and even a couple of neutron star X-ray binaries (Fomalont, Geldzahler & Bradshaw, 2001; Tudose et al., 2006).
Recently, deep radio observations of the field of Cyg X–1 resulted in the discovery of a shell-like structure which is aligned with the aforementioned resolved radio jet (Gallo et al., 2005). This jet-blown nebula with a diameter of pc is interpreted as the result of a strong shock that develops at the location where the collimated jet impacts on the ambient ISM. The nebula was subsequently observed at optical wavelengths by the Isaac Newton Telescope (INT) Wide Field Camera (WFC) and is clearly visible in H (6568 Å) line emission, and coincident with the radio shell. The H flux density mJy arcsec-2 is times the measured radio flux density, inconsistent with optically thin synchrotron emission between the two spectral regimes and instead favouring a thermal plasma (Gallo et al., 2005).
| Run no. | MJD | Target | RA & Dec. (centre of | Airmass | Filter | Exposure |
|---|---|---|---|---|---|---|
| CCD 4; J2000) | time (sec) | |||||
| 473434 | 53653.922 | Cyg X–1 north | 19 59 38.49 +35 18 20.0 | 1.171 | [O III] 5007 Å | 1200 |
| 473435 | 53653.937 | Cyg X–1 north | 19 59 39.31 +35 18 29.6 | 1.231 | [O III] 5007 Å | 1200 |
| 473436 | 53653.956 | Cyg X–1 north | 19 59 38.50 +35 18 20.0 | 1.310 | Harris V | 600 |
| 473437 | 53653.963 | Cyg X–1 north | 19 59 38.49 +35 18 20.0 | 1.380 | H 6568 Å | 1200 |
| 473438 | 53653.978 | Cyg X–1 north | 19 59 39.31 +35 18 30.0 | 1.494 | H 6568 Å | 1200 |
| 473439 | 53653.996 | Cyg X–1 north | 19 59 37.68 +35 18 10.0 | 1.620 | Harris R | 600 |
| 473441 | 53654.013 | Cyg X–1 south | 19 59 07.99 +34 56 59.9 | 1.860 | [O III] 5007 Å | 900 |
| 473442 | 53654.025 | Cyg X–1 south | 19 59 08.80 +34 57 09.8 | 2.064 | [O III] 5007 Å | 900 |
| 473452 | 53654.106 | Landolt 94–171 | 02 53 38.80 +00 17 17.9 | 1.139 | Harris R | 10 |
| 473454 | 53654.109 | Landolt 94–171 | 02 53 38.79 +00 17 18.0 | 1.138 | Harris V | 10 |
| 473457 | 53654.113 | Landolt 94–702 | 02 58 13.39 +01 10 54.0 | 1.128 | Harris V | 10 |
| 473458 | 53654.113 | Landolt 94–702 | 02 58 13.39 +01 10 53.9 | 1.128 | Harris R | 10 |
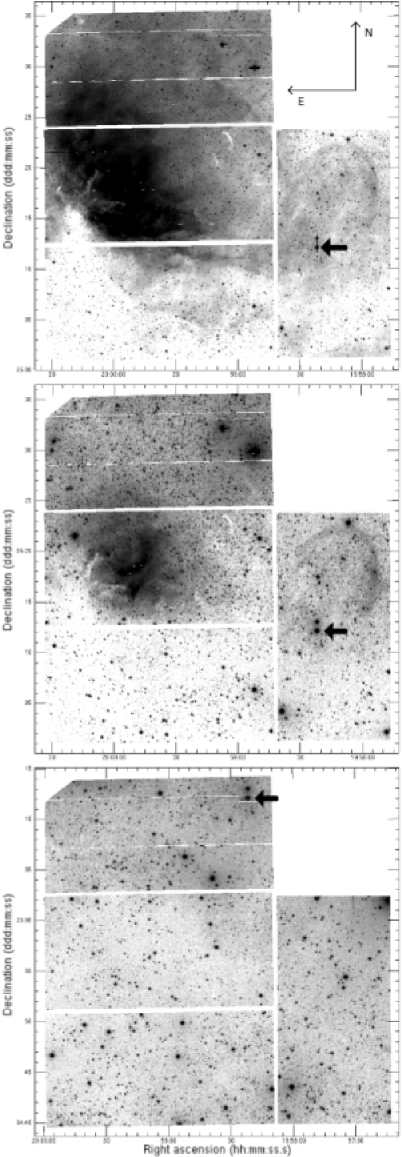
The positions refer to the centre of CCD 4, which is the middle of the three eastern CCDs (Fig. 1). 10 bias frames and 5H, 7[O III] 5007 Å, 6Harris -band and 5Harris -band sky flats were taken in the same observing night.
Models of X-ray binary jet–ISM interactions predict a shell of shocked compressed ISM emitting bremsstrahlung radiation containing a bubble of relativistic synchrotron–emitting plasma (Kaiser et al., 2004). As with any interstellar shock wave where the preshock gas is at least partially ionised by the approaching radiation field, line emission from recombination of the shocked gas is also expected (e.g. Cox, 1972). The shell, which is essentially a radiative shock wave, consists of a bow shock front where the gas is in transition to a higher temperature due to collisions and plasma instabilities (e.g. McKee & Hollenbach, 1980). The post-shocked gas then enters the optically thin ‘cooling region’, where the overall ionisation level rises then falls as the gas radiatively cools to K (e.g. Cox & Raymond, 1985). Shock waves are commonly observed in supernova remnants (SNRs), and shocks created from outflows exist in Herbig-Haro objects, where emission lines are produced in the shock wave created by bipolar flows from pre-main-sequence stars impacting the ISM (e.g. Schwartz, 1983). Shock fronts associated with AGN jets interacting with the intra-cluster gas (which is much hotter than the ISM) are also seen at X-ray energies (Carilli, Perley & Harris, 1994; Kraft et al., 2003; Forman et al., 2005; Nulsen et al., 2005; Wilson, Smith & Young, 2006; Croston, Kraft & Hardcastle, 2006). In addition, infrared sources found symmetric about the position of the X-ray binary GRS 1915+105 (Chaty et al., 2001) may be jet–ISM impact sites (Kaiser et al., 2004).
By modelling the shell emission of the Cyg X–1 nebula as originating from radiatively shocked gas (Castor, McCray & Weaver, 1975; Kaiser & Alexander, 1997; Heinz, Reynolds & Begelman, 1998), the total power carried by the jet was estimated to be erg s-1 which, when taking into account the power of the counter jet, is equal to 0.06–1 times the bolometric X-ray luminosity of Cyg X–1 (Gallo et al., 2005). These calculations have led to estimates of the matter content of the jet (Heinz, 2006); a similar technique to those applied to the jets of AGN, where their matter content are inferred from a combination of information from the core and lobes (e.g. Celotti & Fabian, 1993; Dunn, Fabian & Celotti, 2006).
These jet power calculations are highly sensitive to the velocity of the gas in the shock front. From temperature constraints and from the non-detection of an X-ray counterpart, this was estimated to be km s-1. Emission line ratios of shock-heated gas can constrain its parameters, including the velocity of the shock (e.g. Osterbrock, 1989).
Here, we performed wide field imaging observations of the region of Cyg X–1 in H and [O III] (5007 Å) filters in order to (a) constrain the velocity and temperature of the shocked gas and hence the time-averaged power of the X-ray binary jet of Cyg X–1, (b) obtain for the first time flux-calibrated optical emission line measurements from a nebula powered by an X-ray binary jet, and (c) search for any jet–ISM interactions associated with the counter jet supposedly to the south of Cyg X–1.
2 Observations and data reduction
The field of Cyg X–1 and of two Landolt standard stars were observed using the Wide Field Camera (WFC) on the 2.5m Isaac Newton Telescope (INT) in narrowband and broadband filters. The images were taken on 2005-10-10 as part of a Galactic survey of emission line nebulae powered by X-ray binary jets (Russell et al., in preparation). The conditions were cloudless with a seeing of 1–2 arcsec. The moon was set, making it possible to achieve a higher signal-to-noise ratio (S/N) than previous images presented in Gallo et al. (2005). Table 1 lists the observations used for this work. The WFC consists of 4 CCDs of 20484100 imaging pixels, each of scale 0.333 arcsec pixel-1. The field of view is 3434 arcmin.
Data reduction was performed using the pipeline package THELI (details in Erben et al., 2005). After manually separating the data into type (bias/flat/science) and filter, THELI de-biased and flat-fielded the science frames. The package read the exposure time and RA & Dec from the FITS file headers (it is currently configured for reducing data from instruments including the INT WFC) and matched several hundred stars in each exposure with those in the online MAST Guide Star Catalog (release 2.2). THELI then aligned and stacked (for each position and filter) the images, and position-calibrated mosaics were created, with flux in counts s-1pixel-1. The resulting H and [O III] mosaics of the Cyg X–1 field are displayed in Fig. 1.
3 Flux calibration
The Landolt standard stars 94–171 (; ) and 94–702 (; ) were observed at low airmass (see Table 1). We performed aperture photometry of the standards in the and -band reduced images with PHOTOM and accounted for airmass–dependent atmospheric extinction according to King (1985). The resulting conversion between intrinsic flux density (at airmass ) and counts s-1 differed between the two standards by a factor 0.5 and 6.5 percent for and , respectively. The H filter is located within the passband of the Harris filter, and [O III] is located within the Harris filter. For a flat spectrum source, the WFC -band filter collects 15.742 times more flux than the H filter, and likewise collects 11.127 times more flux than [O III]. By multiplying by these factors we obtain mJy (intrinsic) per counts s-1 for H and mJy (intrinsic) per counts s-1 for [O III].
As a check of our calibration, we measured the fluxes of 10 stars in our reduced Cyg X–1 H image, that are listed in the INT Photometric H Survey of the Northern Galactic Plane (IPHAS; Drew et al., 2005) catalogue (which uses the same telescope, instrument and filter). The ratio of the H flux of each star measured here to that listed in the catalogue is 1.060.39 (). We can therefore assume our flux calibration is accurate, and we adopt a error for each flux measurement (H and [O III]), of 0.14 dex (i.e. ).

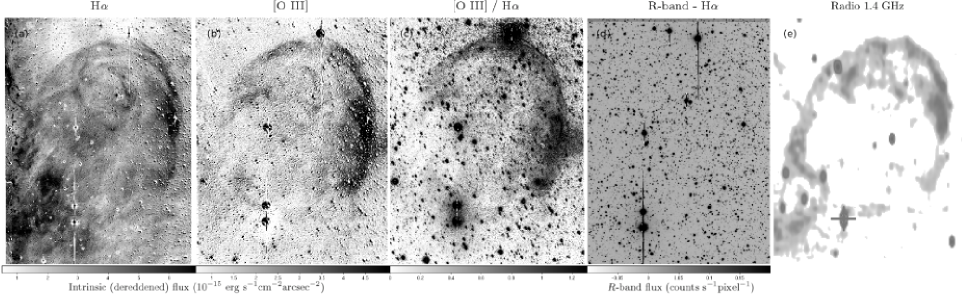
We created flux-calibrated continuum-subtracted H and [O III] images of the region of Cyg X–1 (Fig. 2a, 2b) using IMUTIL and IMMATCH in IRAF . The resulting images are corrected for interstellar extinction towards Cyg X–1 adopting (Wu et al., 1982). The extinction towards Cyg X–1 and its nebula may vary over the field of view. The total neutral hydrogen column density through the Galaxy at various positions in a deg2 area around Cyg X–1 (Hartmann & Burton, 1997) is indicated in Fig. 3. appears to vary smoothly over the field, and the four closest points to Cyg X–1 yield cm-2 in the region containing Cyg X–1, or adopting (Predehl & Schmitt, 1995). If the extinction towards Cyg X–1 (i.e. not through the whole Galaxy in this direction) also varies by 0.53 over the much smaller field of view of the nebula (a conservative case), an error is introduced of 0.18 dex and 0.25 dex to the H and [O III] flux measurements, respectively (no distance estimate is required). The measurements of [O III] / H however only suffer a 0.06 dex uncertainty due to the different extinctions suffered at the two wavelengths ([O III] at 5007 Å and H at 6568Å; this concerns only the contribution to the error budget of the extinction).
Propagating the above two sources of error, we arrive at:
| (1) | |||
| (2) | |||
| (3) |
[O III] / H and -band H images were also created (Fig. 2c, 2d). The [O III] / H image represents the ratio of the [O III] and H fluxes (in de-reddened erg s-1cm-2arcsec-2) and the H contribution is subtracted from the continuum in the -band H image. The 1.4 GHz radio image of Gallo et al. (2005) in shown in Fig. 2e for comparison.
4 Results
The H and [O III] fluxes measured in a number of positions in the shell of the nebula are plotted in Fig. 4. It seems that the [O III] / H ratio increases with position going clockwise around the shell, from values of / on the eastern side to on the western side of the nebula. The fluxes of both emission lines are also higher on the western side. The line ratio is approximately constant in the filaments inside the nebula, with values of / . The H II region Sh2–101 and the ‘stream’ of diffuse emission joining the region to the Cyg X–1 nebula, possess ratios of order / –0.2, with one area (RA 19 59 45, Dec +35 18 48) having a higher value, / . This area resembles a shell-like feature close to a bright star HD 227018 at the centre of the H II region, and could be a bow shock associated with the motion of this star (which is 12 milli-arcsec per year in the direction of the observed shell in the H II region; Perryman et al., 1997). We measure the flux in the H II region to be – erg s-1cm-2arcsec-2; – erg s-1cm-2arcsec-2.

The large quantity of stars in the line of sight of the shell prevent us from accurately calculating the total H and [O III] luminosity of the structure. However, we can conservatively estimate the area of the emitting gas to be between 3 arcmin2 (approximating the nebula to a arcsec2 area) and 46 arcmin2 (the area of a circle with radius 4 arcmin) and take the mean flux of the nebula (Fig. 4) to constrain its luminosity. At a distance of 2.1 kpc, the H and [O III] luminosities of the nebula are erg s-1 and erg s-1, respectively.
In ten regions (of arcsec2 areas) inside and outside the H-emitting nebula, the -band de-reddened H-subtracted flux is consistent with zero, and the mean of the standard deviations in each region is erg s-1cm-2arcsec-2. We therefore have a upper limit to the -band flux of erg s-1cm-2arcsec-2, or a flux density of 0.0068 mJy arcsec-2. Similarly, we obtain a upper limit to the -band flux (from ten arcsec-2 regions) of erg s-1cm-2arcsec-2, or 0.0196 mJy arcsec-2. From the -band upper limit, we conclude that the optical continuum flux density is times the radio flux density (Gallo et al., 2005), yielding a radio–optical spectral index .
The broadband spectrum is consistent with bremsstrahlung emission with a flat radio–optical continuum and optical emission lines which are at least one order of magnitude more luminous than the continuum. We cannot however definitely state that the radio emission is thermal in origin, as mixed thermal/non-thermal plasma is seen in some environments (e.g. the arcsec-scale jets of SS 433; Migliari et al., 2002). A future measurement of the radio spectral index, which is difficult to achieve, is required to test whether the radio through optical spectrum is consistent with a thermal plasma or requires two (or more) components. Currently the morphology of the radio emission, being spatially coincident with the rather thin optical shell, does seem to favour the single thermal plasma model.
4.1 Morphology and nature of the nebula
The higher S/N in the H image compared to that in Gallo et al. (2005) is striking from the observed structure within the nebula (Fig. 2a). One would expect the most luminous areas of the nebula to occur in regions of the shock front where the line of sight is tangential to its surface and therefore should exist only at the apparent edge of the nebula if the structure is spherical. Filaments of gas are seen within the nebula and are unlikely to originate in unassociated line-of-sight photoionised gas because of their filamental morphology; the nebulosity is less diffuse than the gas in the photoionised H II region. The [O III] / H ratios of in the filaments (see above) and morphology suggest either multiple shock fronts or an uneven non-spherical nebula. The latter is expected for a varying preshock gas density, which is clearly the case on inspection of the variation in H nebulosity close to the nebula.
The [O III] / H image reveals two striking features: firstly the H nebulosity (which extends from the H II region Sh2–101 to the east of the nebula) possesses a low [O III] / H flux ratio compared to the Cyg X–1 nebula, and secondly there exists a thin outer shell to the Cyg X–1 nebula with a higher [O III] / H ratio. H II regions and photoionised gas in general can possess a wide range of [O III] / H ratios (e.g. Johnson, 1953; Blair, Kirshner & Chevalier, 1982) but this morphology of an outer [O III]-emitting shell is only expected from shock-excited gas. These two observations confirm that the gas in the Cyg X–1 nebula must be ionised by a different source to the surrounding nebulosity.
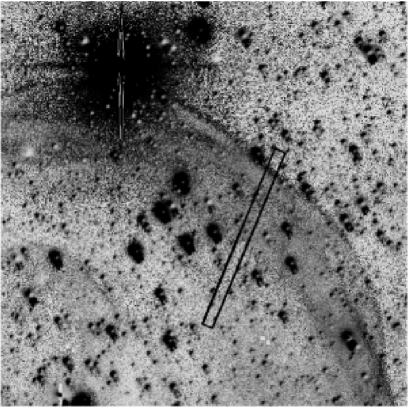
In Fig. 5 we show a blow-up of the north-west area of the nebula in [O III] / H; clearly showing this thin shell of enhanced [O III] / H ratio on the outer side of the ring. We have taken a 3.3 arcsec-wide slice through the image (indicated in Fig. 5) and plot the emission line flux and / flux ratio along this slice in Fig. 6. The upper panel of Fig. 6 shows that there is a sharp outer edge to the ring, and this edge is further out in [O III] than in H. This results in the thin outer shell of enhanced [O III] / H ratio that is visible in the lower panel of Fig. 6. This outer shell is arcsec thick and the rest of the ring is arcsec thick, at least in the region of the slice. We note that the thin shell of enhanced [O III] / H ratio is not due to inaccurate alignment of the [O III] and H images as the stars are aligned and the thin shell exists on both sides of the nebula.

4.2 Constraining the shock velocity and jet power
We measured the / flux ratio in seven ‘slices’ (typical thickness 12 pixels arcsec) of the [O III]-emitting shock front, and in four larger regions behind it. In the thin outer shell we obtain / and behind the shell, / . Taking into account the error from equation 3, / in the shock front and / in the nebula behind the shock front.
Both radiative and non-radiative shock waves are expected to produce a mix of line (radiative recombination) and continuum (due to bremsstrahlung emission) output (e.g. Krolik, 1999). Non-radiative shock waves (defined as when the cooling time of the shocked gas exceeds the age of the shock) produce Balmer optical emission lines only, because the heavier atoms are not excited (e.g. McKee & Hollenbach, 1980), so the existence of the strong [O III] line confirms the radiative nature of the Cyg X–1 nebula shock. In a radiative bow shock, the ambient ISM gas is first perturbed by the approaching radiation field. The ionisation of preshock hydrogen becomes progressively more significant in the velocity range km s-1; below 90 km s-1 the preshock gas is essentially neutral and above 120 km s-1 it is entirely ionised (e.g. Shull & McKee, 1979). In addition, at velocities km s-1 the ionising He II (304Å) photons from the cooling region can doubly ionise the oxygen increasing the intensity of the [O III] lines (McKee & Hollenbach, 1980). This leads to the high excitation line [O III] becoming negligible at low velocities in all shock-wave models (Raymond 1979; Shull & McKee 1979; Dopita et al. 1984; Binette, Dopita & Tuohy 1985; Cox & Raymond 1985; Hartigan, Raymond & Hartmann 1987; Dopita & Sutherland 1995; 1996). The outer shell of the Cyg X–1 nebula, bright in [O III] / H, may originate in the ionised atoms close to the front of the bow shock, and its presence confirms its association with the jet of Cyg X–1.
Radiative shock models predict that relative optical line strengths of the shocked gas are highly sensitive to the temperature and velocity of the shock wave, and vary only weakly with the conditions in the preshock gas such as the elemental abundances (e.g. Cox & Raymond, 1985). Temperatures and velocities of shocked matter, mainly in SNRs, are commonly inferred by comparing their observed optical or ultraviolet (UV) line ratios to these models (e.g. Blair et al., 1991; Vancura et al., 1992; Levenson et al., 1995; Bocchino et al., 2000; Mavromatakis et al., 2001). The bright [O III] / H shock front of the Cyg X–1 nebula appears to be thicker on the western side of the nebula, and the H and [O III] surface brightness is also higher in this region (Fig. 4). This implies the shock may be faster here, possibly due to a lower preshock density; it is the furthest area of the nebula from the H II region (or due to the proper motion of Cyg X–1; see below).

The relation between the shock velocity and [O III] / H ratio in the shell is described for most of the published models of steady-flow radiative shocks with self-consistent pre-ionisation (Cox & Raymond, 1985; Binette et al., 1985; Hartigan et al., 1987; Dopita & Sutherland, 1995). The reliability of these models can be assessed from their level of agreement, unless there are systematic uncertainties common to all models (which seems not to be the case as the velocities predicted by the models are consistent with velocities observed using other methods; e.g. Michael et al., 2000; Pun et al., 2002). In Fig. 7 we plot the aforementioned relation predicted from five of the most advanced radiative shock models. We overplot the empirical [O III] / H ratio found for the Cyg X–1 shock front. Bearing in mind the previously estimated range of shock velocities, 20 km s-1, we find that outside the range km s-1, no models successfully predict the observed [O III] / H measurement to within 1. Subsequently, we infer a temperature of the gas in the shocked shell (Gallo et al., 2005) of K. The models in Fig. 7 assume typical Galactic abundances and preshock particle densities within the range inferred for the Cyg X–1 nebula; cm-3 (Gallo et al., 2005).
By constraining the velocity and temperature of the gas in the shock front, we are able to refine a number of parameters such as the particle density in the shell and power in the jet (Gallo et al., 2005). Table 2 lists the parameters inferred for the nebula and jet. We adopt the same methodology to calculate the parameters as used in Gallo et al. (2005). The temperature-dependent ionisation fraction of the gas is taken from Spitzer (1978). At the temperatures inferred, the hydrogen in the shocked shell is fully ionised. We have improved the accuracy of the shock velocity, the time-averaged jet power and the jet lifetime from dex to dex. Assuming the power originates in the hard state jet which is switched on for percent of the lifetime of Cyg X–1 (e.g. Gallo et al., 2005), the total power of both these jets is between 30 and 100 percent of the bolometric 0.1–200 keV X-ray luminosity ( erg s-1; Di Salvo et al., 2001).
Assuming the shock velocity has been approximately constant over the lifetime of the jet, the jet lifetime –0.04 Myr is much shorter than the estimated age of the progenitor of the black hole, –7 Myr (Mirabel & Rodrigues, 2003). However, given that the proper motion of Cyg X–1 is mas year-1 in a direction degrees from the jet direction (Stirling et al., 2001; Lestrade et al., 1999; Mirabel & Rodrigues, 2003), the system must have travelled between 2.5 and 9.1 arcmins during the lifetime of the jet. We speculate that the jet may have been present for the lifetime of Cyg X–1, but only when the system moved into the ISM close to the H II region did the local density become large enough for a bow shock to form. In fact, the age of the nebula (if it is powered by the jet) cannot exceed Myr because the position of Cyg X–1 at the birth of the jet would be in front of the bow shock. This scenario may also explain the apparent higher [O III] / H ratio and velocity of the gas on the western side of the nebula compared with the eastern side: the western side is further from the jet origin as the Cyg X–1 system moves.
| Parameter | Value |
|---|---|
| Unchanged parameters (Gallo et al., 2005): | |
| Monochromatic radio | erg s-1Hz-1 |
| luminosity | |
| Cyg X–1 – shell separation | cm |
| Jet inclination angle | |
| to line of sight | |
| Thickness of shell | cm |
| Source unit volume | cm3 |
| Bremsstrahlung emissivity | |
| for hydrogen gas | erg s-1Hz-1 cm-3 |
| Gaunt factor | |
| Number density of | cm-3 |
| preshock gas | |
| Refined parameters: | |
| H flux of shell | |
| erg s-1cm-2arcsec-2 | |
| H luminosity of nebula | |
| erg s-1 | |
| [O III] flux of shell | |
| erg s-1cm-2arcsec-2 | |
| [O III] luminosity of | |
| nebula | erg s-1 |
| [O III] / H ratio | / |
| in shock front | |
| [O III] / H ratio | / |
| behind shock front | |
| Optical continuum flux | Jy arcsec-2 |
| density of shell | (3) |
| Shock velocity | km s-1 |
| Shocked gas temperature | K |
| Number density of ionised | cm-3 |
| particles in shell | |
| Ionisation fraction | |
| Number density of total | cm-3 |
| particles in the shell | |
| Jet lifetime | Myr |
| Time-averaged jet power | – erg s-1 |
| Hard state jet power | – erg s-1 |
| including both jets | |
| Outflow power / X-ray | |
| luminosity | |
4.3 Ruling out alternative origins of the shell
We have shown (Section 4.1) that the morphology of the Cyg X–1 nebula indicates the gas is shock-excited and not photoionised; the structure is therefore not a planetary nebula or an H II region. The nebula also cannot be a SNR associated with Cyg X–1 itself (Gallo et al., 2005). The proximity of the nebula to Cyg X–1, its alignment with the Cyg X–1 jet and the agreement of its age inferred from its velocity and from the proper motion of Cyg X–1 (Section 4.2) all point towards the jet-powered scenario. The one remaining alternative is a field SNR not associated with Cyg X–1; we here explore this possibility.
Xu, Zhang & Han (2005a) plot the diameter of 185 Galactic SNRs against their 1 GHz surface brightness (Fig. 3 of that paper). The radio surface brightness of the Cyg X–1 nebula is W m-2 Hz-1 sr-1 (lower than any SNR in the sample of Xu et al., 2005a), and would have a diameter of pc if it were to lie close to the diameter–surface brightness relation for SNRs. The nebula has an angular diameter of arcmin, suggesting a distance to the source of kpc if it is a SNR. However, the authors note that this surface brightness–diameter relation could be severely biased by selection effects (Xu, Zhang & Han, 2005b). Large, low surface-brightness SNRs may not have been detected in surveys due to confusion with strong foreground and background sources (e.g. Green, 2004). We therefore cannot completely rule out a SNR origin to the nebula, but its alignment with the relativistic jet of Cyg X–1 (for example) strongly suggests it is related to the system.
4.4 The search for ISM interactions with the southern jet
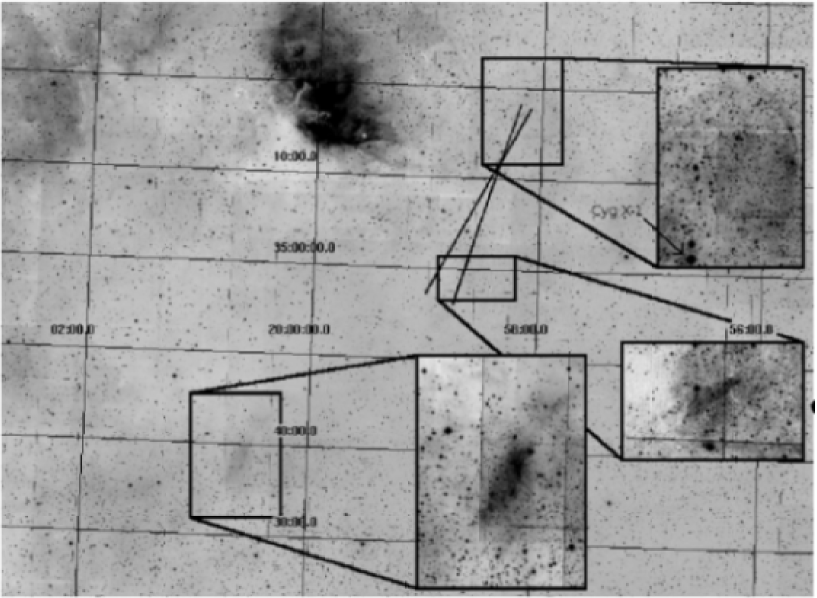
We searched a deg2 field in [O III] south of Cyg X–1 for a shell powered by the southern jet (lower panel of Fig. 1). No shell was observed in the 1800 sec image, nor any visual nebulosity detected in the [O III] images that is consistent with the southern jet of Cyg X–1 interacting with the ISM. The mass density of ISM may be much less to the south; the jet should travel essentially ballistically and undetected until being decelerated by a denser region. Heinz (2002) found that the rarity of jet-powered lobes in microquasars compared to AGN is likely due to the lower density environment. In addition, it is interesting to note that the X-ray-bright shocked edges surrounding AGN radio lobes are sometimes one-sided (Kraft et al., 2003). We searched a deg2 H mosaic from the IPHAS survey (Drew et al., 2005, see Fig. 8). Two candidate ‘hot spots’ analogous to those associated with AGN jets were identified, and are expanded in the figure.
Radio emission exists in the region close to the northern hot spot according to Martí et al. (1996), but it is uncertain whether it originates in point sources or extended emission. We inspected the southern region of the 1.4 GHz radio image obtained by Gallo et al. (2005) to search for diffuse emission. In a 16001600 arcsec region close to the more northern H hot spot (the southern hot spot is not within the radio field of view), the mean r.m.s. flux density is Jy beam-1, yielding a 3 upper limit to the (putative) radio hot spot in that region of 1.2 mJy beam-1. Deeper radio observations are needed to test whether the candidate H hot spots have radio counterparts, as would be expected if they are jet–ISM interaction sites. In addition, observations in [S II] would test whether the emitting gas is shock-excited or photoionised, and deeper [O III] observations may constrain the velocity of any shocked gas.
5 Conclusions
We have imaged the shell-like nebula supposedly powered by the jet of Cyg X–1 in narrowband optical emission line filters. The nebula is bright in H and [O III] and the morphology and line ratios indicate that it is a radiative shock wave with a velocity km s-1. We rule out alternative interpretations of the structure such as photoionised gas, but cannot completely rule out an unrelated SNR origin. However, the morphology of the nebula and its alignment with the jet of Cyg X–1 strongly suggest that it is indeed powered by this jet. We have probably isolated for the first time the thin, hot, compressed gas close to the bow shock front of a nebula powered by an X-ray binary jet. The time-averaged power of the jet must be – erg s-1 to power a shock wave of the inferred size, luminosity, velocity and temperature. If the steady hard state jet of Cyg X–1 (that is active for percent of the time) is providing this power (rather than the transient jet; Fender et al., 2006), the total energy of both jets in the hard state is 0.3–1.0 times the bolometric X-ray luminosity. This provides the strongest evidence so far that at an accretion rate of percent Eddington, Cyg X–1 is in a state of approximate equipartition between radiative and kinetic output. Lower accretion rates should therefore be jet-dominated (Fender et al. 2003; Körding, Fender & Migliari 2006). The inferred age of the nebula is consistent with the time Cyg X–1 has been close to the currently nearby H II region.
No nebula associated with the southern jet of Cyg X–1 is observed, although we detect two putative H ‘hot spots’ that require optical emission line and radio follow-up to confirm their nature. Optical and UV (e.g. Blair et al., 1991) spectra of the northern shell will provide invaluable insights into the properties of the shocked gas, and hence the jet.
Acknowledgements We would like to thank Mischa Schirmer for extensive help with the usage of the data reduction pipeline package THELI. We also thank Elmar Körding, Sebastian Heinz and Manfred Pakull for stimulating discussions. This paper makes use of data from the Isaac Newton Telescope, operated on the island of La Palma by the Isaac Newton Group in the Spanish Observatorio del Roque de los Muchachos of the Instituto de Astrofisica de Canarias. EG is supported by NASA through Chandra Postdoctoral Fellowship Award PF5-60037, issued by the Chandra X-Ray Observatory Center, which is operated by the Smithsonian Astrophysical Observatory for and on behalf of NASA under contract NAS8-39073.
References
- Binette et al. (1985) Binette L., Dopita M. A., Tuohy I. R., 1985, ApJ, 297, 476
- Blair et al. (1982) Blair W. P., Kirshner R. P., Chevalier R. A., 1982, ApJ, 254, 50
- Blair et al. (1991) Blair W. P., et al., 1991, ApJ, 379, L33
- Blandford & Königl (1979) Blandford R. D., Königl A., 1979, ApJ, 232, 34
- Bocchino et al. (2000) Bocchino F., Maggio A., Sciortino S., Raymond J., 2000, A&A, 359, 316
- Burbidge (1959) Burbidge G. R., 1959, ApJ, 129, 849
- Carilli et al. (1994) Carilli C. L., Perley R. A., Harris D. E., 1994, MNRAS, 270, 173
- Castor et al. (1975) Castor J., McCray R., Weaver R., 1975, ApJ, 200, L107
- Celotti & Fabian (1993) Celotti A., Fabian A. C., 1993, MNRAS, 264, 228
- Chaty et al. (2001) Chaty S., Rodríguez L. F., Mirabel I. F., Geballe T. R., Fuchs Y., Claret A., Cesarsky C. J., Cesarsky D., 2001, A&A, 366, 1035
- Corbel & Fender (2002) Corbel, S., Fender, R. P. 2002, ApJ, 573, L35
- Corbel et al. (2002) Corbel S., Fender R. P., Tzioumis A. K., Tomsick J. A., Orosz J. A., Miller J. M., Wijnands R., Kaaret P., 2002, Sci, 298, 196
- Cox (1972) Cox, D. P., 1972, ApJ, 178, 143
- Cox & Raymond (1985) Cox D. P., Raymond J. C., 1985, ApJ, 298, 651
- Croston et al. (2006) Croston J. H., Kraft R. P., Hardcastle M. J., 2006, astro-ph/0610889
- Di Salvo et al. (2001) Di Salvo T., Done C., Życki P. T., Burderi L., Robba N. R., 2001, ApJ, 547, 1024
- Dopita et al. (1984) Dopita M. A., Binette L., Dodorico S., Benvenuti P., 1984, ApJ, 276, 653
- Dopita & Sutherland (1995) Dopita M., Sutherland R. S., 1995, ApJ, 455, 468
- Dopita & Sutherland (1996) Dopita M., Sutherland R. S., 1996, ApJS, 102, 161
- Drew et al. (2005) Drew J. E., et al., 2005, MNRAS, 362, 753
- Dunn et al. (2006) Dunn R. J. H., Fabian A. C., Celotti A., 2006, MNRAS, 372, 1741
- Erben et al. (2005) Erben T., et al., 2005, AN, 326, 432
- Fender (2001) Fender R. P., 2001, MNRAS, 322, 31
- Fender (2006) Fender R. P., 2006, in Compact Stellar X-Ray Sources, eds. Lewin W. H. G., van der Klis M., Cambridge University Press, p. 381
- Fender et al. (2004) Fender, R. P., Belloni, T. M., Gallo, E. 2004, MNRAS, 355, 1105
- Fender et al. (2003) Fender R. P., Gallo E., Jonker P. G., 2003, MNRAS, 343, L99
- Fender et al. (2006) Fender R. P., Stirling A. M., Spencer R. E., Brown I., Pooley G. G., Muxlow T. W. B., Miller-Jones J. C. A., 2006, MNRAS, 369, 603
- Fomalont et al. (2001) Fomalont E. B., Geldzahler B. J., Bradshaw C. F., 2001, ApJ, 558, 283
- Forman et al. (2005) Forman W., et al., 2005, ApJ, 635, 894
- Gallo et al. (2003) Gallo, E., Fender, R. P., Pooley, G. G. 2003, MNRAS, 344, 60
- Gallo et al. (2005) Gallo E., Fender R. P., Kaiser C., Russell, D. M., Morganti R., Oosterloo T., Heinz S., 2005, Nat, 436, 819
- Green (2004) Green D. A., 2004, Bull. Astr. Soc. India, 32, 335
- Hartigan et al. (1987) Hartigan P., Raymond J., Hartmann L., 1987, ApJ, 316, 323
- Hartmann & Burton (1997) Hartmann D., Burton W. B., 1997, Atlas of Galactic Neutral Hydrogen, Cambridge Univ. Press, Cambridge
- Heinz (2002) Heinz S., 2002, A&A, 388, L40
- Heinz (2006) Heinz S., 2006, ApJ, 636, 316
- Heinz et al. (1998) Heinz S., Reynolds C. S., Begelman M. C., 1998, ApJ, 501, 126
- Homan & Belloni (2005) Homan J., Belloni T., 2005, Ap&SS, 300, 107
- Homan et al. (2005) Homan, J., Buxton, M., Markoff, S., Bailyn, C. D., Nespoli, E., Belloni, T. 2005, ApJ, 624, 295
- Johnson (1953) Johnson H. M., 1953, ApJ, 118, 370
- Kaiser & Alexander (1997) Kaiser C. R., Alexander P, 1997, MNRAS, 286, 215
- Kaiser et al. (2004) Kaiser C. R., Gunn K. F., Brocksopp C., Sokoloski J. L., 2004, ApJ, 612, 332
- King (1985) King D. L., 1985, ING La Palma Technical Notes, 31
- Körding et al. (2006) Körding E., Fender R. P., Migliari S., 2006, MNRAS, 369, 1451
- Kraft et al. (2003) Kraft R. P., Vázquez S. E., Forman W. R., Jones C., Murray S. S., Hardcastle M. J., Worrall D. M., Churazov E., 2003, ApJ, 592, 129
- Krolik (1999) Krolik J. H., 1999, Active Galactic Nuclei: From the Central Black Hole to the Galactic Environment, Princeton Univ. Press, Princeton
- Lestrade et al. (1999) Lestrade J.-F., Preston R. A., Jones D. L., Phillips R. B., Rogers A. E. E., Titus M. A., Rioja M. J., Gabuzda D. C., 1999, A&A, 344, 1014
- Levenson et al. (1995) Levenson N. A., Kirshner R. P., Blair W. P., Winkler P. F., 1995, AJ, 110, 739
- Martí et al. (1996) Martí J., Rodriguez L. F., Mirabel I. F., Paredes J. M., 1996, A&A, 306, 449
- Massey et al. (1995) Massey P., Johnson K. E., Degioia-Eastwood K., 1995, ApJ, 454, 151
- Mavromatakis et al. (2001) Mavromatakis F., Ventura J., Paleologou E. V., Papamastorakis J., 2001, A&A, 371, 300
- McClintock & Remillard (2006) McClintock J. E., Remillard R. A., 2006, in Compact Stellar X-Ray Sources, eds. Lewin W. H. G., van der Klis M., Cambridge University Press, p. 157
- McKee & Hollenbach (1980) McKee C. F., Hollenbach D. J., 1980, ARA&A, 18, 219
- Michael et al. (2000) Michael E., et al., 2000, ApJ, 542, L53
- Migliari et al. (2002) Migliari S., Fender R., Méndez, M., 2002, Sci, 297, 1673
- Mirabel et al. (1992) Mirabel I. F., Rodríguez L. F., Cordier B., Paul J., Lebrun F., 1992, Nat, 358, 215
- Mirabel & Rodrigues (2003) Mirabel I. F., Rodrigues I., 2003, Sci, 300, 1119
- Nowak et al. (2005) Nowak M. A., Wilms J, Heinz S., Pooley G., Pottschmidt K., Corbel S., 2005, ApJ, 626, 1006
- Nulsen et al. (2005) Nulsen P. E. J., McNamara B. R., Wise M. W., David L. P., 2005, ApJ, 628, 629
- Ogley et al. (2000) Ogley R. N., Bell Burnell S. J., Fender R. P., Pooley G. G., Waltman E. B., 2000, MNRAS, 317, 158
- Osterbrock (1989) Osterbrock D. E., 1989, Astrophysics of Gaseous Nebulae and Active Galactic Nuclei. University Science Books, Sausalito CA
- Perryman et al. (1997) Perryman M. A. C., et al., 1997, A&A, 323, L49
- Predehl & Schmitt (1995) Predehl, P., Schmitt, J. H. M. M. 1995, A&A, 293, 889
- Pun et al. (2002) Pun C. S. J., et al., 2002, ApJ, 572, 906
- Raymond (1979) Raymond J. C., 1979, ApJS, 39, 1
- Rodríguez et al. (1992) Rodríguez L. F., Mirabel I. F., Martí J., 1992, ApJ, 401, L15
- Russell et al. (2006) Russell D. M., Fender R. P., Hynes R. I., Brocksopp C., Homan J., Jonker P. G., Buxton M. M., 2006, MNRAS, 371, 1334
- Schwartz (1983) Schwartz R. D., 1983, ARA&A, 21, 209
- Shull & McKee (1979) Shull J. M., McKee C. F., 1979, ApJ, 227, 131
- Spitzer (1978) Spitzer L., 1978, Physical processes in the interstellar medium, New York Wiley-Interscience, 333
- Stirling et al. (2001) Stirling A. M., Spencer R. E., de la Force C. J., Garrett M. A., Fender R. P., Ogley R. N., 2001, MNRAS, 327, 1273
- Tudose et al. (2006) Tudose V., Fender R. P., Kaiser C. R., Tzioumis A. K., van der Klis M., Spencer R., 2006, MNRAS, 372, 417
- Vancura et al. (1992) Vancura O., Blair W. P., Long K. S., Raymond J. C., 1992, ApJ, 394, 158
- Wilson et al. (2006) Wilson A. S., Smith D. A., Young A. J., 2006, ApJ, 644, L9
- Wu et al. (1982) Wu C.-C., Holm A. V., Eaton J. A., Milgrom M., Hammerschlag-Hensberge G., 1982, PASP, 94, 149
- Xu et al. (2005a) Xu J-W., Zhang X-Z., Han J-L., 2005a, ChJAA, 5, 165
- Xu et al. (2005b) Xu J-W., Zhang X-Z., Han J-L., 2005b, ChJAA, 5, 442