Star formation in the hosts of GHz peaked spectrum and compact steep spectrum radio galaxies
Abstract
Aims. We searched for star formation regions in the hosts of potentially young radio galaxies (gigahertz peaked spectrum and compact steep spectrum sources).
Methods. We used near-UV imaging with the Hubble Space Telescope Advanced Camera for Surveys.
Results. We find near-UV light could be the product of recent star formation in five of the nine observed sources, though other explanations are not currently ruled out. An additional two sources show marginal detections. The UV luminosities of the GPS and CSS sources are similar to those of a sample of nearby large-scale radio galaxies. Stellar-population synthesis models are consistent with a burst of recent star formation occurring before the formation of the radio source. However, observations at other wavelengths and colors are needed to definitively establish the nature of the observed UV light. In the CSS source 1443+77, the near-UV light is aligned with and is co-spatial with the radio source. We suggest that the UV light in this source is produced by star formation triggered and/or enhanced by the radio source.
Key Words.:
Galaxies: active – Galaxies: starburst – Galaxies: evolution – Galaxies: stellar content – Galaxies: interaction – Ultraviolet: galaxieslabiano at damir.iem.csic.es
1 Introduction
The relationship between black hole mass and galaxy mass implies that the growth and evolution of black holes (therefore AGN) and their host galaxies must somehow be related (e.g., Gebhardt et al. 2000). Mergers and strong interactions can trigger AGN activity in a galaxy (e.g., Heckman et al. 1986; Baum et al. 1992; Israel 1998). These events can also produce instabilities in the ISM and trigger star formation (e.g., Ho 2005). Numerical simulations and models (e.g., Mellema et al. 2002; Rees 1989) suggest that the advancement of the jets through the host galaxy environment can also trigger star formation. Imaging studies in the ultraviolet (UV) light of large 3CR sources find evidence for episodes of star formation starting around the time when the radio source was triggered (i.e. yr, Koekemoer et al. 1999; Allen et al. 2002; Chiaberge et al. 2002; O’Dea et al. 2001, 2003; Martel et al. 2002), suggesting a possible link.
Gigahertz peaked spectrum (GPS) and compact steep spectrum (CSS) radio sources are apparently young, smaller (GPS kpc, CSS 15 kpc, for a review see O’Dea 1998) versions of the large powerful radio sources, so they are expected to exhibit signs of more recent star formation. In addition, their subgalactic size makes them excellent probes of the interactions between the expanding lobes and the host. They have not completely broken through the host ISM, so these interactions are expected to be more important than in the larger sources.
Near UV observations are very sensitive to the presence of hot young stars and as such will trace recent star formation events. We have therefore obtained high-resolution HST/ACS near-UV images of these young compact sources to study the morphology and the extent of recent star formation.
This is the first time a sample of GPS and CSS sources has been imaged in the near-UV. It is also the first time that the relative sizes of radio sources in well-matched samples are used to study time evolution of merger-induced and jet-induced star formation.
2 Observations and data reduction
We have obtained high resolution near-UV images with the High Resolution Channel (HRC) of the Advanced Camera for surveys (ACS) on board the Hubble Space Telescope, through the F330W filter, with integration times of 1800 seconds. The objects observed are GPS and CSS galaxies 1117+146, 1233+418, 1345+125, 1443+77, 1607+268, 1814–637, 1934–638, 1946+708, 2352+495 (Table 1). Our sample is chosen to be representative of GPS and CSS sources with z 0.5, and nearby enough to eliminate strong effects due to evolution with cosmic time. The objects are drawn primarily from the well-defined samples of Fanti et al. (1990), Fanti et al. (2001), Stanghellini (1992) and Stanghellini et al. (1997). The comparison sample of large 3CR sources consists of FR I and FR II sources with redshifts less than 0.1 observed in the near-UV by Allen et al. (2002).
The standard ACS reduction pipeline was used to remove detector signatures such as bias, dark current, flat field and to perform flux calibration. Each target was observed in a three-point dither pattern. The frames were combined with Multidrizzle (Koekemoer et al. 2002) to correct for geometric distortions and cosmic rays. The resulting ACS images have a signal to noise of 100 for the brightest objects and 5 for the faintest.
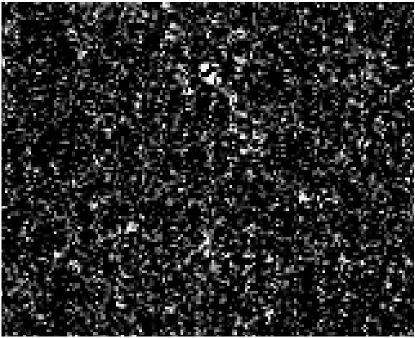
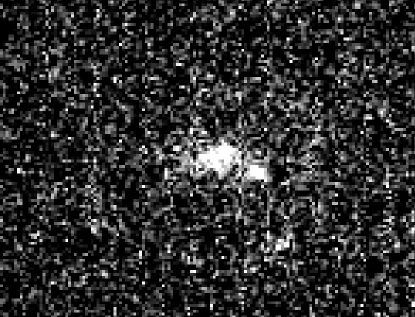
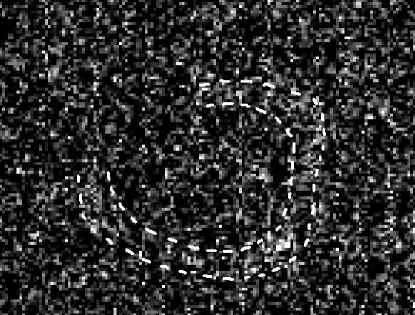
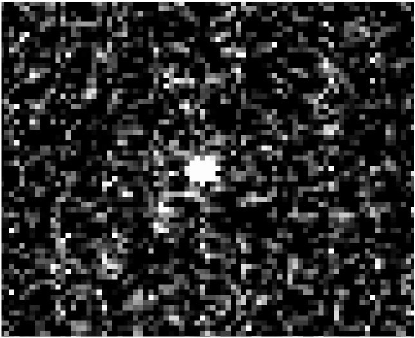
The 2-D fitting code GALFIT (Peng et al. 2002) was used to parameterize the UV emission. For each image we tested different combinations of point source and Sersic profiles, allowing the sky level, position and magnitudes of all components, as well the index and effective radii of the Sersic components, to vary. The final model was chosen according to the lowest and best residuals (with the lowest number of components). The results are summarized in Table 2. Figure 1 shows the UV image, GALFIT model and residuals for the nine objects. These will be discussed in detail in Section 4.
![[Uncaptioned image]](/html/astro-ph/0701619/assets/x16.png)
![[Uncaptioned image]](/html/astro-ph/0701619/assets/x17.png)
![[Uncaptioned image]](/html/astro-ph/0701619/assets/x18.png)
![[Uncaptioned image]](/html/astro-ph/0701619/assets/x19.png)
![[Uncaptioned image]](/html/astro-ph/0701619/assets/x20.png)
![[Uncaptioned image]](/html/astro-ph/0701619/assets/x21.png)
![[Uncaptioned image]](/html/astro-ph/0701619/assets/x22.png)
![[Uncaptioned image]](/html/astro-ph/0701619/assets/x23.png)
![[Uncaptioned image]](/html/astro-ph/0701619/assets/x24.png)
![[Uncaptioned image]](/html/astro-ph/0701619/assets/x25.png)
![[Uncaptioned image]](/html/astro-ph/0701619/assets/x26.png)
![[Uncaptioned image]](/html/astro-ph/0701619/assets/x27.png)
| (1) |
where is the intensity at the effective radius, (distance that encloses half of the total emission), and is a constant coupled to the value of . Special cases of the Sersic profile are those where (de Vaucouleurs profile), (exponential profile) and (Gaussian profile).
The TinyTim (Space Telescope Science Institute program to generate simulated HST point spread functions) models for the HRC PSF are not sufficient for our purposes. Instead, we used the calibration plan observations of Cycles 12 and 13 (programs 10054 and 10374). These programs contain observations of the spectrophotometric standard stars GD71, G191B2B, GD153 and HZ~14. To model our PSF, we compared the PSF created by each of these stars in each Cycle, as well as combinations of these. In general, the differences between each PSF are subtle and do not produce major differences in the models of the sources. However, the average PSF of the spectrophotometric stars of Cycle 13 produced better point source results (lower and residuals) so we chose to use it in our models. This PSF has a FWHM of 1.9 pixels, implying a resolution of . However, the residuals for 1814–637 suggest that an even better PSF model is required (see Figure 1).
GALFIT yields the coordinates of the modeled components in pixels. The conversion to RA and Dec was performed using the astrometry information stored in the header of each HST/ACS -pipeline reduced- image (model errors are listed in Table 2). The radio positions of the sources are from the literature. However, the registration between HST and radio frames can be off by as much as 1.
Unless otherwise noticed, all presented fluxes, luminosities and magnitudes are for the F330W filter passband, corrected for galactic extinction and k-correction. The magnitudes are in the STMAG system. Galactic extinction was corrected using the Galactic de-reddening curve in Cardelli et al. (1989) and the measured Galactic extinction values of Schlegel et al. (1998). K-correction (typically 0.1, 0.2 magnitudes) and conversion of the Allen et al. (2002) filters were done following the PEGASE (Fioc & Rocca-Volmerange 1997) templates and using the IRAF package SYNPHOT. SYNPHOT was also used for measuring F330W magnitudes of the PEGASE and GALAXEV (Bruzual & Charlot 2003) stellar population models.We use H0=71, (Spergel et al. 2003) throughout the paper.
3 Nuclear and emission line contamination
Here we discuss several possible contributions to the near-UV light in these radio galaxies. Using ground-based, optical spectroscopy, Tadhunter et al. (2002) studied the nature of the UV excess in GPS, CSS and FR II sources at redshifts 0.15 z 0.7. They found that the UV continuum in these sources has contributions from (1) nebular continuum, (2) direct AGN light, (3) scattered AGN light, and a (4) starburst component. In addition to these continuum components we also consider contamination from emission line gas.
The observed objects are Narrow Line Radio Galaxies (NLRG) so we expect no contamination from direct light from the AGN. The main contribution from emission line gas to our observations would come from Mg ii (see Table 1). It is usually only found in the nuclear Broad Line Region (BLR) of AGN hosts so we do not expect direct contamination from emission line gas.
To make a rough estimation of the extent of the possible contamination by direct light from the AGN, we use the STIS spectrum of 3C~277.1 (Labiano et al. 2005), a CSS QSO that could represent our worst case scenario: when we are looking into the nucleus. In 3C~277.1, all signs from nuclear contribution (broad lines and AGN continuum) and Mg ii emission disappear at 0.8 kpc from the nucleus, roughly 1.5 times the FWHM of the PSF in the STIS observations. On average, 0.8 kpc correspond to in our ACS observations and we could expect the nuclear traces to disappear closer to the center in our ACS galaxies. The C ii] line is usually fainter than Mg ii (Peterson 1997) in AGN (it is also not present in 3C~277.1) so it is unlikely that it is affecting our observations.
There are UV polarization observations of only two objects, 1934–638 and 1345+125, so the presence of scattered nuclear light in the sample cannot be completely ruled out. Tadhunter et al. (2002) find AGN scattered light in of their sample (including the GPS 1934–638), but in most cases it does not seem to dominate the UV emission. As we note below in Section 5.1, the UV light in the GPS sources tends not to be aligned with the radio source suggesting that it is not due to scattered nuclear light (assuming the scattered photons would escape along the radio axis). Observations of 1345+125 by Hurt et al. (1999) are consistent with the existence of polarized UV light (though with large uncertainty). However, Tadhunter et al. (2005) found evidence of recent star formation and strong jet cloud interactions in 1345+125 (see also Holt et al. 2003; Surace et al. 1998).
In general, the contribution from nebular continuum in radio galaxies varies between 3 and 40 (Tadhunter et al. 2002). However, 3 out of the 4 CSS they studied are dominated by young stellar populations. Furthermore, for up to 50 of their sources (including GPS, CSS and FR II), the UV excess is dominated by young stellar populations. Similar results have been found for FR I and FR II sources at a range of redshifts (Aretxaga et al. 2001; Wills et al. 2002, 2004).
To sum up, the most probable sources of UV light in our images are star formation, scattered nuclear light and nebular continuum. However, it is likely that the contributions of the latter two are small.
4 UV morphology
| Source | Catalogue | ID | Sample | Redshift | Emission lines |
|---|---|---|---|---|---|
| 1117+146 | 4C 14.41 | G | GPS | 0.362 | C ii] 2326, Mg ii 2800 |
| 1233+418 | G | CSS | 0.25 | Mg ii 2800 | |
| 1345+125 | 4C 12.50 | G | GPS | 0.12174 | Mg ii 2800 |
| 1443+77 | 3C~303.1 | G | CSS | 0.267 | C ii] 2326, Mg ii 2800 |
| 1607+268 | CTD~093 | G | GPS | 0.473 | C ii] 2326 |
| 1814–637 | G | CSS | 0.063 | [Ne V] 3426 | |
| 1934–638 | G | GPS | 0.183 | 2 Mg ii 2800 | |
| 1946+708 | G | GPS | 0.10083 | Mg ii 2800 | |
| 2352+495 | DA~611 | G | GPS | 0.23790 | Mg ii 2800 |
B1950 IAU and catalogue names, identification, GPS/CSS classification, redshift and possible emission lines affecting our measurements.
| Source | Component | RA (J2000) | Dec (J2000) | STMAG | Re (mas) | Re (pc) | Index | Ratio | PA |
|---|---|---|---|---|---|---|---|---|---|
| 1117+146 | Fey et al. (2004) | 11:20:27.807 0.001 | +14:20:54.99 0.02 | ||||||
| Point source | 11:20:27.7653 0.0001 | 14:20:54.33 0.06 | 24.060.06 | ||||||
| 1233+418 | Becker et al. (1995) | 12:35:35.71 0.03 | +41:37:07.40 0.32 | ||||||
| Point source (?) | 12:35:35.6664 0.0004 | +41:37:08.18 0.17 | 24.930.11 | ||||||
| 1345+125 | Ma et al. (1998) | 13:47:33.3616 | +12:17:24.240 | ||||||
| Point source | 13:47:33.3981 0.0001 | +12:17:23.36 0.04 | 23.770.05 | ||||||
| Point Source | 13:47:33.3947 0.0002 | +12:17:23.46 0.01 | 21.490.01 | ||||||
| Sersic profile | 13:47:33.3950 0.0001 | +12:17:23.41 0.06 | 21.200.04 | 108 7 | 23415 | 1.62 0.13 | 0.760.03 | –39 | |
| Sersic profile | 13:47:33.5272 0.0003 | +12:17:23.24 0.21 | 21.840.12 | 299 58 | 647126 | 2.290.38 | 0.540.05 | 19 | |
| 1443+77 | Rengelink et al. (1997) | 14:43:14.91.1 | +77:07:28.63.8 | ||||||
| Point source (?) | 14:43:14.666 0.001 | +77:07:27.546 0.17 | 25.21 0.10 | ||||||
| Point source | 14:43:14.5832 0.0004 | +77:07 27.702 0.06 | 24.06 0.06 | ||||||
| Sersic profile | 14:43:14.656 0.002 | +77:07:27.430 0.10 | 20.36 0.16 | 1100200 | 4500800 | 2.660.33 | 0.450.02 | 83 | |
| 1607+268 | Beasley et al. (2002) | 16:09:13.3208 | +26:41:29.036 | ||||||
| Point source | 16:09:13.2497 0.0002 | +26:41:29.514 0.14 | 24.38 0.09 | ||||||
| Point Source | 16:09:13.2472 0.0002 | +26:41:29.515 0.14 | 23.92 0.05 | ||||||
| 1814–637 | Ma et al. (1998) | 18:19:35.003 0.003 | –63:45:48.194 0.01 | ||||||
| Point source | 18:19:35.3179 0.0001 | –63:45:47.117 0.01 | 16.380.10 | ||||||
| 1934–638 | Ma et al. (1998) | 19:39:25.027 0.001 | –63:42:45.626 | ||||||
| Point source | 19:39 25.0947 0.0009 | –63:42:44.978 0.13 | 23.810.73 | ||||||
| Sersic profile | 19:39:25.0935 0.0001 | –63:42:44.974 0.02 | 21.750.12 | 395 | 11915 | 1.020.33 | 0.130.04 | 38 | |
| Sersic profile | 19:39:25.1032 0.0007 | -63 42:45.037 0.06 | 21.080.07 | 35445 | 1078137 | 2.510.26 | 0.470.02 | 68 | |
| 1946+708 | Beasley et al. (2002) | 19:45:53.5200 0.002 | +70:55:48.732 | ||||||
| Point source (?) | 19:45:53.3016 0.0006 | +70:55:48.476 0.12 | 24.530.08 | ||||||
| 2352+495 | Ma et al. (1998) | 23:55:09.458 0.001 | +49:50:08.340 0.01 | ||||||
| Point source | 23:55:09.4704 0.0004 | +49:50:07.326 0.16 | 25.130.16 | ||||||
| Point source (?) | 23:55:09.4634 0.0006 | +49:50:07.507 0.25 | 25.530.19 | ||||||
| Point source | 23:55:09.4828 0.0003 | +49:50:07.531 0.12 | 24.790.10 |
The first line for each source corresponds to the most recent radio position, the rest of the lines correspond to the UV components of the GALFIT models. Errors not listed are smaller than 0.1 milliarcsec. The coordinates in the GALFIT models are from the HST coordinate system and correspond to the brightest pixel. The magnitudes are observed, not corrected from galactic extinction. Re is the effective radius in milliarcsec. Last three columns give the Sersic indices axial ratios and position angles. The “?” marks marginal detections.
We have modeled the UV emitting regions with GALFIT and found that 1117+146 and 1814–637. show one point source component. There is a marginal detection of a point source in 1233+418 and 1946+708. The hosts of 1345+125, 1443+77 and 1934–638 show a combination of at least one Sersic111The Sersic profiles are used to parameterize the data. It does not necessarily imply that these UV components are galaxies. component (with different indices) and one or several point sources (see Table 2 and Figure 1). 1607+268 and 2352+495 show a combination of two and three point sources respectively. In the near-IR, de Vries et al. (2000) find Sersic indices 2 n 5 and effective radii 2 kpc R 4 kpc for GPS and CSS sources. Most of our data show point sources and/or Sersic profiles with indices n and radii R parsec. The presence of these small clumps of near-UV emission is consistent with star forming regions in the host. Before addressing the nature of the UV emission, we describe the properties of this emission in relation to other properties, for the individual sample sources. We note that optical observations of the higher redshift Parkes half-Jansky sample suggest that the rest frame UV may contain a contribution from a young stellar population (de Vries et al. 2007).
For our observations, the 3 detection limit, for a point source (FWHM 3 pixels) is 25.7 (no Galactic extinction applied), calculated from the noise in the images. The ACS Imaging Exposure Time Calculator gives the following 3 detection limits for our observations: Johnson U = 21/arcsec2 for an extended uniform source (2x2 pixel extraction region) and 25.2 for a point source222Sources with a B star spectrum and fluxes ergs cm2/s/Å/arcsec2 (extended source) and 6.0 ergs cm2/s/Å (point source), at 3000Å.. For comparison purposes with this limit and published data, the magnitudes listed in this section and Table 2 have not been corrected for Galactic extinction.
4.1 Notes on individual sources
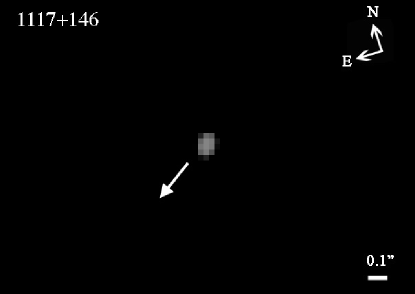
1117+146: Identified as a GPS by O’Dea et al. (1991). The counterpart of the radio source corresponds to a mR=20.1 galaxy (de Vries et al. 1995) at z = 0.362 (de Vries et al. 1998b). Radio observations (e.g., Fey & Charlot 1997) show a 100 mas double radio source. Our image shows an unresolved 24.06 magnitude source.
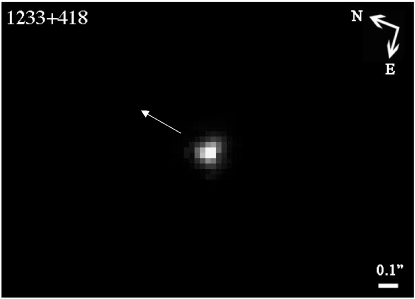
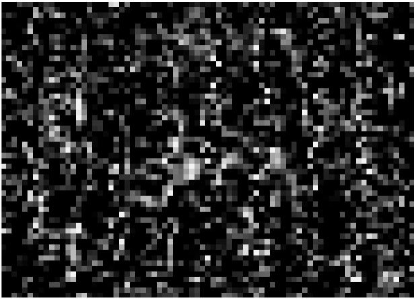
1233+418: A CSS galaxy with a photometric R-band redshift zR = 0.25 (Fanti et al. 2004). We have a marginal detection of a point source with magnitude 24.93. Our image (see Figure 1, first panel) suggests faint extended emission towards Northeast but the errors in the GALFIT model for this component are too large to be sure of its existence. Checking the individual pre-drizzle images, it is not clear if these components are real or artifacts.
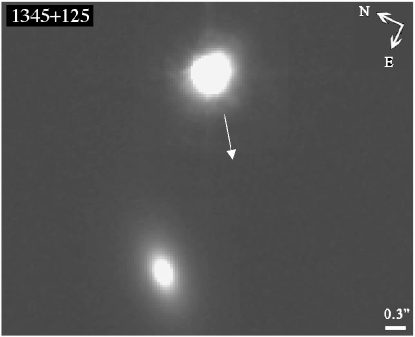
1345+125: 4C~+12.50. A long known peaked spectrum radio source (e.g., Véron 1971). The counterpart of this GPS source is a mR=15.5 galaxy (e.g., Stanghellini et al. 1993) at z = 0.12174 (Holt et al. 2003), in a cluster of fainter galaxies (Stanghellini et al. 1993). IR images of this well known ULIRG show an extremely reddened source with two nuclei separated (4 kpc) embedded in a common envelope and aligned roughly East-West (e.g., Scoville et al. 2000; Surace & Sanders 2000) suggesting an ongoing merger, which may have triggered the AGN (e.g., Heckman et al. 1986; Xiang et al. 2002). The western nucleus is the brightest and shows a Seyfert 2 spectrum (Gilmore & Shaw 1986). Veilleux et al. (1997) suggest that the source may have a hidden quasar, also supported by UV polarized continuum emission (p=16.4, the polarization vector approximately perpendicular to the radio axis Hurt et al. 1999). VLBI imaging shows a complex, distorted 100 mas (0.2 kpc) source (e.g., Lister et al. 2003), roughly oriented North-South (PA). Older observations of 1345+125 related the radio s ource to the East nucleus but improved astrometry showed that it is related to the western one (e.g. Stanghellini et al. 1997; Axon et al. 2000; Fanti 2000). Evans et al. (1999) study the molecular gas in 1345+125 and suggest that the molecular gas is fueling the AGN. Our UV image detects both nuclei separated by . The East component was modeled with a Sersic profile with index 2.3 and an effective radius and magnitude 21.84. The West nucleus shows a more complex structure: an extended component with magnitude 21.20 and Sersic index 1.62 and a point source with magnitude 21.49. This more complex structure could be due to interaction with the radio source, the Eastern component or a combination of both. Optical emission line images (Axon et al. 2000; Batcheldor et al. 2006) show an arc of emission North of the Western nucleus and fainter emission at . We do not detect UV emission associated with these emission line features. They a lso detect a faint tail of emission stretching from the West nucleus towards the west, present in our image and not modeled by GALFIT (see Figure 1). Surace et al. (1998) detect compact blue knots in 1345+125 around the source which they attribute to star forming regions. We detect the southern knots south of the nuclei but not the northern one (see Figure 1).
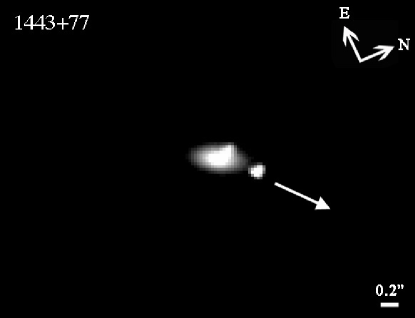
1443+77: 3C~303.1. The optical counterpart of this CSS corresponds to a galaxy of m20 (e.g., Sanghera et al. 1995), at z = 0.267 (Kristian et al. 1978). The MERLIN map (Sanghera et al. 1995) shows a long (7 kpc) double radio source aligned NW-SE (PA ) aligned with the inner emission line gas (e.g. de Vries et al. 1999). XMM-Newton observations detect the ISM of the host galaxy as well as a second component which could be either Synchrotron Self Compton from the Southern radio lobe or hot gas shocked by the expansion of the radio source (O’Dea et al. 2006). The center of 1443+77 shows a complex structure in the optical, which could be due to an ongoing merger (e.g., de Vries et al. 1997; Axon et al. 2000) and it also shows up in our UV image. Axon et al. (2000) and de Vries et al. (1999) find an arc of emission south of the nucleus of the source and McCarthy et al. (1995) detects circumnuclear [O iii] as far as 3 from the center. Our image suggests the presence of an arc of emission (4 kpc) from the nucleus. The integrated magnitude of this arc is 23. A region of the sky with the same area has a magnitude 25. The GALFIT model of the source consists of two point sources of magnitudes 25.21 (marginal detection) and 24.06, and an extended component with Sersic index 2.66 and effective radius 1.1 (4.5 kpc). The arc is not modeled by GALFIT so it is visible in the residuals of Figure 1. 1443+77 is the best candidate in our sample to be undergoing jet induced star formation (see below).
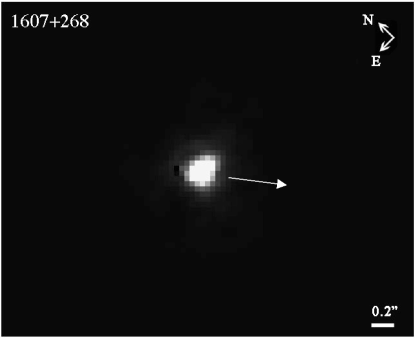
1607+268: Also known as CTD93. VLBI maps (e.g. Dallacasa et al. 1998) show a two-component, 60 mas, GPS source. The counterpart is a galaxy at z = 0.473 (O’Dea et al. 1991) with mr = 20.4 (Stanghellini et al. 1993). We observe two point sources of magnitudes 24.38 and 23.92.
1814–637: VLBI imaging shows a two component CSS galaxy (e.g., Tzioumis et al. 2002). Although the radio source is small (, 0.3 kpc) its radio spectrum does not peak at 1 GHz. The optical identification corresponds to a mv=18.0 galaxy at z = 0.063 (Wall & Peacock 1985). We observe a bright, 16.38 magnitude point source. Danziger & Goss (1979) describe 1814–637 as a narrow line radio galaxy with a bright star-like nucleus. They report H and H absorption lines at zero redshift and suggest that there is a foreground star superposed on the galaxy. The UV object is 2 arcsec to the Northeast of the radio source (Ma et al. 1998). However, the registration between HST and radio frames can be off by as much as 1, so it is probably the counterpart.
1934–638: A long known GPS (Bolton et al. 1963). VLBI maps (e.g., Tzioumis et al. 1998) show two components separated by mas (0.12 kpc at z = 0.183, Tadhunter et al. 1993). -band observations (Jauncey et al. 1986) show a system of two galaxies, separated by , consistent with our observations. The GALFIT model yields two extended components with magnitudes 21.08 and 21.75 and a fainter point source with magnitude 23.81. 1934–638 shows significant polarization in the UV (3.5, e.g., Tadhunter et al. 1994; Morganti et al. 1997), with the position angle of the electric vector perpendicular to the radio axis. Scattered AGN light probably makes a significant contribution to the UV excess in this source (Tadhunter et al. 2002). Optical polarization observations also suggest an anomalous environment (Tadhunter et al. 1994; Morgatnti97).
1946+708: The counterpart is identified with a z = 0.10083, mR=16.3 galaxy (e.g., Snellen et al. 2003). VLBI observations of this GPS source show an elongated, 40 mas ( 0.07 kpc) NE-SW structure (Taylor & Vermeulen 1997). Optical observations (Perlman et al. 2001) also suggest a NE-SW elongated source. Our near-UV image suggests a marginal detection of a point source with magnitude 24.53, present in two of the three individual pre-drizzle images. Perlman et al. (2001) suggest that 1946+708 may be part of a group of galaxies and the closest would be far from 1946+708. These objects fall outside our field and they have unknown redshifts.
2352+495: Snellen et al. (2003) identify the counterpart of this GPS source (e.g., O’Dea 1998) with a z = 0.23790, mR = 18.2 galaxy. VLBI observations show a complex elongated ( 0.25 kpc) source oriented NW-SE (Pollack et al. 2003). Our ACS observations show three point sources in a circle about 0.5 wide, with magnitudes 24.79, 25.13 and 25.53 (slightly above the detection limit). The individual pre-drizzle show the two brightest sources while the third one is dubious.
5 UV and radio properties
Here we compare the UV and radio properties of our sample with those of the sample of 3CR FR I and FR II sources studied by Allen et al. (2002). The Allen et al. (2002) data consist of STIS near-UV-MAMA snapshots (exposure time of 1440 seconds) with filters F25SRF2 ) and F25CN182 ( ). The radio data have been collected from the papers listed in the individual notes above: O’Dea (1998), Morganti et al. (1993), Martel et al. (1999), Flesch & Hardcastle (2004) and the 3CRR on-line catalog (an update of the sample of Laing et al. 1983). The data are summarized in Table 3 and plotted in Figures 2 to 10.
| Name | Type | Size5GHz | UV Size | Log P5GHz | Log(LUV) | LUV | PA 5GHz | PA UV | PA |
|---|---|---|---|---|---|---|---|---|---|
| (kpc) | (kpc) | Log (Watts/Hz) | Log L⊙ | 1040 erg/s | (o) | (o) | (o) | ||
| 1233+418 | CSS | 11.6 | 1.2 | 25.56 | 6.710.11 | 2.00.1 | 27 | – | – |
| 1443+77 | CSS | 6.9 | 8.1 | 25.86 | 8.660.06 | 18017 | 140 | 116, 136, 20a | 4 |
| 1814–637 | CSS | 0.50 | – | 25.56 | 8.830.03 | 26520 | 156 | – | – |
| 1117+146 | GPS | 0.40 | 0.2 | 26.41 | 7.450.02 | 11.00.4 | 120 | – | – |
| 1345+125 | GPS | 0.17 | 0.45 | 25.98 | 7.830.01 | 26.10.7 | 120, 26 | 165 | 45 |
| 1607+268 | GPS | 0.30 | 0.2 | 26.86 | 8.050.04 | 442 | 29 | 88 | 59 |
| 1934–638 | GPS | 0.13 | 0.5 | 26.65 | 8.240.03 | 685 | 88 | 140 | 52 |
| 1946+708 | GPS | 0.07 | 0.2 | 25.14 | 6.260.04 | 0.700.05 | 28 | – | – |
| 2352+495 | GPS | 0.86 | 0.9 | 26.23 | 7.390.03 | 9.60.7 | 153 | 157, 27, 85b | 4 |
| 3C~29 | FR 1 | 133 | 24.99 | 7.630.12 | |||||
| 3C~35 | FR 2 | 960 | 24.75 | 7.420.45 | |||||
| 3C~40 | FR 2 | 20 | 24.12 | 7.560.13 | |||||
| 3C~66b | FR 1 | 300 | 24.45 | 7.780.25 | |||||
| 3C~192 | FR 2 | 228 | 25.29 | 8.160.17 | |||||
| 3C~198 | FR 2 | 512 | 24.79 | 8.800.08 | |||||
| 3C~227 | FR 2 | 379 | 24.59 | 9.270.08 | |||||
| 3C~236 | FR 2 | 4470 | 25.43 | 8.410.35 | |||||
| 3C~270 | FR 1 | 55 | 23.74 | 7.430.06 | |||||
| 3C~285 | FR 2 | 267 | 25.00 | 8.400.06 | |||||
| 3C~293 | FR 1 | 225 | 24.91 | 8.380.06 | |||||
| 3C~296 | FR 1 | 206 | 24.31 | 7.780.08 | |||||
| 3C~305 | FR 1 | 11 | 24.59 | 8.370.09 | |||||
| 3C~310 | FR 1 | 316 | 24.89 | 7.230.14 | |||||
| 3C~317 | FR 1 | 18 | 24.37 | 7.910.12 | |||||
| 3C~321 | FR 2 | 540 | 25.33 | 9.130.14 | |||||
| 3C~326 | FR 2 | 1990 | 24.83 | 7.330.18 | |||||
| 3C~338 | FR 1 | 68 | 23.96 | 7.560.04 | |||||
| 3C~353 | FR 2 | 94 | 24.57 | 6.671.55 | |||||
| 3C~382 | FR 2 | 204 | 25.19 | 10.350.22 | |||||
| 3C~388 | FR 2 | 84 | 25.48 | 7.520.27 | |||||
| 3C~390.3 | FR 2 | 246 | 25.47 | 9.440.22 | |||||
| 3C~405 | FR 2 | 138 | 27.15 | 8.921.14 | |||||
| 3C~449 | FR 1 | 514 | 23.93 | 7.980.51 | |||||
| 3C~465 | FR 1 | 349 | 24.71 | 7.940.22 |
UV luminosity for our GPS and CSS radio galaxies compared with large extended FR sources from Allen et al. (2002). Columns: (1) B1950 and 3C of the sources. (2) Classification. (3) Radio size. (4) UV size. (5) Radio power. (6) and (7) UV luminosity. (8) Position angle of the radio source. (9) Position angle of the UV source. (10) Difference in radio and UV position angles of the most aligned components. Longest linear sizes are in kpc. Radio and UV position angles in degrees (from North to East) of each component.The radio data are from O’Dea (1998), Morganti et al. (1993), Martel et al. (1999), Flesch & Hardcastle (2004) and the on-line 3CRR catalogue (Laing et al. 1983), measured at 5GHz.
a The PA of the largest angular UV scale is 130o.
b The UV morphology of 2352+495 is a roughly equilateral triangle so no general PA for the complete source can be given (see Figure1). The PA’s given are for the sides of the triangle formed
by the three point sources. The angles 157 and 85 are formed by the marginally detected component with the other two components.
We note that O’Dea & Baum (1997) found that the radio power of the bright GPS and CSS sample is independent of size and comparable to that of the most powerful FR II sources. However, the Allen et al. (2002) FR sources are low z 3CR, and therefore lower radio luminosity sources.
5.1 GPS sources
Most of the sources in our sample are very compact GPS sources, and therefore, are probably too small to strongly affect their environment on the scales resolved by these observations. However, some conclusions can be drawn from their integrated UV and radio properties.
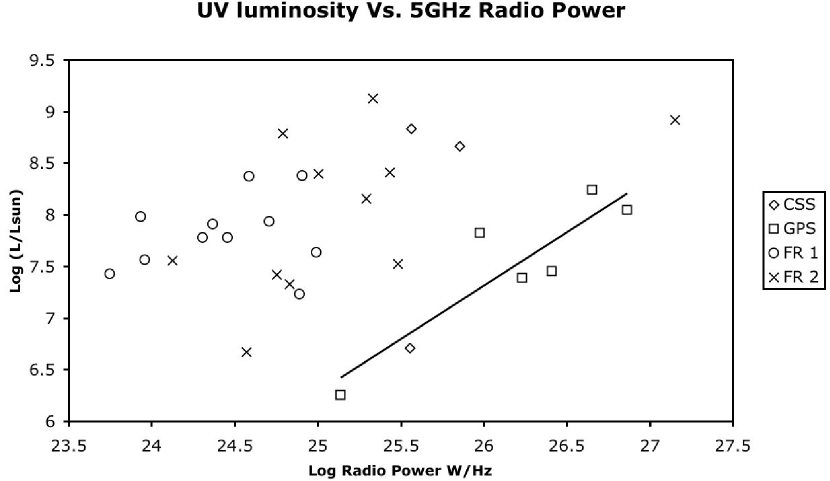
Figure 2 suggests a trend between UV luminosity and radio power of GPS sources (consistent with the results of Raimann et al. 2005, for larger radio galaxies). This relationship could be produced by a larger reservoir of gas available in the more luminous sources for fueling the radio source and supplying the starburst.
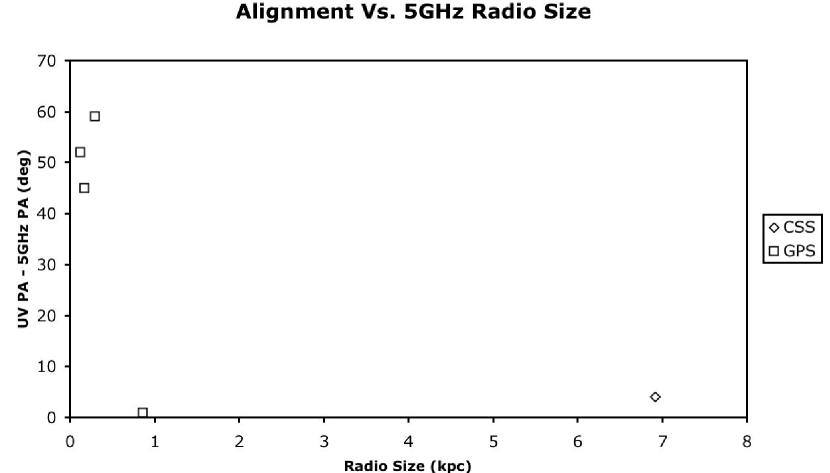
Inspection of Figure 3 shows that alignment between the UV and radio is found for sources kpc, i.e, the compact GPS sources tend not to show systematic alignment. If the UV light was scattered nuclear light, it would be expected to align with the radio axis regardless of radio source size (assuming the scattered light would escape along the radio axis). The lack of alignment in the GPS sources suggests that the UV light is not scattered nuclear light. Instead, in the GPS sources, we may be detecting some clumps of star formation on scales larger than the radio source which are associated with the fueling of the radio activity.
5.2 CSS sources
The fact that the GPS sources show UV emission on larger scales than the radio source and which are not aligned with the radio source is consistent with the hypothesis that the GPS sources are too small to strongly affect their environment on the scales resolved by these observations. In large scale 3CR sources, the jets extend far beyond the host galaxy. Therefore, if there is jet induced star formation, CSS sources are the best candidates to reveal it. We also note that the two most luminous UV sources in our sample (1443+77 and 1814–637) are CSS.
Labiano et al. (2005) demonstrated the presence of gas ionized by the shocks from the expanding radio source in CSS sources. Furthermore, they found that 1443+77 shows the strongest contribution from shocks. It is possible these shocks are affecting the star formation in the host.
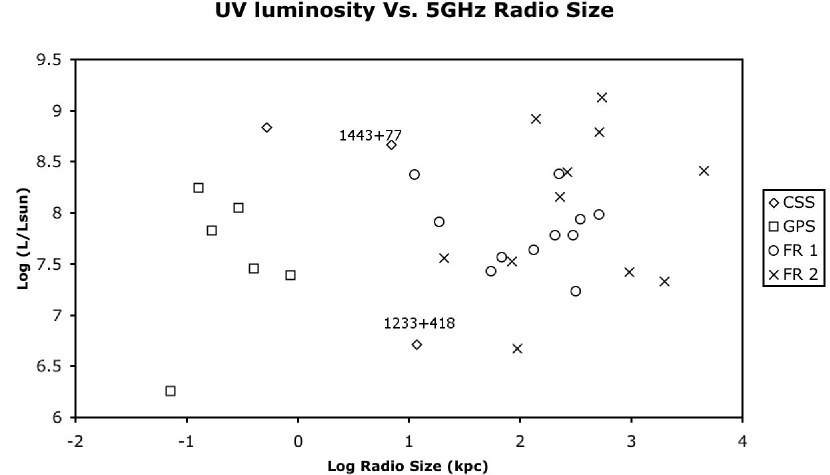
5.3 Is there jet-induced star formation?
Figure 4 suggests there is no correlation between UV luminosity and size of the radio source (i.e., the GPS, CSS and large 3CR sources have similar UV luminosities). Therefore, any UV emission which is related to source size does not seem to dominate the UV properties of the host. However, if the expansion of the radio lobes were enhancing the UV luminosity, it could have been unnoticed in our sample. The lack of a significant number of CSS sources in our sample (i.e. radio sizes comparable to the host) may cause us to be missing hosts with UV emission L⊙.
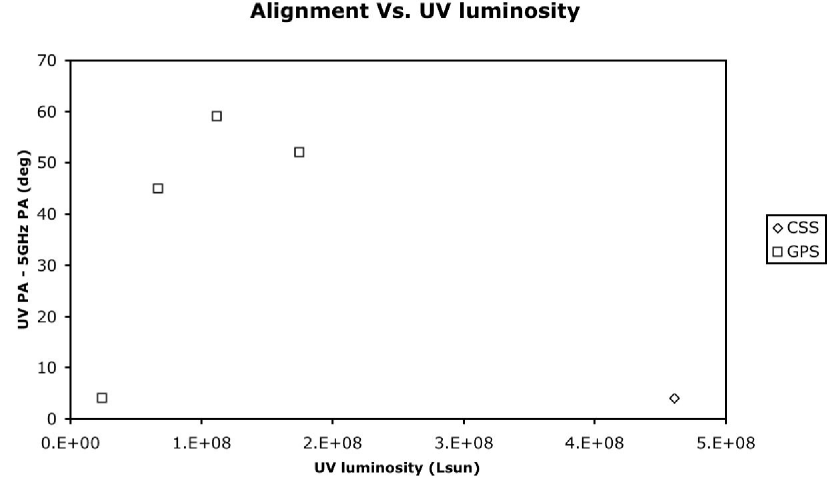
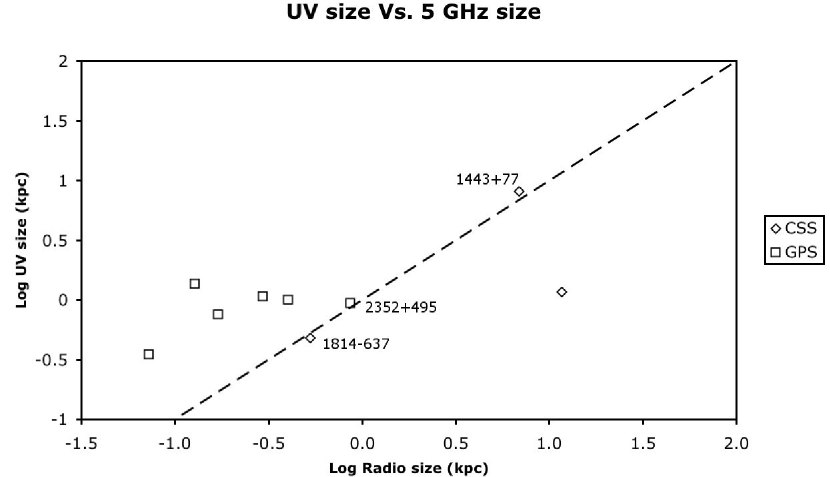
If the jet is enhancing the star formation, we expect the radio source and UV emission to be aligned and have similar sizes. The high UV luminosity source 1443+77 shows alignment between the UV and radio source (Figure 5). Observations of additional sources with sizes 1 kpc are needed to improve the statistics. Figure 6 shows that UV size and radio size are not correlated for most sources. However, two CSS and one GPS source (1443+77, 1814–637 and 2352+495) have similar UV and radio sizes. The radio source in 1233+418 is larger than the (marginal) UV emission. However, the UV magnitudes for 1233+418 are close to the detection limit so we may be missing extended and fainter UV emission in this object.
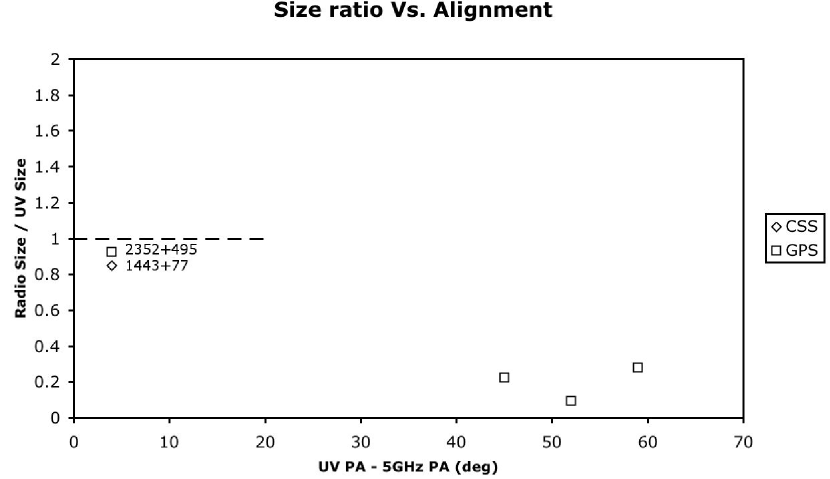
Table 3 shows the position angles of the radio and UV in the GPS and CSS sources. We see that the CSS 1443+77 and the GPS 2352+495 333For sources with several UV position angles, we use the most aligned component. One of the components aligned with the radio source in 2352+495 is a marginal detection. are aligned with the UV. In addition 1443+77 1814–637 and 2352+495 have a ratio of radio to UV size of order unity (Figure 7). The UV emission in 2352+495 has two components aligned with the radio source (and a third which is not aligned), but the unknown offset between radio and HST reference frames prevents us from accurately overlaying them. Therefore, 1443+77 is currently the best candidate for jet induced star formation.
This is consistent with the hypothesis that the UV emission is dominated by extended regions of star formation rather than by point-like AGN.
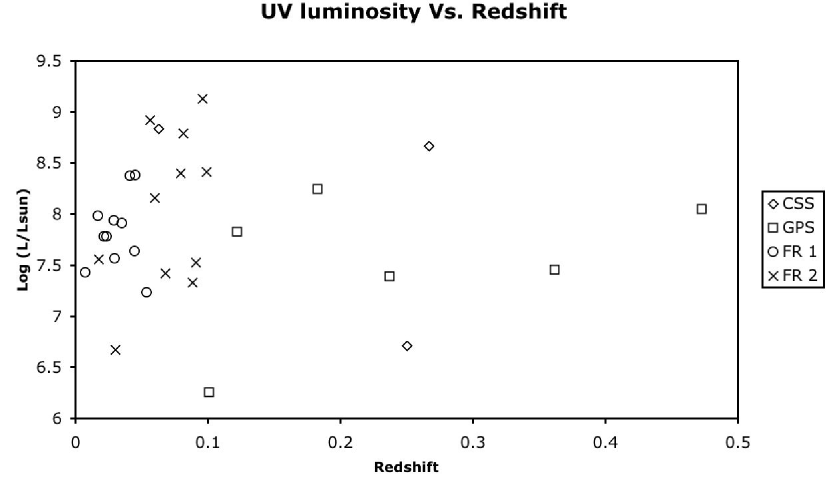
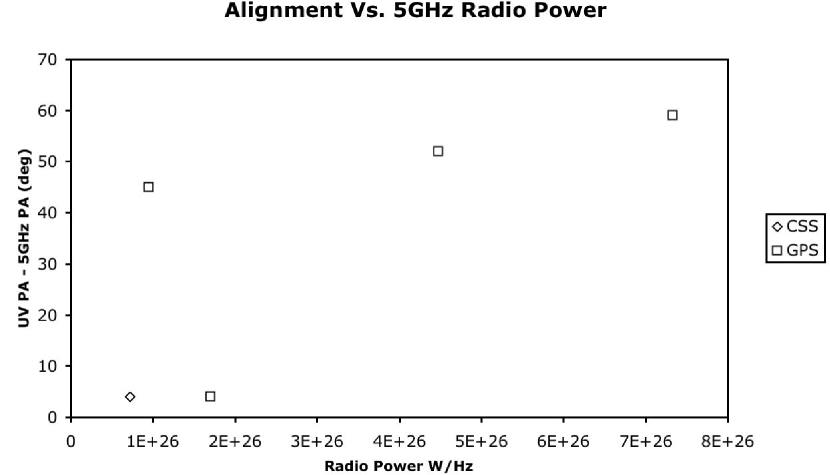
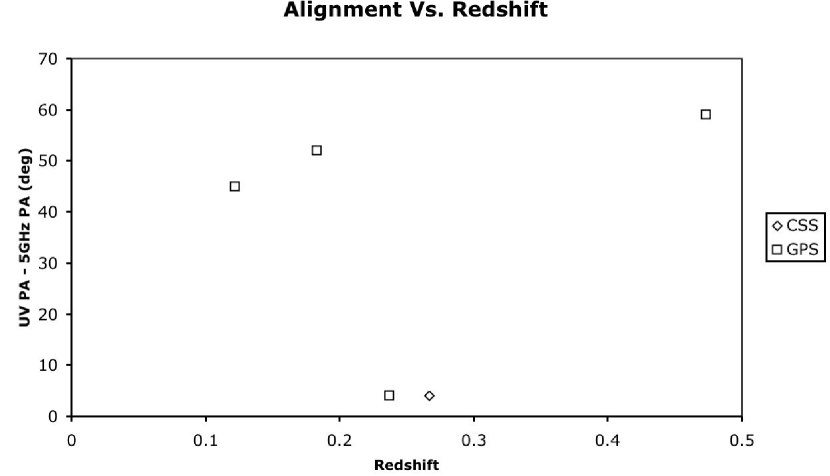
We also note several interesting null results. The detected UV luminosity in the GPS, CSS, and large 3CR sources is independent of redshift (out to z=0.5) (Figure 8). In the GPS and CSS sources, the alignment does not depend on either radio power (Figure 9) or redshift (Figure 10); though in both cases the statistics are dominated by the GPS sources which seem not to show alignment on the scales resolved by these observations.
| GALAXEV CB | GALAXEV IB | PEGASE | ||||
|---|---|---|---|---|---|---|
| Name | 10 Gyr | 1 Gyr | 10 Gyr | 1 Gyr | 10 Gyr | 1 Gyr |
| 1117+146 | 2.2 | 2.1 | 2.3 | 5.5 | 2.6 | 8.2 |
| 1233+418 | 5.2 | 1.0 | 5.6 | 1.8 | 1.1 | 3.9 |
| 1345+125 | 1.2 | 6.7 | 1.2 | 6.0 | 4.7 | 2.2 |
| 1443+77 | 2.0 | 3.3 | 2.2 | 6.2 | 3.7 | 1.3 |
| 1607+268 | 1.9 | 1.1 | 1.9 | 3.2 | 1.5 | 4.3 |
| 1814–63 | 1.1 | 4.6 | 1.1 | 2.0 | 7.1 | 2.0 |
| 1934–638 | 3.0 | 1.1 | 3.3 | 1.3 | 9.5 | 3.9 |
| 1946+708 | 1.4 | 9.6 | 1.5 | 7.8 | 6.2 | 3.1 |
| 2352+495 | 4.1 | 9.0 | 4.4 | 1.5 | 9.3 | 3.4 |
| 10 Myr | 1 Myr | 10 Myr | 1 Myr | 10 Myr | 1 Myr | |
| 1117+146 | 1.7 | 1.8 | 1.4 | 4.4 | 5.9 | 2.5 |
| 1233+418 | 1.0 | 1.0 | 8.3 | 2.5 | 3.7 | 1.8 |
| 1345+125 | 8.9 | 8.2 | 7.1 | 2.0 | 3.0 | 1.4 |
| 1443+77 | 3.2 | 3.1 | 2.5 | 7.8 | 1.1 | 5.4 |
| 1607+268 | 8.1 | 8.3 | 6.4 | 2.2 | 2.8 | 1.2 |
| 1814–63 | 3.2 | 3.5 | 2.6 | 9.5 | 1.3 | 6.1 |
| 1934–638 | 1.3 | 1.2 | 1.0 | 3.0 | 4.4 | 2.1 |
| 1946+708 | 1.3 | 1.2 | 1.1 | 3.0 | 4.4 | 2.1 |
| 2352+495 | 9.4 | 9.1 | 7.5 | 2.3 | 3.3 | 1.6 |
Mass in M⊙ needed to reproduce the observed F330W luminosity, according to the mass to luminosity ratio from each model. CB is the 1 Myr long continuous burst, IB is the instantaneous single burst model, PEGASE is the elliptical template model. The table is divided two halves corresponding to models of Gyr and Myr.
6 Stellar synthesis models
GPS and CSS sources are usually associated with massive ellipticals of ages Gyr and solar metallicities (e.g., de Vries et al. 2007, 2000, 1998a; Snellen et al. 1998, 1999). With this assumptions, we use stellar population synthesis models by Bruzual & Charlot (2003) using the Chabrier (Chabrier 2003) initial mass function and Padova evolutionary tracks, for a 1 Myr long continuous burst of star formation and a instantaneous single burst model for populations of 10, 10 and 1 Myr to compare our UV luminosity measurements and to estimate the mass and age of stars producing the UV emission in our sources. We also compare the measurements with the elliptical galaxy templates from PEGASE.
Table 4 shows the mass of stars for different ages needed to reproduce the observed near-UV emission of each source. Our observations are generally consistent with models of a single instantaneous burst of 10 M, 10 Myr ago. However, some sources may be dominated by intermediate-age (0.1 to 1 Gyr) populations (with masses M, e.g., Tadhunter et al. 2005). These young and intermediate ages in our GPS/CSS sources are also consistent with stellar population ages measured in hosts of powerful radio galaxies (Raimann et al. 2005) and other CSS sources (e.g., Johnston et al. 2005). The models which require old and massive stellar populations to produce the UV light are inconsistent with the small measured sizes for the UV emitting regions.
Our observations are consistent with a scenario in which a single event is responsible for triggering the AGN and initiating a starburst. However, the dynamical ages of GPS and CSS sources are much smaller (between 103 and 106 (e.g., Polatidis & Conway 2003; O’Dea 1998)) than the estimated ages of the stellar populations produced in the starburst. This implies a minimum time delay between the start of the starburst and the start of the radio activity of 10 Myr. The delay could be as long as 1 Gyr if the 1 Gyr stellar population models are correct. The apparent delay between starburst and formation of the radio source has been found in objects with possible connections between the starburst and the formation of the AGN and radio source (Raimann et al. 2005; Tadhunter et al. 2005) and is predicted by theoretical calculations of the time needed for the gas to reach the center of the galaxy after a tidal interaction (e.g., Lin et al. 1988).
7 Summary
We have obtained HST/ACS/HRC near-UV high resolution images of compact GPS and CSS radio galaxies which are likely to be the young progenitors of large scale powerful radio galaxies. We detect near-UV emission in point sources and/or small clumps (tens to hundreds of pc scale) in seven of the sources, consistent with the presence of recent star formation. Two sources show very weak near-UV emission and may have not been detected. The UV luminosity in the GPS and CSS sources is similar to that measured in nearby large 3CR radio galaxies by Allen et al. (2002). In the GPS sources as a whole we do not see systematic alignment between the radio and UV. This may be because the GPS radio sources are smaller than the scales resolved by these HST observations. The lack of alignment in the GPS sources implies that the UV emission is not due to scattered nuclear light.
There is evidence for a correlation between radio and UV luminosity in the GPS sources. This relationship could be produced by having a larger reservoir of gas available in the more luminous sources for fueling the radio source and supplying the starburst.
In the CSS source 1443+77 the near-UV emission is aligned with and co-spatial with the the radio emission and we suggest that star formation has been triggered or at least enhanced by expansion of the radio source through the host.
We suggest that the starburst and AGN are triggered by the same event. Comparison with stellar population synthesis models suggests the data are consistent with star formation occurring in a burst 10 Myr ago (though models as old as 1 Gyr are not ruled out). The radio source ages are much smaller (e.g., to yr) suggesting that there is a minimum delay of 10 Myr between the onset of the starburst and the onset of the radio activity (see also Raimann et al. 2005; Tadhunter et al. 2005). Observations at other wavelengths and measurement of the colors are needed to further asses the nature of the observed UV properties.
Acknowledgements.
We thank the anonymous referee for valuable suggestions and comments on the paper. AL wishes to thank Dr. Peng (STScI) for his help with GALFIT and Dr. I.A.G. Snellen (Leiden) for fruitful scientific discussions. WDVs work was performed under the auspices of the U.S. Department of Energy, National Nuclear Security Administration by the University of California, Lawrence Livermore National Laboratory under contract No. W-7405-Eng-48. These observations are associated with program 10117. Support for program 10117 was provided by NASA through a grant from the Space Telescope Science Institute. This research has made use of NASA’s Astrophysics Data System Bibliographic Services and of the NASA/IPAC Extragalactic Database (NED) which is operated by the Jet Propulsion Laboratory, California Institute of Technology, under contract with the National Aeronautics and Space Administration. This research is based on observations made with the NASA/ESA Hubble Space Telescope, obtained fro m the data archive at the Space Telescope Institute. STScI is operated by the association of Universities for Research in Astronomy, Inc. under the NASA contract NAS 5-26555.References
- Allen et al. (2002) Allen, M. G., Sparks, W. B., Koekemoer, A., et al. 2002, ApJS, 139, 411
- Aretxaga et al. (2001) Aretxaga, I., Terlevich, E., Terlevich, R. J., Cotter, G., & Díaz, Á. I. 2001, MNRAS, 325, 636
- Axon et al. (2000) Axon, D. J., Capetti, A., Fanti, R., et al. 2000, AJ, 120, 2284
- Batcheldor et al. (2006) Batcheldor, D., Tadhunter, C., Holt, J., et al. 2006, in preparation
- Baum et al. (1992) Baum, S. A., Heckman, T. M., & van Breugel, W. 1992, ApJ, 389, 208
- Beasley et al. (2002) Beasley, A. J., Gordon, D., Peck, A. B., et al. 2002, ApJS, 141, 13
- Becker et al. (1995) Becker, R. H., White, R. L., & Helfand, D. J. 1995, ApJ, 450, 559
- Bolton et al. (1963) Bolton, J. G., Gardner, F. F., & Mackey, F. B. 1963, Nature, 199, 682
- Bruzual & Charlot (2003) Bruzual, G. & Charlot, S. 2003, MNRAS, 344, 1000
- Cardelli et al. (1989) Cardelli, J. A., Clayton, G. C., & Mathis, J. S. 1989, ApJ, 345, 245
- Chabrier (2003) Chabrier, G. 2003, PASP, 115, 763
- Chiaberge et al. (2002) Chiaberge, M., Macchetto, F. D., Sparks, W. B., et al. 2002, ApJ, 571, 247
- Dallacasa et al. (1998) Dallacasa, D., Bondi, M., Alef, W., & Mantovani, F. 1998, A&AS, 129, 219
- Danziger & Goss (1979) Danziger, I. J. & Goss, W. M. 1979, MNRAS, 186, 93
- de Vries et al. (2007) de Vries, N., Snellen, I. A. G., Schilizzi, R. T., Lehnert, M. D., & Bremer, M. N. 2007, A&A, 464, 879
- de Vries et al. (1995) de Vries, W. H., Barthel, P. D., & Hes, R. 1995, A&AS, 114, 259
- de Vries et al. (2000) de Vries, W. H., O’Dea, C. P., Barthel, P. D., et al. 2000, AJ, 120, 2300
- de Vries et al. (1999) de Vries, W. H., O’Dea, C. P., Baum, S. A., & Barthel, P. D. 1999, ApJ, 526, 27
- de Vries et al. (1998a) de Vries, W. H., O’Dea, C. P., Baum, S. A., et al. 1998a, ApJ, 503, 156
- de Vries et al. (1997) de Vries, W. H., O’Dea, C. P., Baum, S. A., et al. 1997, ApJS, 110, 191
- de Vries et al. (1998b) de Vries, W. H., O’Dea, C. P., Perlman, E., et al. 1998b, ApJ, 503, 138
- Evans et al. (1999) Evans, A. S., Kim, D. C., Mazzarella, J. M., Scoville, N. Z., & Sanders, D. B. 1999, ApJ, 521, L107
- Fanti (2000) Fanti, C. 2000, in EVN Symposium 2000, Proceedings of the 5th european VLBI Network Symposium held at Chalmers University of Technology, Gothenburg, Sweden, June 29 - July 1, 2000, Eds.: J.E. Conway, A.G. Polatidis, R.S. Booth and Y.M. Pihlström, published by Onsala Space Observatory, p. 73
- Fanti et al. (2004) Fanti, C., Branchesi, M., Cotton, W. D., et al. 2004, A&A, 427, 465
- Fanti et al. (2001) Fanti, C., Pozzi, F., Dallacasa, D., et al. 2001, A&A, 369, 380
- Fanti et al. (1990) Fanti, R., Fanti, C., Schilizzi, R. T., et al. 1990, A&A, 231, 333
- Fey & Charlot (1997) Fey, A. L. & Charlot, P. 1997, ApJS, 111, 95
- Fey et al. (2004) Fey, A. L., Ma, C., Arias, E. F., et al. 2004, AJ, 127, 3587
- Fioc & Rocca-Volmerange (1997) Fioc, M. & Rocca-Volmerange, B. 1997, A&A, 326, 950
- Flesch & Hardcastle (2004) Flesch, E. & Hardcastle, M. J. 2004, A&A, 427, 387
- Gebhardt et al. (2000) Gebhardt, K., Bender, R., Bower, G., et al. 2000, ApJ, 539, L13
- Gilmore & Shaw (1986) Gilmore, G. & Shaw, M. A. 1986, Nature, 321, 750
- Graham & Driver (2005) Graham, A. W. & Driver, S. P. 2005, Publications of the Astronomical Society of Australia, 22, 118
- Heckman et al. (1986) Heckman, T. M., Smith, E. P., Baum, S. A., et al. 1986, ApJ, 311, 526
- Ho (2005) Ho, L. C. 2005, ArXiv Astrophysics e-prints, astro-ph/0511157
- Holt et al. (2003) Holt, J., Tadhunter, C. N., & Morganti, R. 2003, MNRAS, 342, 227
- Hurt et al. (1999) Hurt, T., Antonucci, R., Cohen, R., Kinney, A., & Krolik, J. 1999, ApJ, 514, 579
- Israel (1998) Israel, F. P. 1998, A&A Rev., 8, 237
- Jauncey et al. (1986) Jauncey, D. L., White, G. L., Batty, M. J., & Preston, R. A. 1986, AJ, 92, 1036
- Johnston et al. (2005) Johnston, H. M., Hunstead, R. W., Cotter, G., & Sadler, E. M. 2005, MNRAS, 356, 515
- Koekemoer et al. (2002) Koekemoer, A. M., Fruchter, A. S., Hook, R. N., & Hack, W. 2002, in The 2002 HST Calibration Workshop : Hubble after the Installation of the ACS and the NICMOS Cooling System, Proceedings of a Workshop held at the Space Telescope Science Institute, Baltimore, Maryland, October 17 and 18, 2002. Edited by Santiago Arribas, Anton Koekemoer, and Brad Whitmore. Baltimore, MD: Space Telescope Science Institute, 2002, p. 339
- Koekemoer et al. (1999) Koekemoer, A. M., O’Dea, C. P., Sarazin, C. L., et al. 1999, ApJ, 525, 621
- Kristian et al. (1978) Kristian, J., Sandage, A., & Katem, B. 1978, ApJ, 219, 803
- Labiano et al. (2005) Labiano, A., O’Dea, C. P., Gelderman, R., et al. 2005, A&A, 436, 493
- Laing et al. (1983) Laing, R. A., Riley, J. M., & Longair, M. S. 1983, MNRAS, 204, 151
- Lin et al. (1988) Lin, D. N. C., Pringle, J. E., & Rees, M. J. 1988, ApJ, 328, 103
- Lister et al. (2003) Lister, M. L., Kellermann, K. I., Vermeulen, R. C., et al. 2003, ApJ, 584, 135
- Ma et al. (1998) Ma, C., Arias, E. F., Eubanks, T. M., et al. 1998, AJ, 116, 516
- Martel et al. (1999) Martel, A. R., Baum, S. A., Sparks, W. B., et al. 1999, ApJS, 122, 81
- Martel et al. (2002) Martel, A. R., Sparks, W. B., Allen, M. G., Koekemoer, A. M., & Baum, S. A. 2002, AJ, 123, 1357
- McCarthy et al. (1995) McCarthy, P. J., Spinrad, H., & van Breugel, W. 1995, ApJS, 99, 27
- Mellema et al. (2002) Mellema, G., Kurk, J. D., & Röttgering, H. J. A. 2002, A&A, 395, L13
- Morganti et al. (1993) Morganti, R., Killeen, N. E. B., & Tadhunter, C. N. 1993, MNRAS, 263, 1023
- Morganti et al. (1997) Morganti, R., Tadhunter, C. N., Dickson, R., & Shaw, M. 1997, A&A, 326, 130
- O’Dea et al. (2006) O’Dea, C., Mu, B., Worrall, D., et al. 2006, astro-ph/0608320
- O’Dea (1998) O’Dea, C. P. 1998, PASP, 110, 493
- O’Dea & Baum (1997) O’Dea, C. P. & Baum, S. A. 1997, AJ, 113, 148
- O’Dea et al. (1991) O’Dea, C. P., Baum, S. A., & Stanghellini, C. 1991, ApJ, 380, 66
- O’Dea et al. (2003) O’Dea, C. P., de Vries, W. H., Koekemoer, A. M., et al. 2003, Publications of the Astronomical Society of Australia, 20, 88
- O’Dea et al. (2001) O’Dea, C. P., Koekemoer, A. M., Baum, S. A., et al. 2001, AJ, 121, 1915
- Peng et al. (2002) Peng, C. Y., Ho, L. C., Impey, C. D., & Rix, H.-W. 2002, AJ, 124, 266
- Perlman et al. (2001) Perlman, E. S., Stocke, J. T., Conway, J., & Reynolds, C. 2001, AJ, 122, 536
- Peterson (1997) Peterson, B. M., ed. 1997, An introduction to active galactic nuclei (Cambridge, New York: Cambridge University Press)
- Polatidis & Conway (2003) Polatidis, A. G. & Conway, J. E. 2003, Publications of the Astronomical Society of Australia, 20, 69
- Pollack et al. (2003) Pollack, L. K., Taylor, G. B., & Zavala, R. T. 2003, ApJ, 589, 733
- Raimann et al. (2005) Raimann, D., Storchi-Bergmann, T., Quintana, H., Hunstead, R., & Wisotzki, L. 2005, MNRAS, 1022
- Rees (1989) Rees, M. J. 1989, MNRAS, 239, 1P
- Rengelink et al. (1997) Rengelink, R. B., Tang, Y., de Bruyn, A. G., et al. 1997, A&AS, 124, 259
- Sanghera et al. (1995) Sanghera, H. S., Saikia, D. J., Ludke, E., et al. 1995, A&A, 295, 629
- Schlegel et al. (1998) Schlegel, D. J., Finkbeiner, D. P., & Davis, M. 1998, ApJ, 500, 525
- Scoville et al. (2000) Scoville, N. Z., Evans, A. S., Thompson, R., et al. 2000, AJ, 119, 991
- Sersic (1963) Sersic, J. L. 1963, Boletin de la Asociacion Argentina de Astronomia La Plata Argentina, 6, 41
- Sersic (1968) Sersic, J. L. 1968, Atlas de galaxias australes (Cordoba, Argentina: Observatorio Astronomico, 1968)
- Snellen et al. (2003) Snellen, I. A. G., Lehnert, M. D., Bremer, M. N., & Schilizzi, R. T. 2003, MNRAS, 342, 889
- Snellen et al. (1999) Snellen, I. A. G., Schilizzi, R. T., Bremer, M. N., et al. 1999, MNRAS, 307, 149
- Snellen et al. (1998) Snellen, I. A. G., Schilizzi, R. T., de Bruyn, A. G., et al. 1998, A&AS, 131, 435
- Spergel et al. (2003) Spergel, D. N., Verde, L., Peiris, H. V., et al. 2003, ApJS, 148, 175
- Stanghellini (1992) Stanghellini, C. 1992, PhD Thesis, University of Bologna
- Stanghellini et al. (1997) Stanghellini, C., O’Dea, C. P., Baum, S. A., et al. 1997, A&A, 325, 943
- Stanghellini et al. (1993) Stanghellini, C., O’Dea, C. P., Baum, S. A., & Laurikainen, E. 1993, ApJS, 88, 1
- Surace & Sanders (2000) Surace, J. A. & Sanders, D. B. 2000, AJ, 120, 604
- Surace et al. (1998) Surace, J. A., Sanders, D. B., Vacca, W. D., Veilleux, S., & Mazzarella, J. M. 1998, ApJ, 492, 116
- Tadhunter et al. (2002) Tadhunter, C., Dickson, R., Morganti, R., et al. 2002, MNRAS, 330, 977
- Tadhunter et al. (2005) Tadhunter, C., Robinson, T. G., González Delgado, R. M., Wills, K., & Morganti, R. 2005, MNRAS, 356, 480
- Tadhunter et al. (1993) Tadhunter, C. N., Morganti, R., di Serego-Alighieri, S., Fosbury, R. A. E., & Danziger, I. J. 1993, MNRAS, 263, 999
- Tadhunter et al. (1994) Tadhunter, C. N., Shaw, M. A., & Morganti, R. 1994, MNRAS, 271, 807
- Taylor & Vermeulen (1997) Taylor, G. B. & Vermeulen, R. C. 1997, ApJ, 485, L9+
- Tzioumis et al. (2002) Tzioumis, A., King, E., Morganti, R., et al. 2002, A&A, 392, 841
- Tzioumis et al. (1998) Tzioumis, A. K., King, E. A., Reynolds, J. E., et al. 1998, in ASP Conf. Ser. 144: IAU Colloq. 164: Radio Emission from Galactic and Extragalactic Compact Sources, 179
- Véron (1971) Véron, M. P. 1971, A&A, 11, 1
- Veilleux et al. (1997) Veilleux, S., Sanders, D. B., & Kim, D.-C. 1997, ApJ, 484, 92
- Wall & Peacock (1985) Wall, J. V. & Peacock, J. A. 1985, MNRAS, 216, 173
- Wills et al. (2004) Wills, K. A., Morganti, R., Tadhunter, C. N., Robinson, T. G., & Villar-Martin, M. 2004, MNRAS, 347, 771
- Wills et al. (2002) Wills, K. A., Tadhunter, C. N., Robinson, T. G., & Morganti, R. 2002, MNRAS, 333, 211
- Xiang et al. (2002) Xiang, L., Stanghellini, C., Dallacasa, D., & Haiyan, Z. 2002, A&A, 385, 768