MASIV:The Microarcsecond Scintillation-Induced Variability Survey
Abstract
We are undertaking a large-scale 5 GHz VLA survey of the northern sky to search for rapid intra-day variability (IDV). Over four observing epochs we found that 56% of the sources showed variability on timescales of hours to several days. Fewer variables were seen at high galactic latitudes, supporting interstellar-scintillation as the principal mechanism responsible for IDV. We find evidence that many of the scattering screens are not moving with the local standard of rest. There are few scintillating sources seen at high redshift which may be an indication of scattering in the turbulent intergalactic medium.
Australia Telescope National Facility, PO Box 76, Epping NSW, Australia
School of Mathematics & Physics, University of Tasmania, GPO Box 252 Hobart
Cavendish Laboratory, Cambridge CB3 OHE, United Kingdom
Joint Institute for VLBI in Europe, Postbus 2, 7990 AA Dwingeloo, The Netherlands
Nordic Optical telescope, Sta Cruz de La Palma, E-38700 Tenerife, Spain
US Naval Observatory, 3450 Massachusetts Avenue NW, Washington DC 20392
NRAO Jansky Fellow, Department of Astronomy, California Institute of Technology, Pasadena CA 91125
Department of Electrical and Computer Engineering, University of California, San Diego, La Jolla, CA 92093
US Naval Observatory, 3450 Massachusetts Avenue NW, Washington DC 20392
9 School of Physics, University of Sydney, NSW 2006, Australia
1. Introduction
Considerable evidence has now accumulated to demonstrate that inter-stellar scintillation (ISS) in the turbulent, ionized inter-stellar medium (ISM) of our Galaxy is the principal mechanism responsible for the intra-day variability (IDV) seen in many flat-spectrum AGN (e.g. Bignall et al. 2006, and references therein). A source must be small to scintillate; in the weak scattering case most frequently observed at frequencies near 5 GHz, the source angular size must be comparable to or smaller than the angular size of the first Fresnel zone, which implies microarcsecond angular sizes for screen distances of tens to hundreds of parsecs. The long time-scale over which scintillations have been observed in some sources suggests that such scintillating components are relatively long-lived despite their small physical sizes. Interstellar scintillation probes AGN angular sizes and brightness temperatures at cm-wavelengths that are unachievable with VLBI.
2. The MASIV Survey
We are undertaking a large-scale 5 GHz VLA survey of a core sample of 525 compact, flat-spectrum AGN over the northern sky (declination 0 degrees) to search for IDV (Lovell et al. 2003). Our objective is to assemble a statistically significant sample of sources exhibiting IDV in order to address a number of important astrophysical questions.
The sources were chosen from the JVAS (Patnaik et al. 1992; Browne et al. 1998; Wilkinson et al. 1998) and CLASS (Myers et al. 1995) catalogues. Spectral indices were determined from the JVAS and CLASS 8.5 GHz flux densities and the 1.4 GHz NVSS catalogue (Condon et al. 1998), and a flat-spectrum sample selected to have spectral indices greater than -0.3. We chose separate weak and strong source samples of approximately 250 sources each. The weak sample consists of sources with 8.5 GHz catalogued flux densities between 105 and 130 mJy, while the strong sample contains sources stronger than 600 mJy. Sources were selected to cover the northern sky with individual source measurements being made every 2 hours, with 60 seconds on-source per scan. This gave 6 scans per source per day, or approximately 10,000 scans per epoch. Primary flux density calibration was based on observations with each sub-array of B1328+307 (3C286) and J2355+4950; the latter is a compact gigahertz-peaked-spectrum source which is monitored at the VLA as part of their regular calibrator-monitoring program.
The VLA was sub-divided into 5 sub-arrays of 5 or 6 antennas each, so as to minimize slew times and hence maximize observing times. The source list was subdivided into four declination bands and one sub-array assigned to each. The fifth sub-array was used for more intensive monitoring of selected sources known to show IDV. The observations were undertaken during VLA reconfiguration times.
The observations took place over four 72 hour periods during January, May and September 2002 (96h) and January 2003. This was done to ensure that our survey sampled each source over the course of the year so that sources that were in the “slow” part of their annual cycle would not be missed. As a follow-up, we undertook a fifth three-day epoch of MASIV observations in January 2006.
3. Objectives
Our principal objective was to produce a sample of at least 100 to 150 scintillators. Previous IDV surveys of the stronger flat-spectrum sources had found roughly 15% exhibited IDV; we started with a core sample of 525 sources, the maximum number that we could observe once every two hours sampled with the four sub-arrays. With such a large sample size and number of scintillators, we can expect to explore possible dependencies of the presence or absence of microarcsecond angular structure in AGN on a variety of parameters.
A further objective was to survey a weaker sample to compare the incidence of IDV in both the weak and strong sources. The inverse Compton limit suggests that ISS may be more common amongst the weaker sources since for a given angular size the brightness temperature decreases with decreasing flux density.
We also hoped to find more of the very rapid scintillators like PKS 0405–385 (Kedziora-Chudczer et al. 1997), J1819+3845 (Dennett-Thorpe & de Bruyn 2000) and PKS 1257–326 (Bignall et al. 2003). As two of these three remarkable sources were discovered serendipitously we hoped to find more such sources and to ascertain how common they were and if they were more likely amongst the weaker or stronger sources. Moreover, as such rapid scintillation is due to scattering by nearby turbulent, ionized clouds, the presence of new fast scintillators would signify the presence of nearby clouds.
Only with a large sample of scintillators is it feasible to explore the dependence of scintillators on parameters such as sky distribution and hence to explore the structure of the turbulent ISM. Again a large sample size allows us to search for any redshift dependence which might signify the presence of turbulent, ionized material in the intergalactic medium (IGM).
Microarcsecond angular resolution at cm wavelengths is not achievable with Earth-based VLBI as it requires space baselines. Such long baselines were not part of the VSOP Space VLBI mission (Hirabayashi et al. 1998) and so interstellar scintillation remains the only way to achieve such high angular resolution and to explore AGN structure and evolution at the highest brightness temperatures at cm-wavelengths.
4. Classification of Variables
The uncertainties in the individual measurements are made up of two components, a fractional error, p%, due to pointing uncertainties, and a noise error, s Jy, due to thermal noise and confusion. For the present measurements we found that p = 1% and s = 1.5 mJy.
As a first step towards finding the variables, sources were classified as variable if their modulation index, defined as the rms of the three days’ observations divided by the mean flux density, exceeded twice that calculated from the above errors. On direct inspection of the data, however, it soon became apparent that many of the slower variables, that is sources with variability time-scales longer than three days were not being noted as variable with the simple two-sigma cut described above. We then tried a similar two-sigma selection but this time based on the daily averages rather than the individual measurements. This process yielded more variable detections, but again inspection revealed that there remained many sources exhibiting variability that were not being detected on either test.
The difficulty is that Chi-squared is not an ordered statistic, so low-level, monotonic variability that is easily detected on inspection was not being detected with these tests. We were left with no alternative but to undertake “by eye” inspection and classification. This was done independently by two of us. We adopted the conservative null hypothesis that “each source was considered non-variable unless otherwise demonstrated”. The number of “disagreements” was small. Any source where there was disagreement on its classification was reviewed and if we could not agree on the classification, was classified non-variable. In practice most of those sources where we disagreed were finally classified as non-variable.
Figure 1 shows some examples of the variability that we have uncovered in the MASIV survey. J1819+3845 (Dennett-Thorpe & de Bruyn 2000) was found to be by far the most dynamic variable with a modulation index of 17%, even though our 2-hourly sampling was at times less than the variability time-scale. Variability was very clearly detected on each of the four epochs. J0949+5819 demonstrates the sensitivity of our VLA measurements even in our five-sub-array mode.


After removing 43 sources that showed structure or confusion, we were left with a final sample of 482 sources. Figure 2 shows the non-variable sources together with the numbers that were classified as variable on one, two, three or all four epochs. 56 sources, 12%, were seen to vary on each of the four observing epochs.
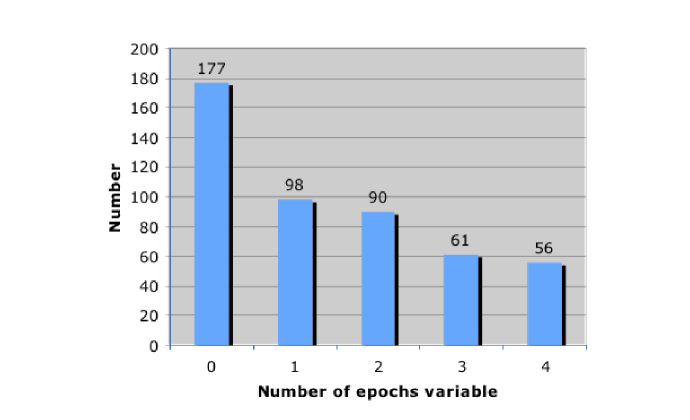
With any analysis of such a large number of observations, however, false positives, i.e. sources that are incorrectly classified as variable, are a significant concern. We believe that our classification of the light curves as variable or not is reliable with 95% confidence. The question then is how many false positives, non-variables miss-classified, are there and how are they distributed? Table 1 shows what the classifications would be if all 482 sources were non-variable.
| Combination | Probability | Number of | Fraction if none | Measured |
|---|---|---|---|---|
| occurrences | are variable | Numbers | ||
| 4 n | 1 | 81.5% | 177 | |
| 3 n, 1 y | 4 | 17.2% | 98 | |
| 2 n, 2 y | 6 | 1.3% | 90 | |
| 1 n, 3 y | 4 | 0.04% | 61 | |
| 4 y | 1 | 0.0006% | 56 |
The large number of sources classified as varying on multiple epochs firmly establishes that our classification process is both accurate and reliable. If all 482 sources were non-variable, then the expected numbers exhibiting “variability” on 2, 3 or 4 epochs is a mere 6.7 or 1.4%, compared with the observed 207 or 43%. Moreover, the ratio of false positives to non-variables is 17.4%. Even if our classification was 90% reliable, then the number of false positives with 2 or more detections remains less than 5%.
This allows us to make a clear separation. We define as “non-variable” those 177 sources that showed no variability in any of the four epochs, and we define as “variable” those 207 sources that showed variability on two or more of the four epochs. With these definitions we have two large and reliable samples each of approximately 200 sources, where the non-variables act as a control sample for the variables. Each was drawn from the same selection criteria and cover the same overall area of sky.
In the face of these false positives, an important question remains to be answered, namely “What fraction of the sources can be reliably classified as variable?” If N is the number of non-variables and T is the number of one-time variables and F is the number of non-variables classified as one-time variables, then T + F = 98 and N + T = 177 + 98 = 275, and F/N is, from Table 1, equal to 17.4%. So that N = 214, F = 37 and T = 61, yielding the corrected total number of variables of 268. Therefore the fraction of variables to non-variables is 56%, a value which is significantly higher than found in any previous IDV survey!
5. Comparison of Variables and Non-Variables
We have compared the fraction of strong and weak sources in our final sample of 482 sources. There are close to equal fractions of non-variables, one-time variables and 2+3+4 times variables in the strong (37%, 21% and 42%) and weak (37%, 19% and 44%) parts of our final sample. However, the two distributions differ in that the weak sources contain a significantly higher fraction of 3-times and 4-times variables than the strong sample sources. Lovell et al. (2003) found that the number of highly variable sources, those with rms flux density variations greater than 4% of the mean flux density, increases with decreasing source flux density. Our finding an excess of the 3-times and 4-times variables accounts well for this.
Those sources that were classified as varying on only one of the four epochs form an interesting class of episodic variables. Correcting for false positives leaves us with 61 sources, almost 13% of the total. Thus the microarcsecond components of AGN have life-times lasting from less than four months, the time between our observational epochs, to decades, the times over which some well-observed sources have continued to show ISS, B0917+624 (Rickett et al. 2001; Jauncey & Macquart 2001), PKS 1519–273 (Jauncey et al. 2003), J1819+3845 (Dennett-Thorpe & de Bruyn 2003) and PKS 1257–326 (Bignall et al. 2006). It is only because of our sampling over a full year that we find this unusual category of short-lived, episodic scintillators.
A further surprise (at least to us) was the apparent absence of those very rapid variables. J1819+3845 fell in our sample, but it was the only source to show such variability. J0929+5013 showed rapid variability in the January 2002 epoch (Lovell et al. 2003) but, although monitored closely, revealed only slower, many-hour variability in the three later epochs. We had expected to find more of these rapid variables especially given that two of the three known, J1819+3845 and PKS1257-326 were discovered serendipitously.
One possibility is that such variability is predominantly episodic, as is the case with PKS 0405–385 (Kedziora-Chudczer et al. 2001). However, PKS 1257–326 and J1819+3845 are both long-lived over time-scales of up to a decade and both were still scintillating when last observed. For PKS1257-326 the life-time is at least a decade (Bignall et al. 2006) and at least half a decade for J1819+3845 (Dennett-Thorpe & de Bruyn 2003, and de Bruyn private communication). For each of the three known fast variables, it is the presence of the nearby scattering screen that is responsible for the rapid variability. Thus it would seem that such nearby screens cover very little of the sky.
6. Variability Time-scales
During the “by eye” examination we noted the presence of any inflection points (i.e. change in sign of the derivative) at each epoch in order to derive an indication of the variability time-scale of each source. The majority of sources were found to show none or at most one inflection point indicating variability timescales that are predominantly longer than 3 days. The observed distribution of inflection points is shown in Figure 3. Only a small number of sources showed 2 or more inflection points. Overall, the distribution of timescales was statistically the same for each epoch, remembering that epoch 3 was four days rather than the three days of the other epochs.
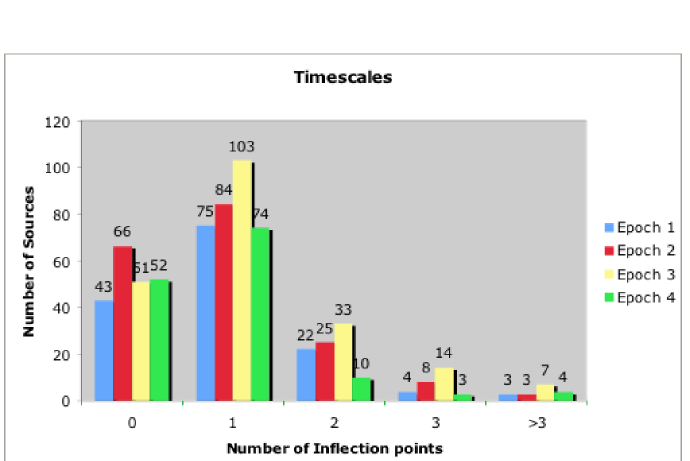
A comparison of the distribution of inflection points for the weak and strong sources revealed no significant difference between the two classes. However % of all variables showed none or at most one inflection point, indicating that we have only underestimates of both the timescales and modulation indices for these sources.
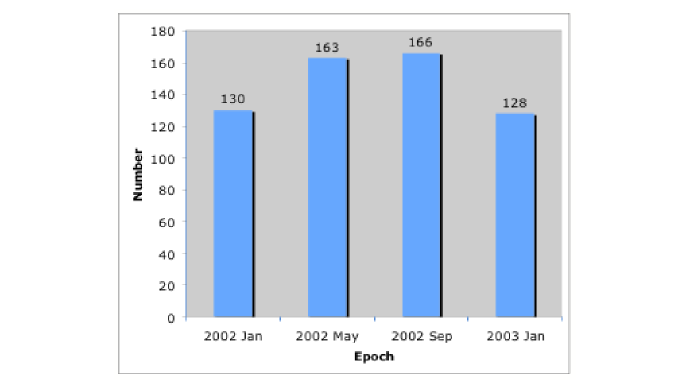
The annual cycle seen in a number of sources is due to the changing relative velocities of the Earth and the ISM responsible for the scattering (Macquart & Jauncey 2003). If the ISM velocities follow the Local Standard of Rest, many sources would be expected to show a slowing down in the third quarter of the year, and hence may more easily be missed because of the lengthened time-scales. If the scattering material responsible for the scintillation follows the local standard of rest (LSR), then we would expect many more sources to exhibit their slow-down during the September session. Figure 4 shows the numbers of variables found at each of the four epochs. A contingency test shows no evidence that the numbers differ from the mean in any epoch, even though epoch 3 lasted for four rather than three days. The uniformity of variable numbers in each epoch suggests a lack of evidence for a September slow-down, and it follows that the majority of the scattering material is not moving at the LSR. This is perhaps not unexpected; both PKS 1257–326 and J1819+3845, the two sources for which reliable screen velocities have been measured, have measured screen velocities that differ significantly from the LSR (Bignall et al. 2006; Dennett-Thorpe & de Bruyn 2003).
7. Galactic Latitude Dependence
A significant Galactic latitude dependence is to be expected in the numbers of variable sources as inter-stellar scintillation is the principal cause of this rapid intra-day variability. We have asked the simple question “are the latitude distributions of variables and non-variables the same?” A contingency test dividing them into two samples, a low latitude sample, 40 degrees, and high latitude sample, 40 degrees, shows that, at the 98% confidence level, the two distributions differ significantly. There are fractionally more variables at low latitudes than there are at high latitudes, so providing unambiguous support for the origin of the intra-day variability being inter-stellar scintillation. This is in excellent agreement with the modulation index dependence found by Rickett, Lazio & Ghigo (2006) in their analysis of the 146 flat-spectrum sources observed with the Green Bank Interferometer.
8. Spectral Index Dependence
The MASIV sources were selected to have spectral indices greater than -0.3 (Lovell et al. 2003). We have search for a spectral index dependence by dividing the sources into two approximately equal groups at a spectral index of 0.1 and testing if these fraction of scintillators in these two groups are the same or not. The contingency test tells us immediately that the probability is less than 1% that these two groups were drawn from the same population.
The spectral index distribution for sources surveyed at 5 GHz is bi-modal with peaks near 0 and –0.7. These two peaks result from two distinct source populations; the steep spectrum sources are predominantly nearby galaxies, while the flat-spectrum sources are predominantly distant quasars (e.g. Condon & Jauncey 1974). However, the spectral index distribution of galaxies contains a significant number with spectral indices flatter than –0.3, and it is these that are likely responsible for the spectral index dependence noted here.
9. Redshift Dependence
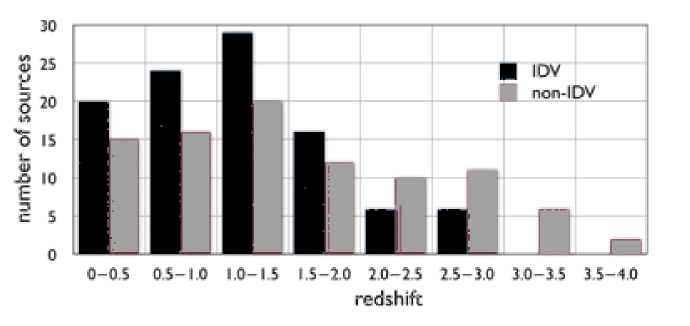
We have extracted redshifts for 154 of the MASIV variables and non-variables from the literature. In addition, we have measured redshifts for a further 39 sources in a pilot program with the 2.5 m Nordic Optical Telescope (Pursimo et al., in preparation) and the overall redshift distribution is given in Figure 5. A contingency test on the data in Figure 5 reveals that the redshift distributions of the scintillators and non-scintillators are clearly different at the 97% confidence level, in the sense that there is a deficit of scintillators amongst the high redshift sources.
We can test this distinction further by dividing the sources into two separate groups, a “near universe”, namely those with , and a “far universe”, those with . Such a division is appropriate on astrophysical and especially on observational grounds; those sources with redshifts of 2 or more show the presence and pattern of the usual strong quasar emission lines Lyman Alpha, Si IV, CIV and CIII], as well as the presence of the Lyman Alpha absorption forest, which is easily recognizable in establishing a redshift of 2 or more. Such a division at is thus extremely robust as the spectra of quasars are easily and unambiguously recognizable, and avoids the difficulties of an accurate redshift for quasars with only one observed emission line, since they are clearly at regardless of the line identification. BL Lacs are also easily included as the absence of any Lyman Alpha forest absorption classifies them as as well.
With only two redshift categories, this maximizes the numbers and provides a powerful statistical test which yields a formal probability of less than 0.1% that the low and high universe groups are drawn from the same population. There is a highly significant deficit of scintillators in the far universe.
We interpret the deficit of high redshift scintillators as due to intergalactic scattering where interstellar scintillation acts as a filter to distinguish sources containing apparent microarcsecond components from those that do not. The absence of IDV in sources above indicates they are too large to scintillate. This implies that sources at are either a) intrinsically too large to scintillate or b) are being scatter-broadened by turbulence in the ionized intergalactic medium at redshifts in excess of 2.
It seems unlikely that radio sources are intrinsically larger at high redshift. However, we are concerned regarding the possibility that selection effects present in the redshifts from the literature, which constitute three quarters of the measured redshifts, may masquerade as a redshift dependence. For example, more redshifts exist in the literature for the stronger sources, so differences between the stronger and weaker sources may show up as a redshift dependence. It is for this reason that it is essential that we complete the redshift measurements for all of the MASIV sources. Moreover, the importance of a detection of the ionized, turbulent IGM argues that this be achieved expeditiously.
10. Conclusions
-
•
56% of sources varied on one or more of the four observing epochs
-
•
We found a significant Galactic latitude dependence with fewer variables at high Galactic latitudes. This strongly supports interstellar scintillation as the mechanism responsible for the observed variability.
-
•
Rapid, high modulation, inter-hour variable sources are rare
-
•
Number of variables in each epoch doesn’t follow what is expected for LSR screens
-
•
We found a significant spectral index dependence, with fewer scintillators with smaller spectral indices.
-
•
Variability timescales are slow 1 day or more
-
–
10 “fast” sources (3 or more inflections)
-
–
-
•
We found few scintillators at redshifts of 2 and above. We argue that this is caused by scattering in the turbulent intergalactic medium.
Acknowledgments.
We are most grateful for the technical support provided by the NRAO staff in Socorro. The National Radio Astronomy Observatory is a facility of the National Science Foundation operated under a cooperative agreement by Associated Universities Inc. The Australia telescope national facility is funded by the Commonwealth of Australia for operation as a National facility managed by CSIRO.
References
- Bignall et al. (2003) Bignall, H. E., Jauncey, D. L., Lovell, J. E. J., Tzioumis, A. K., Kedziora-Chudczer, L., Macquart, J.-P., Tingay, S. J., Rayner, D. P. & Clay, R. W. 2003, ApJ., 585, 653.
- Bignall et al. (2006) Bignall, H.E., Macquart, J-P., Jauncey, D.L., Lovell, J.E.J., Tzioumis, A.K. & Kedziora-Chudczer, L. 2006, ApJ., 652, 1050
- Browne et al. (1998) Browne, I.W.A., Wilkinson, P. N., Patnaik, A. R. & Wrobel, J. M. 1998, MNRAS, 293, 257
- Condon et al. (1998) Condon, J.J., Cotton, W. D., Greisen, E. W., Yin, Q. F., Perley, R. A., Taylor, G. B. & Broderick, J. J. 1998, AJ, 115, 1693
- Condon & Jauncey (1974) Condon, J.J. & Jauncey, D.L. 1974, AJ., 79, 1220
- Dennett-Thorpe & de Bruyn (2000) Dennett-Thorpe, J. & de Bruyn, A. G. 2000, ApJ., 529, 65
- Dennett-Thorpe & de Bruyn (2003) Dennett-Thorpe, J. & de Bruyn, A.G. 2003, A&A, 404, 113
- Hirabayashi et al. (1998) Hirabayashi, H., et al. 1998, Science, 281, 1825
- Jauncey & Macquart (2001) Jauncey, D.L., & Macquart, J-P. 2001, A&A, 370, L9
- Jauncey et al. (2003) Jauncey, D. L., Johnston, H. M., Bignall, H. E., Lovell, J. E. J., Kedziora-Chudczer, L., Tzioumis, A. K., Macquart, J-P 2003, Ap&SS, 288, 63
- Kedziora-Chudczer et al. (1997) Kedziora-Chudczer, L., Jauncey, D. L., Wieringa, M. H., Walker, M. A., Nicolson, G. D., Reynolds, J. E., Tzioumis, A. K. 1997, ApJ., 490, L9
- Kedziora-Chudczer et al. (2001) Kedziora-Chudczer, L., Jauncey, D. L., Lovell, J. E. J., Walker, M. A., Macquart, J.-P., Wieringa, M. H., Tzioumis, A. K., Perley, R. A., Reynolds, J. E. 2001 in “Particles and Fields in Radio Galaxies”, ASP Conference Proceedings Vol. 250, Eds. Robert A. Laing & Katherine M. Blundell, Astronomical Society of the Pacific, 128
- Lovell et al. (2003) Lovell, J. E. J., Jauncey, D. L., Bignall, H. E., Kedziora-Chudczer, L., Macquart, J.-P., Rickett, B. J., Tzioumis, A. K. 2003, AJ., 126, 1699
- Macquart & Jauncey (2003) Macquart, J-P, & Jauncey, D. L. 2002, ApJ, 572, 786
- Myers et al. (1995) Myers, S.T., et al 1995, ApJ, 447, L5
- Rickett et al. (2001) Rickett, B.J., Witzel, A., Kraus, A., Krichbaum, T. P., Qian, S. J. 2001, ApJ, 550, L11
- Rickett, Lazio & Ghigo (2006) Rickett, B.J., Lazio, T.J.W., & Ghigo, F.D. 2006 ApJ Suppl., 165, 439
- Patnaik et al. (1992) Patnaik, A. R., Browne, I. W. A., Wilkinson, P. N., & Wrobel, J. M. 1992, MNRAS, 254, 655
- Wilkinson et al. (1998) Wilkinson, P. N., Browne, I. W. A., Patnaik, A. R., Wrobel, J. M., Sorathia, B. 1998, MNRAS, 300, 790