11email: schinner@mpia.de 22institutetext: European Space Agency, Dept. RSSD, Keplerlaan 1, 2200 AG Noordwijk, Netherlands
22email: tboeker@rssd.esa.int 33institutetext: CRAL-Observatoire, 9 avenue Charles André, 69231 Saint Genis Laval, France
33email: emsellem@obs.univ-lyon1.fr 44institutetext: Institut de RadioAstronomie Millimétrique, 300 rue de la Piscine, Domaine Universitaire, 38406 Saint Martin d’Hères, France 44email: downes@iram.fr
Bar-Driven Mass Build-Up within the Central 50 pc of NGC 6946 ††thanks: Based on observations carried out with the IRAM Plateau de Bure Interferometer. IRAM is supported by INSU/CNRS (France), MPG (Germany) and IGN (Spain).
We have used the new extended A configuration of the IRAM Plateau de Bure interferometer to study the dense molecular gas in the nucleus of the nearby spiral galaxy NGC 6946 at unprecedented spatial resolution in the HCN(1-0) and 12CO(2-1) lines. The gas distribution in the central 50 pc has been resolved and is consistent with a gas ring or spiral driven by the inner 400 pc long stellar bar. For the first time, it is possible to directly compare the location of (dense) giant molecular clouds with that of (optically) visible HII regions in space-based images. We use the 3 mm continuum and the HCN emission to estimate in the central 50 pc the star formation rates in young clusters that are still embedded in their parent clouds and hence are missed in optical and near-IR surveys of star formation. The amount of embedded star formation is about 1.6 times as high as that measured from HII regions alone, and appears roughly evenly split between ongoing dust-obscured star formation and very young giant molecular cloud cores that are just beginning to form stars. The build-up of central mass seems to have continued over the past 10 Myrs, to have occurred in an extended (albeit small) volume around the nucleus, and to be closely related to the presence of an inner bar.
Key Words.:
galaxies: nuclei — galaxies: ISM — galaxies: kinematics and dynamics — galaxies: individual(NGC 6946)1 Introduction
The nearby (D=5.5, =27) Scd spiral galaxy NGC 6946 is an ideal laboratory to study the causes (and consequences) of intense star formation in the vicinity of a galaxy nucleus, although its low galactic latitude hampers studies at optical and shorter wavelengths. Within its central , NGC 6946 is currently undergoing an intense burst of star formation, as indicated by strong far-infrared emission (Devereux & Young 1993) and the presence of numerous hydrogen recombination lines in its nuclear spectrum (Engelbracht et al. 1996). The proximity of NGC 6946, combined with recent technological advances in mm-interferometers which now routinely reach sub-arcsec resolution, enables a detailed study of the interplay between infalling dense molecular gas, active star formation, and the energetic feedback from young massive stars on scales of individual giant molecular clouds (GMCs). We have recently undertaken such a study which has shown that NGC 6946 appears to be a “textbook case” for molecular gas responding to the gravitational potential of a small-scale stellar bar (Schinnerer et al. 2006, hereafter paper I). The gas flows inward along an S-shaped spiral structure and accumulates in a massive nuclear clump with a size of about (). This clump contains about of molecular gas, and appears to completely obscure the very center of NGC 6946.
In this letter, we describe results from recent mm-observations obtained with the new, expanded baselines of the IRAM Plateau de Bure interferometer (PdBI) which yield a spatial resolution of about , and thus allow a direct comparison with the best available (space-based) optical and/or near-infrared maps. The new PdBI observations were designed to address a number of open issues related to the connection between active star formation and the gas properties. Of particular interest is the question how the sites of active star formation compare to the molecular gas flow, and whether optical or even near-infrared recombination lines yield a complete picture of the current star formation rate in the nucleus of NGC 6946. We briefly describe the observations and data reduction procedures in § 2, and present the resulting maps of the 12CO(2-1) and HCN emission in § 3. In § 4, we analyze the gas dynamics and various star formation tracers, and briefly discuss the implications of our results.
2 Observations and Data Reduction
We used the dual-receiver capability of the PdBI to obtain simultaneous observations of the HCN(1-0) and 12CO(2-1) lines at and , respectively. The 9 hr long observations were performed on January 15th, 2006, with all six PdBI antennas in their new, extended A configuration providing baselines between and . For calibration and mapping, we used the standard IRAM GILDAS software packages CLIC and MAPPING (Guilloteau & Lucas 2000). The phase center of the observations was at 20h34m52.36s +60d09m15.96s (J2000.0). All velocities are reported relative to . During the observations, the typical system temperature in the sideband containing the line of interest at 89 (230) GHz was about 110 (300) K.
The new 12CO(2-1) observations were combined with our previous dataset (presented in paper I) that was obtained with the same spectral setup in the old AB configuration. The data reduction and imaging closely followed the procedures described in paper I. In order to obtain emission line-only maps, we subtracted (in the plane) continuum maps obtained from line-free channels over the following spectral ranges: 88.335–88.579 GHz, 88.654–88.704 GHz, and 88.767–88.886 GHz for the band, and 230.211–230.367 GHz and 230.605–230.761 GHz for the band. Using uniform weighting, the resulting CLEAN beams are (PA ) and (PA ) for the HCN(1-0) and 12CO(2-1) line, respectively. For both lines, we defined a CLEAN region based on the 0th moment map. The rms in the wide channels is 2.3 mJy beam-1 for HCN(1-0) and 4.8 mJy beam-1 for CO(2-1). The rms in the continuum maps is 0.2 (0.21) mJy beam-1 and 0.7 mJy beam-1 for natural (uniform) weighting at and , respectively. Moment maps were calculated using the GIPSY task ’MOMENTS’ requiring that emission is present above a 3(2) clipping level in at least two adjacent channels of the CO (HCN) data cube.
3 Results
3.1 Distribution and Kinematics of CO
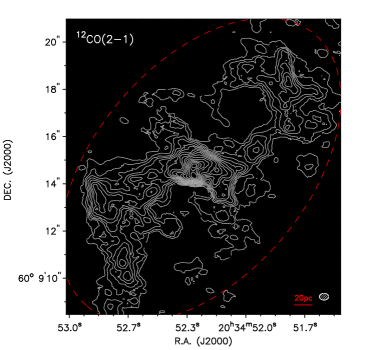
As evident from Fig. 1, the new 12CO(2-1) observations clearly resolve the structure of the inner CO spiral111For the description of the various morphological components, we adopt the nomenclature introduced in paper I. described in paper I. The south-eastern gas lane splits into two components while the north-western lane still appears as a single structure. More importantly, the structure of the nuclear clump is resolved into two peaks north and south of our derived dynamical center with extensions to the east and west which connect to the gas lanes. Overall, the molecular gas is in clumps that are mostly unresolved at our resolution of (11x8) pc2, suggesting that the GMCs are rather compact, dense, and gravitationally bound.
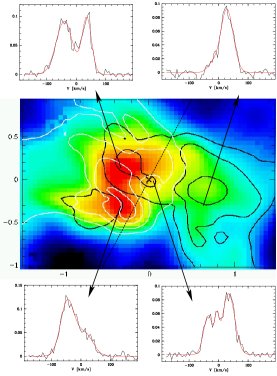
The emission lines in the central have complex profiles we fit with 2- or 3-component Gaussians. They often have two peaks, at and relative to the systemic velocity, with a third peak at in the inner 0.4”, near the dynamical center (Fig. 3). The velocity dispersions are 20 to 30 km/s in the two main peaks, and in the third, central component. Most of the negative velocity component is confined to one side of the dynamical minor axis, a result which is consistent with the gas kinematics being dominated by circular motions. This is also true for the positive velocity component besides an extra peak about NE of the dynamical center, close to the northern CO peak in the integrated map. This is also illustrated by the double-peaked line profile of the northern peak (Fig. 3) when compared with the simpler line profile of the southern peak.
3.2 HCN(1-0) Emission
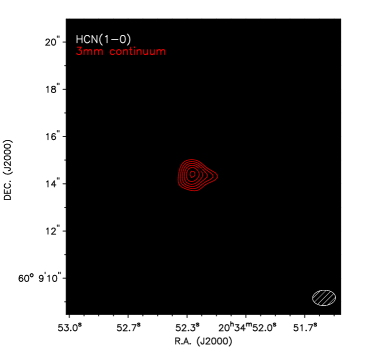
The HCN(1-0) emission associated with the nuclear and the southern clump is shown in Fig. 2. The map contains a total flux of about 4.5 Jy above a 2 threshold, that is about 8% of the flux of 11.4 K measured for the central position by Gao & Solomon (2004) using the IRAM 30m telescope (assuming a temperature-to-flux conversion of 4.8 Jy ). 60% of the recovered flux originates in the nuclear clump. The average line intensity ratio of HCN(1-0)/12CO(2-1) is 0.02-0.03. Thus, the non-detection of the northwestern part of the spiral structure is probably due to our S/N limit combined with the lack of short spacings in the HCN data. While there is a good correspondence between the HCN and 12CO(2-1) emission in the southeastern spiral structure, the integrated HCN emission has an additional peak in the nuclear disk about 1′′ west of the dynamical center.
3.3 Millimeter Continuum
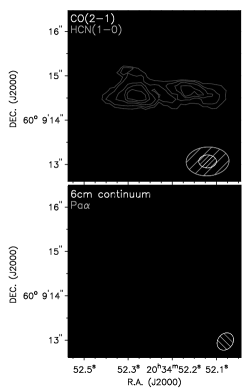
Continuum emission has been detected at and, tentatively, also at . The integrated flux is 2.8 mJy, with a peak flux of 1.9 (1.7) mJy beam-1 corresponding to a 9(8) detection with natural (uniform) weighting. The position of the peak is at 20:34:52.307 +60:09:14.37 (J2000) and offset by 0.4′′ from the dynamical center as derived in paper I. At the low levels the continuum shows an extension to the west (Fig. 2) and is slightly resolved in the uniformly weighted map with a Gauss-fit of size (FWHM) (PA ). Continuum emission at is present at the 4 level with a peak flux of 3.0 mJy beam-1 in the naturally weighted data. A recent 0.3′′ resolution 6 cm continuum map by Tsai et al. (2006) shows that the nuclear radio continuum breaks up into two bright peaks with extensions to the north and west. The continuum peak is off-set by to the north of the bright 6 cm peak (Fig. 4) strongly indicating that the 3 mm and 6 cm continuum emission have a different origin.
4 The Central 100 pc: Gas Flow and Star Formation
4.1 Bar-Driven Gas Kinematics
In paper I, we showed that the CO spiral can be explained by the response of the gas flow to the gravitational potential of the inner NIR bar in the central 300 pc. Our qualitative model requires the existence of an Inner Lindblad resonance (ILR) at a radius of due to a 400 pc long secondary bar. In this context, we expect gas to accumulate at or close to the ILR and, thus, star formation to occur. Such a mechanism is evoked to explain the formation of the nuclear star formation rings of kiloparsec diameter in barred galaxies (e.g. Wada & Habe 1992; Allard et al. 2006). While the CO data of paper I showed streaming motions associated with the bar, the exact distribution of the gas in the nuclear clump could not be resolved.
The CO(2-1) intensity distribution is very reminiscent of the so-called ’twin peaks’ structure seen in lower resolution CO(1-0) images of barred galaxies (Kenney et al. 1992) and associated with gas accumulation at the ILR. The two peaks of the negative and positive velocity component are located at a radius of (Fig. 3), i.e. within the ILR of our model. Dense gas as traced by the HCN(1-0) line roughly coincides with those CO(2-1) peaks (Fig. 4). One way to interpret these gas peaks is as the contact points of two spiral arms connecting in the central 100pc. Our derived line intensity ratios (using the integrated flux and correcting for different beam sizes) correspond to temperature ratios of , similar to values found in kpc-sized starburst rings (e.g. Kohno et al. 1999). As the presence and distribution of dense gas is analogous to what is observed in kpc-sized starburst rings of large-scale bars, our new data together with the kinematic analysis (presented in detail in paper I) are consistent with the interpretation that the inner bar drives the CO spiral even within the nuclear clump,
The nature of the additional eastern peak in the positive velocity component of the CO(2-1) emission is not clear. However, the young massive stars present there (Fig. 4) will clearly alter the properties of the (dense) molecular gas. In addition, we start to probe size scales where the size and stability of the GMCs themselves is becoming important. Observations of other molecular gas tracers might therefore be needed to clarify the situation.
4.2 Census of Nuclear Star Formation
The high extinction present in the central 100 pc makes it difficult to estimate the true star formation rate (SFR). In what follows, we compare different SFR indicators in the central 33′′ to develop a sense for how much star formation is still deeply embedded in dense gas clouds and hence does not reveal itself in observable emission from hydrogen recombination lines.
The ’visible’ SFR can be traced by the NIR Pa line emission arising from HII regions. Using a Pa flux of from the image by Böker et al. (1999) and assuming an extinction of AV = 4.6mag (Quillen & Yukita 2001), we derive a SFR of 0.13 (see paper I for details). This value can be directly compared to the SFR rate derived from the non-thermal radio continuum which is associated with synchrotron emission from supernovae explosions (e.g. Condon 1992). Turner & Ho (1983) find that most () emission at 6cm in the nuclear region of NGC 6946 is non-thermal in origin, while the detailed work by Tsai et al. (2006) show that point-like sources (either due to HII regions or supernova remnants) contribute about 30% to the total 6cm flux. We measure a flux density of about 15 mJy in the central 100 pc. Using equation [21] of Condon (1992) and assuming that 80% is non-thermal in origin, we derive a SFR of 0.1 (also taking into account stars below 5) in agreement with the SFR derived from the Pa line. This agreement might be expected, as the spatial distributions of Pa and 6 cm radio continuum agree very well (Fig. 4), and it supports our assumption that both are tracers of stellar populations of similar age.
The millimeter continuum emission, on the other hand, traces free-free emission from star formation sites that are still embedded in their parent clouds. This picture is supported by two arguments: first, the distribution of the mm continuum emission differs from that of the radio continuum. Secondly, the spectral index between the 3 mm and 1 mm continuum flux is about 0.1 (within the uncertainties on the 1mm flux), which is expected for free-free emission. Following the equations summarized in Johnson (2004) we find an ionizing luminosity of , equivalent to a SFR of 0.1 . This is an additional contribution to the total SFR, originating in regions which are not (yet) seen in hydrogen recombination lines.
Finally, Gao & Solomon (2004) showed that there is a linear relation between the luminosity of the HCN(1-0) line and the far-infrared luminosity. This relation appears to not only hold true for entire galaxies, but also for individual star forming cores within our Galaxy (Wu et al. 2005). Thus, it seems reasonable to use the HCN(1-0) line flux as a proxy to estimate the rate of stars that are in the process of forming. Our measured HCN(1-0) line flux of 2.5 Jy km s-1 corresponds to a luminosity of L’(HCN)=. Following eq. [11] of Gao & Solomon (2004), we obtain another contribution of 0.06 to the total SFR.
In summary, the different diagnostics (Pa/6cm, 3mm, HCN) all trace star formation, but in different evolutionary stages. This is also apparent from their different spatial distributions. We find about twice as much embedded star formation (traced by HCN and 3 mm continuum) as star formation which has already emerged from its dust cocoon (traced by Pa). This implies that there has been significant massive star formation in the central 100 pc of NGC 6946 over the past 10 Myr. The ’older’ star formation has neither disrupted the GMCs seen in HCN nor has it prevented the nuclear star formation evident in the 3 mm continuum.
4.3 Nuclear Cluster Formation?
The nucleus of most late-type spiral galaxies is marked by a compact nuclear star cluster (Böker et al. 2002). In NGC 6946, however, such a nuclear cluster cannot be identified. Possibly, a nuclear cluster exists, but is obscured by the large amounts of molecular gas and dust in the central 1”. Another possibility is that we currently witness the birth of a nuclear cluster. According to our model (paper I), the bar-driven CO spiral structure requires the presence of an ILR, which itself implies a mass concentration on scales of about 20-30 pc (). Comparison of the different star formation tracers shows that stars are being formed in the central 60 pc at a rate of about 0.1 over the past 10 Myrs translating into a total of roughly 10 in stellar mass. The spatial distribution of the SFR tracers shows that star formation occurs in distinct areas (clusters, GMCs) spread over the central (). This suggests that the build-up of central mass takes place in an extended (albeit small) volume around the nucleus, rather than at the very center. This is consistent with the recent identification of blue, extended disks around a number of nuclear clusters (Seth et al. 2006). NGC 6946 offers the unique opportunity to study the processes linked to the build-up of a central mass concentration.
Acknowledgements.
ES would like to thank Philippe Salome for his help with the IRAM data reduction. We also thank Chao-Wei Tsai and Jean Turner for providing their 6cm VLA data for comparison and the referee Jonathan Braine for helpful comments.References
- Allard et al. (2006) Allard, E. L., Knapen, J. H., Peletier, R. F., & Sarzi, M. 2006, MNRAS, 867
- Böker et al. (1999) Böker, T., et al. 1999a, ApJS, 124, 95
- Böker et al. (2002) Böker, T., Laine, S., van der Marel, R. P., Sarzi, M., Rix, H.-W., Ho, L., & Shields, J. C. 2002, AJ, 123, 1389
- Condon (1992) Condon, J. J. 1992, ARA&A, 30, 575
- Devereux & Young (1993) Devereux, N. & Young, J. 1993, AJ, 106, 948
- Engelbracht et al. (1996) Engelbracht, C. W., Rieke, M. J., Rieke, G. H., & Latter, W. B. 1996, ApJ, 467, 227
- Gao & Solomon (2004) Gao, Y., & Solomon, P. M. 2004, ApJ, 606, 271
- Guilloteau & Lucas (2000) Guilloteau, S., & Lucas, R. 2000, ASP Conf. Ser., 217, 299
- Johnson (2004) Johnson, K. E. 2004, New Astronomy Review, 48, 1337
- Kenney et al. (1992) Kenney, J. D. P., Wilson, C. D., Scoville, N. Z., Devereux, N. A., & Young, J. S. 1992, ApJ, 395, L79
- Kohno et al. (1999) Kohno, K., Kawabe, R., & Vila-Vilaró, B. 1999, ApJ, 511, 157
- Quillen & Yukita (2001) Quillen, A. C. & Yukita, M. 2001, AJ, 121, 2095
- Schinnerer et al. (2006) Schinnerer, E., Böker, T., Emsellem, E., Lisenfeld, U. 2006, ApJ, 649, 181 (paper I)
- Seth et al. (2006) Seth, A. C., Dalcanton, J. J., Hodge, P. W., Debattista, V.P. 2006, AJ, 132, 2539
- Tsai et al. (2006) Tsai, C.-W., Turner, J. L., Beck, S. C., Crosthwaite, L. P., Ho, P. T. P., Meier, D. S. 2006, AJ, 132, 2383
- Turner & Ho (1983) Turner, J. L., & Ho, P. T. P. 1983, ApJ, 268, L79
- Wada & Habe (1992) Wada, K., Habe, A. 1992, MNRAS, 258, 82
- Wu et al. (2005) Wu, J., Evans, N. J., II, Gao, Y., Solomon, P. M., Shirley, Y. L., & Vanden Bout, P. A. 2005, ApJ, 635, L173