A Spitzer Space Telescope study of disks in the young Orionis cluster
Abstract
We report new Spitzer Space Telescope observations from the IRAC and MIPS instruments of the young ( 3 Myr) Orionis cluster. The populous nature of this cluster makes it a good target for statistically-significant studies of disk emission as a function of mass. We identify 336 stars as members of the cluster using optical and near-infrared color magnitude diagrams. Using the spectral energy distribution (SED) slopes in the IRAC spectral range, we place objects in several classes: non-excess stars, stars with optically thick disks (like classical T Tauri stars), class I (protostellar) candidates, and stars with “evolved disks”; the last exhibit smaller IRAC excesses than optically thick disk systems. In general, this classification agrees with the location expected in IRAC-MIPS color-color diagrams for these objects. We find that the evolved disk systems are mostly a combination of objects with optically thick but non-flared disks, suggesting grain growth and/or settling, and transition disks, systems in which the inner disk is partially or fully cleared of small dust. In all, we identify 7 transition disk candidates and 3 possible debris disk systems. There appears to be a spatial extension of infrared excess sources to the north-east, which may be associated with the young ( Myr) embedded cluster NGC 2024. As in other young stellar populations, the fraction of disks depends on the stellar mass, ranging from 10% for stars in the Herbig Ae/Be mass range (2 ) to 35% in the T Tauri mass range (1-0.1 ). We find that the disk fraction does not decrease significantly toward the brown dwarf candidates (0.1 ). The IRAC infrared excesses found in stellar clusters and associations with and without central high mass stars are similar, suggesting that external photoevaporation is not very important in many clusters. Finally, we find no correlation between the X-ray luminosity and the disk infrared excess, suggesting that the X-rays are not strongly affected by disk accretion.
1 Introduction
Observations have shown and theory predicts that disks around young stars are an inescapable consequence of star formation, given angular momentum conservation during protostellar cloud core collapse (Hartmann, 2005a; Ward-Thompson et al., 2005; Andre et al., 2000). As the resulting protoplanetary disks age, their excesses at near-infrared (NIR) and mid-infrared wavelengths decrease. Previous studies have indicated that the timescale for this evolution in disk emission is strongly dependent on the stellar mass (Lada & Lada, 1995; Muzerolle et al., 2003; Calvet et al., 2004; Sicilia-Aguilar et al., 2005) ranging from 5-7 Myr for objects in the mass range of the T Tauri stars ( TTS, with spectral type K5 or later; Haisch et al., 2001; Hartmann, 2005b; Hillenbrand et al., 2006) to 3 Myr for objects in the mass range of the Herbig Ae/Be (HAeBe) stars (spectral type F5 or earlier; Hernández et al., 2005).
The observed decreases in infrared emission can result from: grain growth to sizes much larger than the wavelength of observation; dust settling to the disk midplane, which reduces the “flaring” of the disk and thus the amount of energy radiated (Kenyon & Hartmann, 1987; Dullemond & Dominik, 2005; D’Alessio et al., 2006); clearing of small dust particles by large bodies in the disk; or some combination of these processes. Since grain growth and settling to the mid-plane occur fastest in the (warmer) inner disk (Weidenschilling, 1997; Dullemond & Dominik, 2004), the disk emission is expected to decline faster at short wavelengths than at long wavelengths, and there is observational evidence for this (Sicilia-Aguilar et al., 2006; Hartmann, 2005b; Lada et al., 2006).
Of particular interest are ”transition disk” objects, which have an inner, optically thin disk region, possibly produced by planet clearing, combined with an outer, optically thick disk (Calvet et al., 2002, 2005; D’Alessio et al., 2005a; Megeath et al., 2005a). Prior to the complete or nearly-complete clearing seen in transition disks, one would expect to observe optically-thick but reduced infrared emission from the inner disk, for which there is some evidence (e.g., Sicilia-Aguilar et al., 2006; Lada et al., 2006). However, additional large samples of stars are desirable to make the result more statistically significant, as stars of the same mass and age show a wide range of disk emission properties (Furlan et al., 2006).
The Orionis cluster is of particular interest because it is reasonably near and relatively populous, making possible statistically-significant studies of disk properties as a function of stellar mass. Moreover, Orionis has an age Myr at which one might expect the beginnings of disk evolution to become evident. It is part of the Orion OB1b sub-association which has an age of 1.7-7 Myr(Warren & Hesser, 1978; Brown et al., 1994, 1998; Briceño et al., 2005). Low-mass members of the Orionis cluster were first reported by Walter et al. (1997), who found over 80 X-ray sources and spectroscopically identified more than 100 low mass, pre-main sequence (PMS) members lying within 1 degree from the star Ori. The distance calculated by Hipparcos for this star (352) agrees, within the uncertainties of Hipparcos, with the Hipparcos distance calculated for the overall population of the stellar subassociation OB1b (43933; Brown et al., 1998), which is statistically more reliable. The estimated age of the cluster is 2-4 Myr (Zapatero Osorio et al., 2002; Oliveira et al., 2002; Sherry et al., 2004; Franciosini et al., 2006). Since the Orionis cluster is relatively near and the reddening toward the center of the cluster is low (E(B-V)=0.05 mag; Brown et al., 1994; Béjar et al., 1999), this stellar cluster is an excellent laboratory to study young stars in a entire range of mass, from the massive and multiple O9.5 type star Ori to the lowest mass objects, like brown dwarfs and free-floating planets (e.g., Barrado y Navascués et al., 2001, 2003; Béjar et al., 1999, 2001, 2004; Burningham et al., 2005; Caballero, 2005; Kenyon et al., 2005; Oliveira et al., 2006; Scholz & Eislöffel, 2004; Sherry et al., 2004; Zapatero Osorio et al., 2002; Walter et al., 1998).
The unprecedented sensitivity and spatial resolution provided by the Spitzer Space Telescope in the near- and mid-infrared windows are powerful tools to expand significantly our understanding of star and planet formation processes. In this contribution, we analyze the near- and mid-infrared properties of stars in the Orionis cluster, ranging in mass from HAeBe stars to the substellar limit.
2 Observations
2.1 Infrared photometry
We have observed a field of 1730 arcmin2 on the Orionis cluster using the four channels (3.6, 4.5, 5.8, and 8.0 µm) of the InfraRed Array Camera (IRAC, Fazio et al., 2004); 90% of this field was also observed using the 24 µm band of the Multiband Imaging Spectrometer for Spitzer (MIPS, Rieke et al., 2004).
The IRAC observations presented here were taken on October 9, 2004. The field of view was covered by a position mosaic (20” overlap), with three dithered exposures at each position. Images were obtained in High Dynamic Range (HDR) mode, whereby a short integration (1 second) is immediately followed by a long integration (26.8 seconds). Standard Basic Calibrated Data (BCD) products from version S13.2 of the Spitzer Science Center’s IRAC pipeline were used to make the final mosaics. Post-BCD data treatment was performed using custom IDL software (Gutermuth et al. 2004, Gutermuth et al. 2006) that includes modules for detection and correction of bright source artifacts, detection and removal of cosmic ray hits, construction of the long and short exposure HDR mosaics, and the merger of those mosaics to yield the final science images.
MIPS observations were made using the medium scan mode with half-array cross scan overlap, resulting in a total effective exposure time of 80 seconds. The 24 µm images were processed using the MIPS instrument team Data Analysis Tool (DAT), which calibrates the data and applies a distortion correction to each individual exposure before combining into a final mosaic (Gordon et al., 2005).
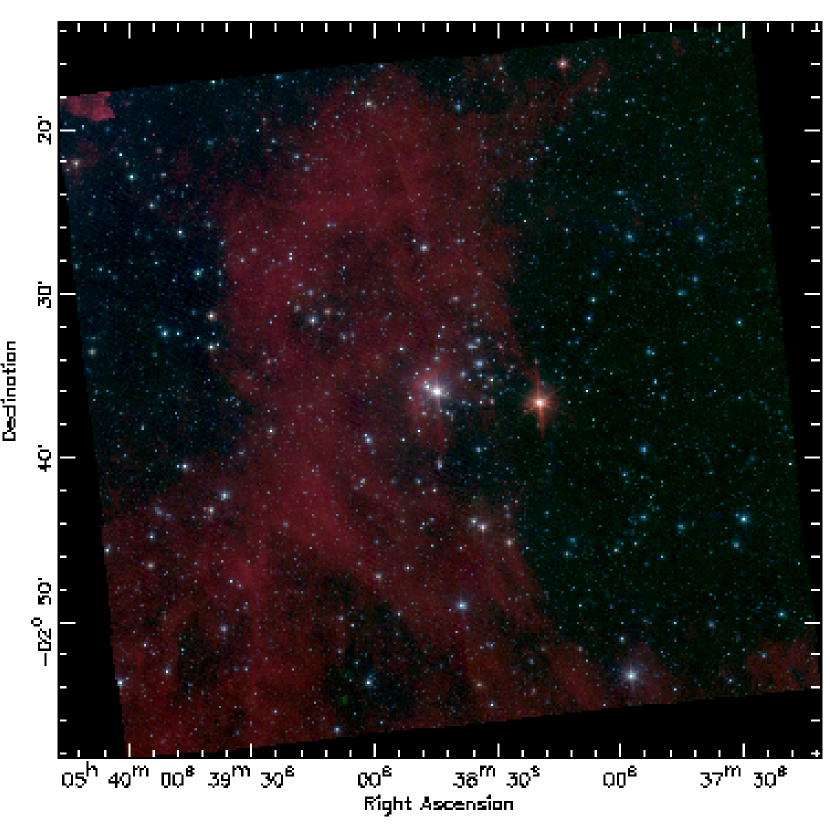
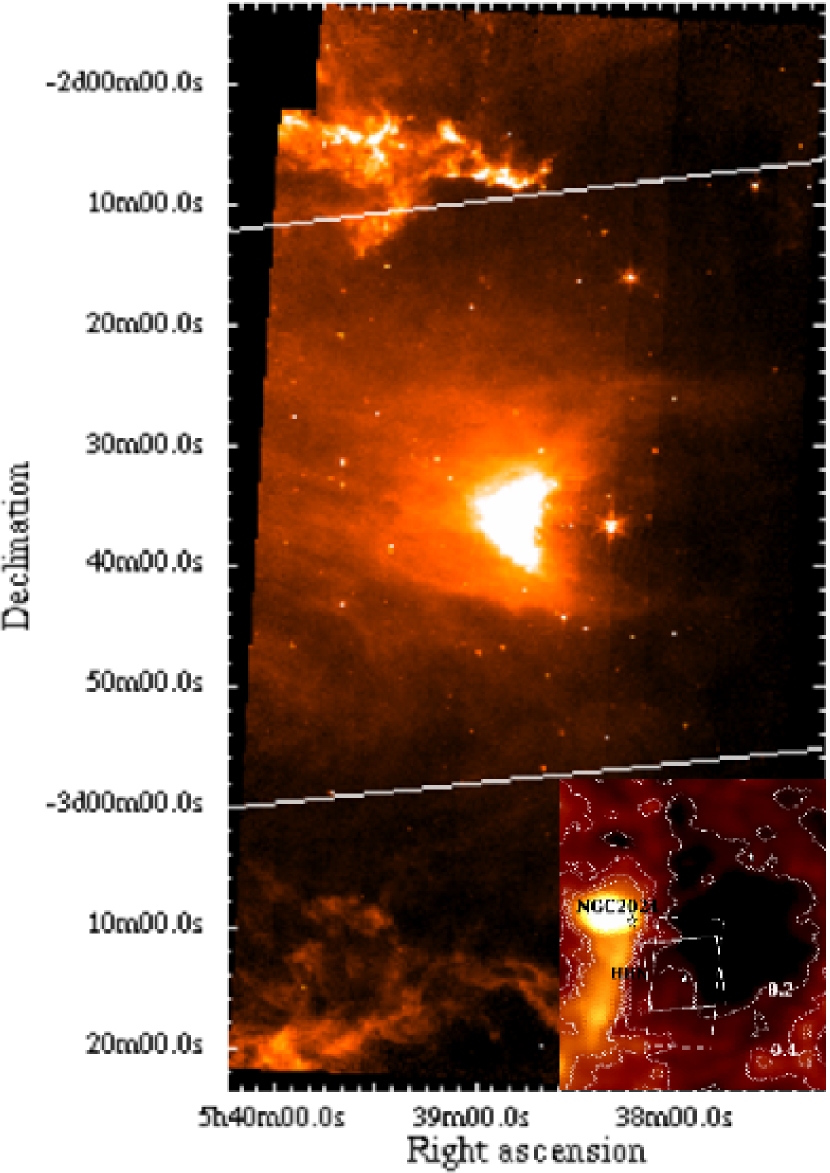
Figures 1 and 2 show the IRAC color and the MIPS 24 µm images of the Orionis cluster. The lower-right panel in Figure 2 shows a map of dust infrared emission (Schlegel et al., 1998) illustrating the location of the cluster in the OB1b sub-association, which can be traced by the ringlike structure centering at RA84 and DEC-2 (Briceño et al., 2005; Hernandez et al., 2006). In this panel, the boxes show the positions of the IRAC (small box) and MIPS (large box) scan regions. The isocontours are estimators of galactic extinction (for =0.2, 0.4, 0.6 & 0.8 mag) from the 100 µm map of dust emission (see, Schlegel et al., 1998). The galactic extinction and the background at 8 and 24 µm is quite low compared with other regions with similar ages, which improves the precision and sensitivity of the photometry.
Point source detections were carried out individually on each IRAC band using PhotVis (version 1.09), an IDL GUI-based photometry visualization tool developed by R. Gutermuth using the DAOPHOT modules ported to IDL as part of the IDL Astronomy User Library (Landsman, 1993). More than 10,000 sources were detected in at least one Spitzer band. We extracted the photometry of these objects using the apphot package in IRAF, with an aperture radius of 3″.7 and a background annulus from 3.7 to 8″.6. We adopted zero-point magnitudes for the standard aperture radius (12″) and background annulus (12-22″.4) of 19.665, 18.928, 16.847 and 17.391 in the [3.6], [4.5], [5.8] and [8.0] bands, respectively. Aperture corrections were made using the values described in IRAC Data Handbook (Reach et al., 2006). A preliminary list of 1682 objects (hereafter Sample 1) was created by selecting those objects having photometric measurements in all IRAC bands with errors less than 0.15 magnitudes. We obtained point source photometry at 24 µm with IRAF/daophot point spread function fitting, using an aperture size of about 5″.7 and an aperture correction factor of 1.73 derived from the STinyTim PSF model. The absolute flux calibration uncertainty should be 4% (Engelbracht et al., 2006). Because of the contamination by the bright star Ori in the IRAC and MIPS images, stars located within 30″ of this O star were not included in the preliminary list.
2.2 Optical photometry
Optical magnitudes were obtained from the CIDA Equatorial Variability survey which is being carried out using the QUEST I camera (Baltay et al., 2002) installed at the Jurgen Stock Telescope (a 1-m Schmidt telescope) at the Venezuelan National Observatory of Llano del Hato. The camera, an array of 4x4 CCDs, is designed to work in driftscan mode, which is a very efficient way to survey large areas of the sky. Each scan of the sky was reduced and calibrated with the standard QUEST software and the method described in Vivas et al. (2004) for scans centered at =-1. We used data from multiple scans centered at . The scans have a width of 2.2∘ in . The range in right ascension shown in Figure 1 is covered completely by these optical observations. However, there is no data in a small region from -2.52∘ -2.44∘, corresponding to the gap between CCDs in the QUEST I camera. Most objects with an optical counterpart have more than 10 measurements, so we can identify the variables using differential photometry (Vivas et al., 2004).
3 Membership selection
We do not have spectroscopic confirmation for most of the probable members in the Orionis cluster. We must use photometric criteria to make a robust selection of members, as described below.
3.1 Rejecting extragalactic objects
Figure 3 shows the [3.6] versus [5.8]-[8.0] color-magnitude diagram for Sample 1 (§2.1). The bulk of the sample has [5.8]-[8.0]0 and [3.6]14.5; below this limit the number of objects with photospheric colors ([5.8]-[8.0]0) decreases drastically, and the contamination from extragalactic sources is expected to be more than 50% (Fazio et al., 2004). We identify extended sources (crosses) by computing the radial profile for each object using the radprof task in IRAF, and designate as extended sources those with FWHM values more than 3 standard deviations from the median in all IRAC bands; typically this means FWHM2″. Most objects located below the [3.6] band limiting magnitude (solid line) in Figure 3 are identified in this way as extended sources and are likely to be extragalactic objects. We therefore initially restrict our sample to objects above the solid line in Figure 3.
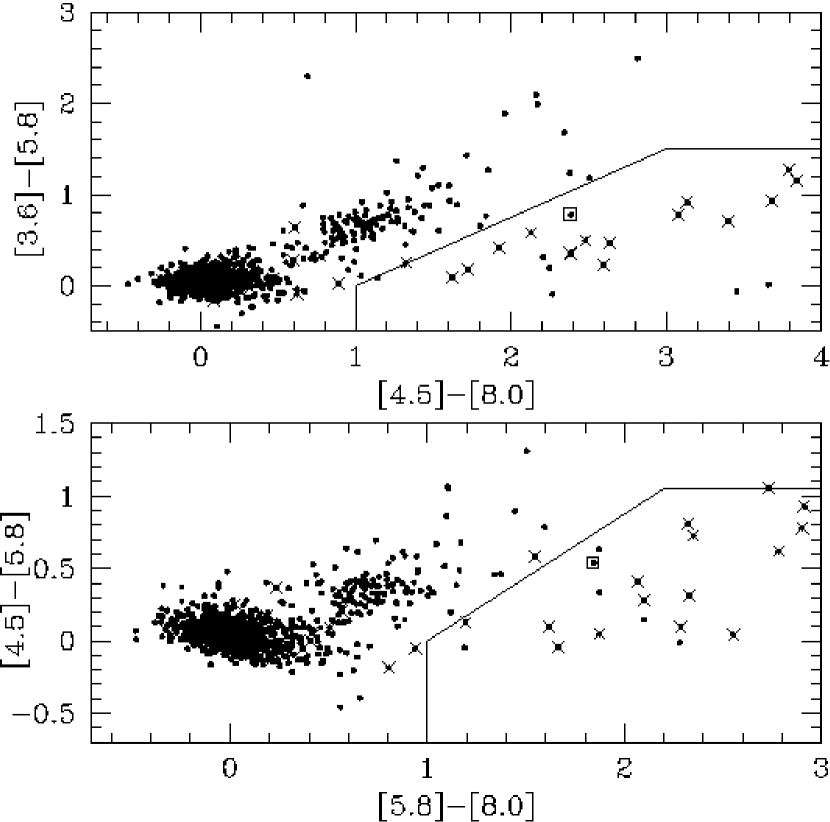
Some galaxies have very red colors because of strong PAH (polycyclic aromatic hydrocarbon) emission; with features at 7.7, 8.6, 11.2, 12.7, 16.4, and 17.1 µm correlated with star formation rates (Wu et al., 2005). Gutermuth et al. (2006) showed that the [4.5 - 5.8] versus [5.8 - 8.0] and [3.6 - 5.8] versus [4.5 - 8.0] color-color diagrams can be used to eliminate most of these objects. As shown in Figure 4, objects below and to the right of the solid lines are likely to be PAH-rich galaxies. We find that most of the PAH-rich galaxy candidates have extended radial profiles as inferred from point-source fitting. Visual inspection of the IRAC images also shows that many of these candidates are diffuse objects. In addition to the galaxies, other objects with similar colors turn out to be faint companions of brighter stars, thus calling into question the accuracy of the photometry. Only one object (open square) with a stellar profile is located in the PAH-rich galaxies regions; this star (HD294268=SO411) has been identified as a young star with spectral type F5 (Gregorio-Hetem & Hetem, 2002). We therefore eliminate the rest of the objects below the solid lines in Figure 4, resulting in a sample of 1280 stellar sources (hereafter Sample 2).
About 40% of the objects in Sample 2 do not have optical counterparts in the CIDA Equatorial Variability survey; most of these objects are fainter than the limiting magnitude (V19.7) or brighter than the saturation limit (V13.5) of this survey. Some of the objects in Sample 2 also are located on the gap in declination of the survey. We augmented the V optical data set using photometry from (Sherry et al., 2004) and for the brightest objects from the Kharchenko (2001) catalog.
3.2 Additional photometric selection
Virtually all the objects in Sample 2 (99%) have 2MASS counterparts (Cutri et al., 2003). Figure 5 shows the distributions of J magnitudes for all 2MASS sources in the IRAC field (open histogram) and for the 2MASS sources included in Sample 2 (striped histogram). Comparison of these two histograms indicates that Sample 2 is essentially complete to about J=14.0. Assuming a reddening of E(B-V)=0.05 (Brown et al., 1994; Béjar et al., 1999), a distance of D=440 pc (Brown et al., 1998; Hernández et al., 2005) and the 3 Myr isochrones from Baraffe et al. (1998), the equivalent completeness limit in mass is 0.15 (spectral type M5). For comparison, the distribution of J magnitudes for our MIPS detections (solid histogram) is shown in Figure 5. Most of brightest objects (J11; 1.5 ) have 24 µm detections.
Sample 2 includes 214 stars previously found to be members by other investigators (hereafter previously known members; see the Appendix A). Of these objects, the membership of 104 stars were confirmed spectroscopically, while the other 110 stars were assigned membership based only on optical photometry. In addition, 105 objects in our sample have been identified as X-ray sources by Franciosini et al. (2006), of which 49 objects have not been identified previously as spectroscopic or photometric members.
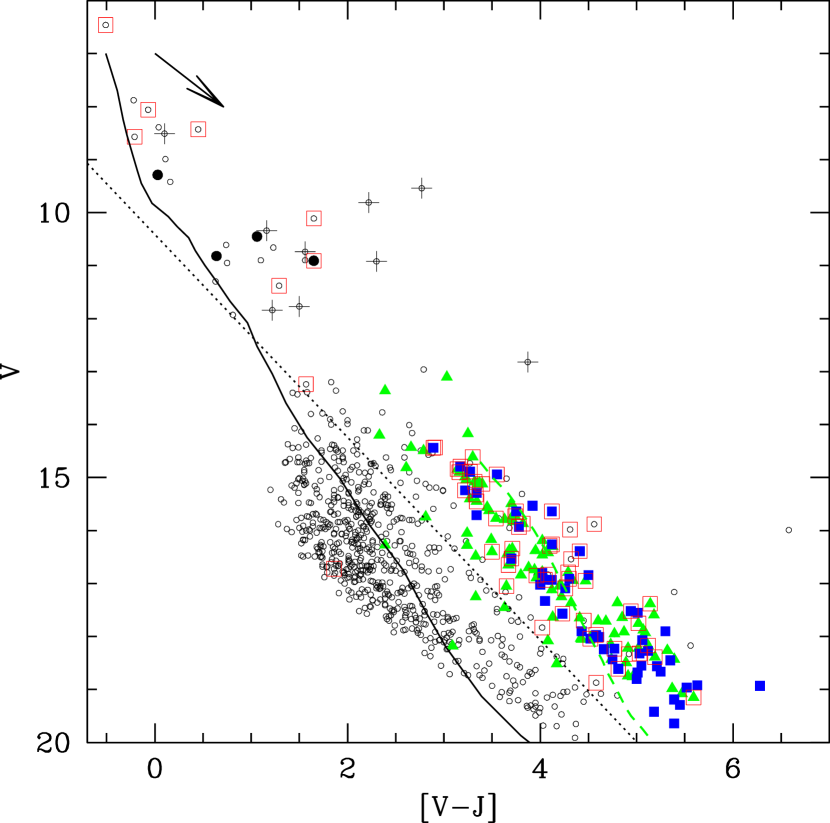
Figure 6 shows the V versus V-J color-magnitude diagram for Sample 2. Filled squares (spectroscopic members) and filled triangles (photometric members) represent previously known members; both distributions share the same region in Figure 6 suggesting that optical photometric selection can be effective in identifying low mass members (see also; Kenyon et al., 2005; Burningham et al., 2005). The stars with roughly follow the 3 Myr isochrone of Baraffe et al. (1998, dashed curve), while the redder stars depart significantly from the theoretical isochrone; this may be due to incompleteness in the opacity tables at low temperatures, resulting in theoretical colors that are too blue for V-J 4 (Lyra et al., 2006; Baraffe et al., 1998). Filled circles represent the higher mass stars selected by Kharchenko et al. (2004) with high membership probabilities (50%); the plus symbols represent bright stars with very low probabilities of membership.
The mean of the distribution of previously known cluster members can be characterized roughly as straight line in the V versus V-J diagram, with a standard deviation (V-J) mag. As a first approximation, we define the photometric region of probable members as the region above the dotted line in Figure 6. This line represents the lower 3 deviation from the mean distribution line. The X-ray detected stars (Franciosini et al., 2006), labeled by open squares, are mostly located in the region of the previously known cluster members (most of these objects were identified previously as cluster members). Therefore, X-ray emission can be used as an additional criterion supporting membership in young stellar groups (e.g.; Carkner et al., 1998; Preibisch & Feigelson, 2005; Franciosini et al., 2006).
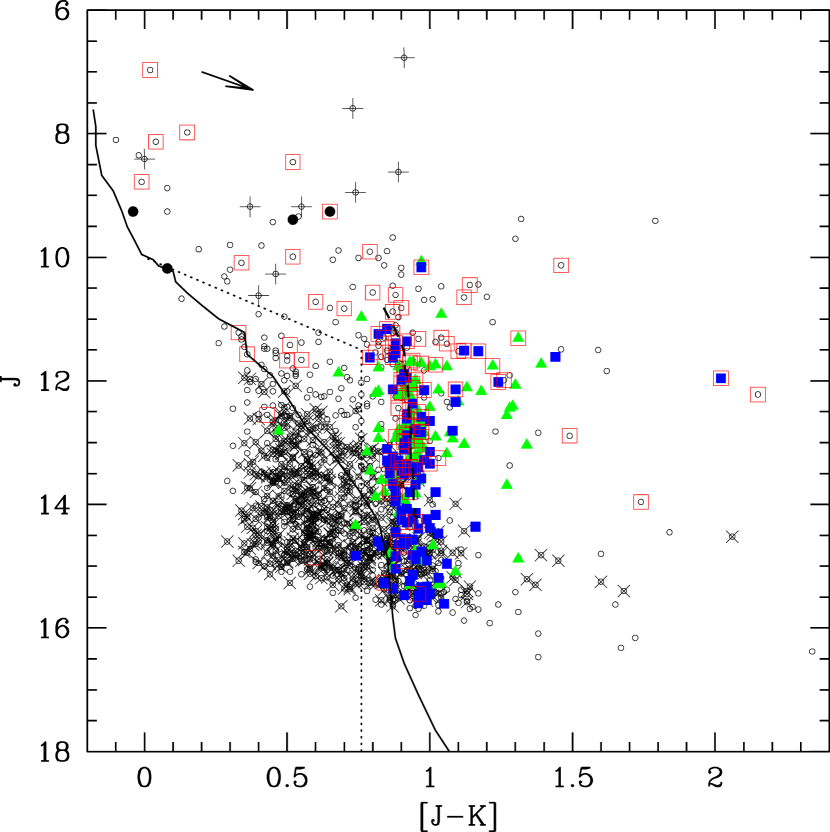
Figure 7 shows the J versus J-K color-magnitude diagram for Sample 2. Stars with J 11.5 have similar J-K colors, in agreement with the trend expected for the 3 Myr isochrone from Baraffe et al. (1998). For these stars, the distribution of J-K color can be represented as a Gaussian function centered at J-K=0.94 with (J-K) = 0.06. We adopt the border between members and non-members to be the 3 deviation line (dotted line). For stars with J11.5, we define the region of probable members by using the X-ray sources in addition to the known members of the cluster. The crosses represent non-members defined using Figure 6 (below the dotted line). Some of these non-members, with J13, appear in the region of probable members in Figure 7, so some contamination would result from selecting stars using 2MASS colors alone.
Our preliminary member sample consists of stars located redward from dotted lines in Figures 6 and 7, X-ray sources (Franciosini et al., 2006), and previously known members (see §A) located redward from the dotted line in Figure 7. Our preliminary uncertain member sample of the cluster includes those objects selected using only the criterion defined in Figure 7, where the contamination of non-members could be important and additional confirmation is required.
The most important source of contamination are field M dwarfs. Given the galactic latitude of the Orionis cluster (b17.3 deg), M giant stars are not expected to be a significant source of contamination (5%) in the cluster (Béjar et al., 1999, 2004). We identify 3 possible M giants stars using the J-H versus H-K color-color diagram (Bessell & Brett, 1988), including them in the uncertain members sample.
Jeffries et al. (2006) showed that young stars located in the general region of the cluster consist of two populations with different mean ages and distances superimposed along the line of sight: one with an age of 3 Myr located at 439 pc (consistent with the Orionis cluster) and the other with 10 Myr located at 326 pc, which could be associated with the Orion OB1a association (Jeffries et al., 2006; Briceño et al., 2006). However, most of the objects belonging to the older stellar group are located north-ward from the main population of Orionis cluster, so that the contamination by the older stars in our survey should be small, 10% (Jeffries 2006, private communication). In particular, 11 out 75 stars included in our preliminary member sample have radial velocities from Jeffries et al. (2006) consistent for stars in the older population but inconsistent with those of the Orionis cluster. These stars were included, with a note, in the uncertain member sample. Only two stars in our uncertain members sample have radial velocity expected of stars in the Orionis cluster; we included these in our final membership list.
The final catalogs include 336 stars in the member sample and 133 stars in the uncertain member sample. In the member sample, 132 stars have optical photometry from the CIDA survey, of which 57 stars (43%) were classified as variable stars using the method described in Vivas et al. (2004); since young stars are expected to exhibit photometric variability (e.g.; Cohen & Schwartz, 1976; Herbst & Shevchenko, 1999; Briceño et al., 2005), this is an additional criterion supporting membership.
Table 1 shows IRAC, MIPS and V photometry data for stars in the member sample according to the criteria discussed above. Column 1 shows the internal running identification number in our sample; columns 2 and 3 are the stellar coordinates; columns 4, 5, 6 and 7 give IRAC magnitudes in the bands [3.6], [4.5], [5.8] and [8.0], respectively; column 8 gives MIPS (24 µm) magnitudes; columns 9 and 10 show the V magnitudes and its sources; column 11 indicates if the star has been identified as variable in the CIDA survey; column 12 indicates if the star is a x-ray source (Franciosini et al., 2006); column 13 shows the disk classification based on on the IRAC and MIPS analysis (see §4); the last column gives the references for the previously known members. Table 2 shows IRAC and MIPS photometry for stars included in the uncertain member sample. The information shown in this table in columns from 1 to 8 is the same as in Table 1. The last column shows the disk classification based on the IRAC and MIPS analysis discussed in the following section.
4 Results
4.1 Infrared color-color diagrams
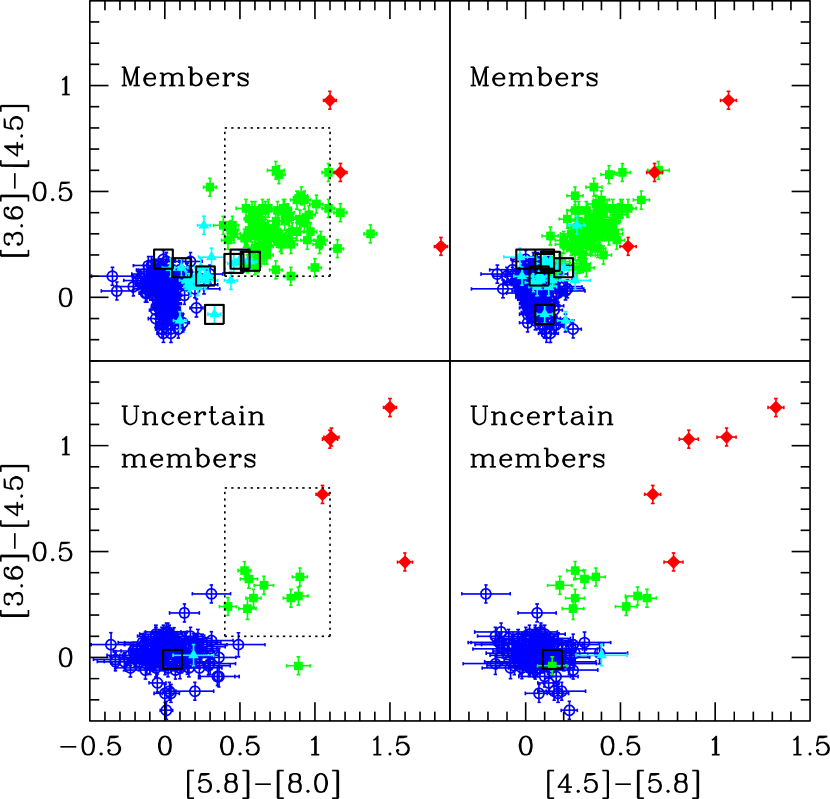
Figure 8 shows two IRAC color-color diagrams, [5.8]-[8.0] versus [3.6]-[4.5] (left panels) and [4.5]-[5.8] versus [3.6]-[4.5] (right panels), for the members (upper panels) and uncertain members (lower panels). Different symbols show the disk classification based on the IRAC SED slope (§4.2). Particularly, triangles, squares and diamonds represent stars with different levels of infrared emission, while circles are non-excess stars. Symbols surrounded by open squares show objects with small or no excesses in the IRAC bands but large excesses at 24 µm (see below). The dashed box in the [3.6] - [4.5] versus [5.8] - [8.0] color-color diagram indicates the the region predicted for stars with optically-thick disks (§4.2) by the models of D’Alessio et al. (2005b)
The upper-left panel of Figure 8 shows that most of stars with significant IRAC excess (squares; hereafter IRAC class II stars) have colors in agreement with model colors for optically-thick disks. The stars without IRAC excesses (hereafter IRAC class III stars) are located around the photospheric region ([5.8]-[8.0]0, [3.5]-[4.5]0). A few systems are found in the region between the IRAC class III and class II stars; these objects with weak IRAC excess (triangles) are discussed in more detail in §4.2. Two of these objects (the stars SO638 and S0299) have [3.6]-[4.5]0, while exhibiting significant emission at longer wavelengths. Three other objects (diamonds) have very large excesses which may suggest the presence of a protostellar envelope (hereafter IRAC class I candidates); SO457 (IRAS05358-0238), SO927 (an emission line object Weaver & Babcock, 2004), and SO411 (HD294268). The last two objects have [3.6]-[4.5] colors expected for class II systems, so these objects are more likely to be objects with optically-thick disks and high 8 µm fluxes due to strong silicate emission or rising SEDs at wavelength longer than 5.8 µm (§4.3).
In the upper-right panel of Figure 8, the [4.5]-[5.8] colors of IRAC class II stars shows less scatter in comparison with the [5.8]-[8.0] colors. There may be some PAH background contamination present in the [8.0] band; however, this also could indicate that intrinsic differences in disk flaring or other properties that may be more easily detected at m (D’Alessio et al., 2006). For example, the IRAC class II stars located redward from the dashed box (SO462, SO774 and SO1266) and the star S0411 (with [5.8]-[8.0]1.5) in the upper-left panel, have a flat or rising SEDs at wavelengths longer than 5.8 µm (see §4.3).
In the lower panels, nine IRAC class II stars are located in the region expected for stars with optically thick disks, and thus are likely to be cluster members. One IRAC class II star (SO1356), located below the model region, has an excess at [5.8]-[8.0], but not at [3.6]-4.5] or [4.5]-[5.8]. This star was not covered in the MIPS field, so it is not clear if the excess observed at 8 µm originates from PAH background contamination or from emission from an outer disk. The object SO1293 (represented by the triangle) has a larger excess at [4.5]-[5.8] than at [5.8]-[8.0]; it is faint (J=15.64) and so could have a longer wavelength excess below the MIPS detection limit.
Five uncertain members with very large infrared excesses (IRAC class I candidates), are plotted in the IRAC color-color diagrams: SO950, SO336, SO361, S0916 and SO668. Because AGN are located in the same region as the class I objects in these diagrams (Stern et al., 2005) and are too faint to easily detect spatial extension, additional data are needed to confirm these objects as protostellar members.
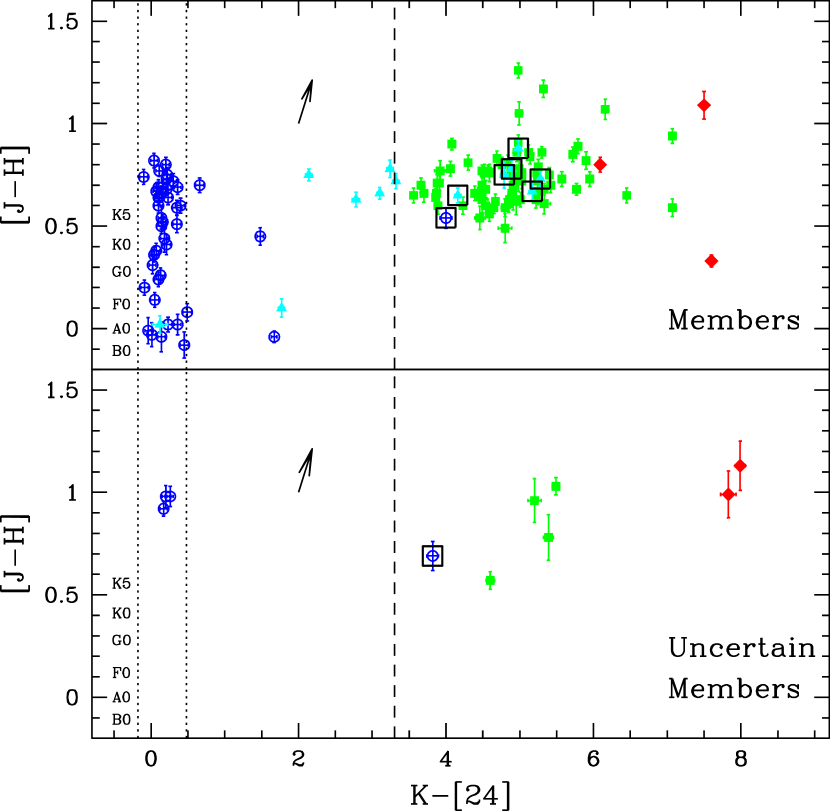
Figure 9 shows K-[24] versus J-H color-color diagrams for members (upper panel) and uncertain members (lower panel). We sort the objects into three regions, depending upon the magnitude of their K-[24] excesses (see also Hernandez et al., 2006). One region consists of K-[24] , corresponding to systems with undetectable or very uncertain long-wavelength excesses, given photometric errors. A second region encompasses objects with K-[24] 3.3, corresponding to optically-thick disk emission and/or protostellar envelope emission. Finally, the intermediate-excess region 0.5 K-[24] 3.3 is consistent with colors typical of optically-thin debris disks [the famous Pic debris disk system, which is one of the debris disk system with largest 24 µm excess known, has K-[24]3.3; (e.g., Gorlova et al., 2004; Rieke et al., 2005)].
There are seven members with very large [24] excesses but low IRAC excesses (symbols surrounded by open squares); SO908, SO818, SO1267, SO897, SO299, SO587 and SO1268. The last object has no detectable IRAC excess. These stars are possible “transition disk” systems, in which the inner disk is completely or nearly-completely cleared of small dust but the outer disk is optically thick (Calvet et al., 2002, see §4.1). In the lower panel, the uncertain member SO120 is also a transition disk candidate.
There are two early type members which are located in the intermediate-excess region: SO913 (J-H=-0.04) has no IRAC excess and SO956 (J-H=0.10) has a weak IRAC excess (§4.2). These stars are “debris disk candidates”. The star SO981 (J-H0.45) shows no IRAC excess but has a modest 24 µm excess, and thus is a likely debris disk system around a K early type star. However, a more detailed study of the debris disk candidates in this young stellar cluster is necessary to clarify the actual nature of their 24 µm excesses, since contribution from primordial disk material could be present (Hernandez et al., 2006). There are 5 low mass star members (J-H0.5) with weak IRAC excess, in which the excesses observed at the IRAC bands and at 24 µm are consistent with a overall decrease of infrared emission from the inner and outer disks.
4.2 IRAC SED slope
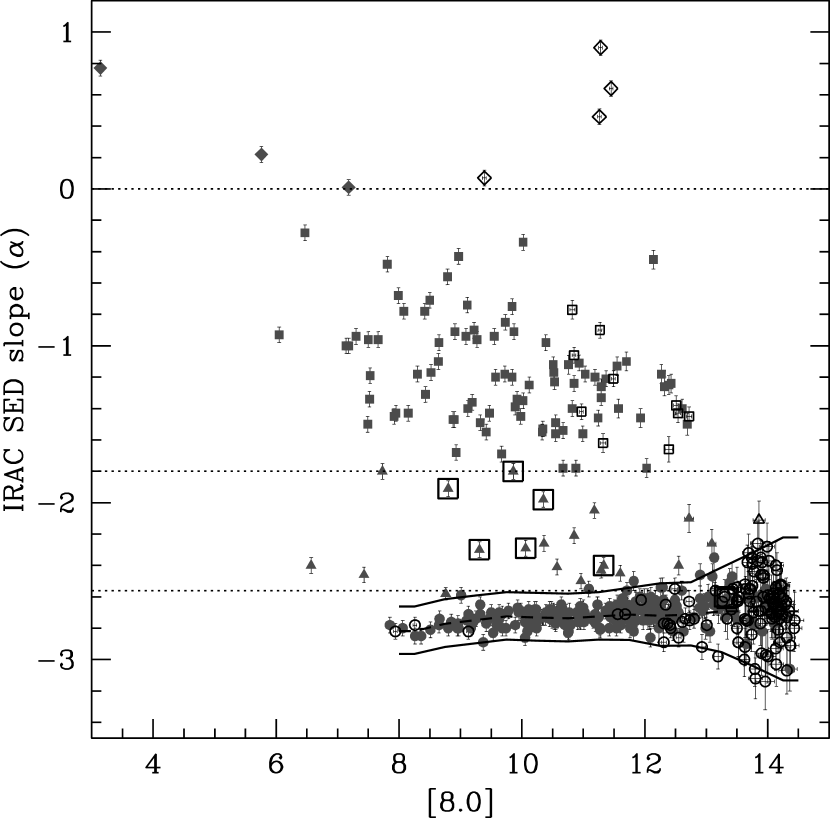
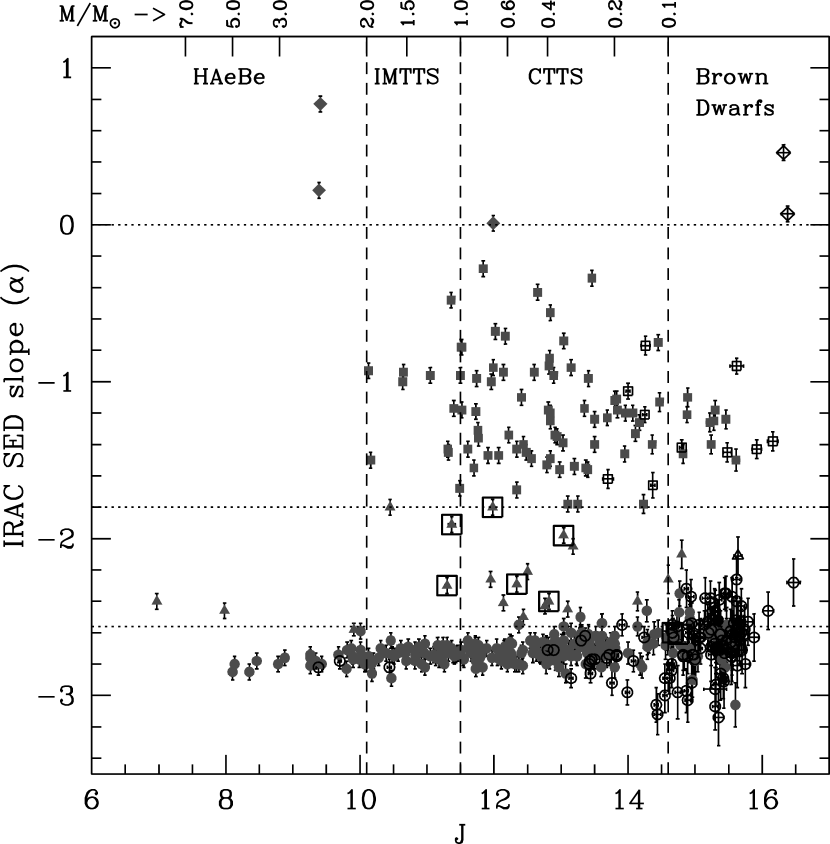
Lada et al. (2006) showed the utility of characterizing excess infrared emission using the IRAC SED slope determined from the [3.6]-[8.0] color, where =). In this system, IRAC class I candidates, defined as systems with , are usually protostars; disk-bearing systems, having , include IRAC class II stars and objects with weak IRAC excess (the lower limit depends upon spectral type and photometric errors, see below); and IRAC class III stars have essentially no inner disk emission, with (again, depending upon spectral type and errors).
Figure 10 shows versus the [8.0] magnitude for members (filled symbols) and uncertain members (open symbols) of the cluster. Dashed lines represent the regions of differing levels of infrared excess as discussed above. We subdivide the disk-bearing stars into two categories: IRAC class II stars (squares, -1.8); and systems with less IRAC infrared excess, which Lada et al. (2006) termed ”anemic” disks and which we call here “evolved disks” (-2.56 ).
Because the photometric uncertainties in increase with [8.0], a single straight line in Figure 10 to separate IRAC class III stars (in the IRAC wavelength range) and evolved disks is not useful. Lada et al. (2006) avoided this problem by applying their criteria to separate class III and evolved disks only to the brighter stars with spectral types M4.5 or earlier (the number of evolved disks would be overestimated in the lowest mass bins due to large photometric errors; C. Lada, private communication). We distinguish between IRAC class III stars (circles) and evolved disk systems (triangles) using the mean error of () calculated from the photometric errors for stars within 0.5 magnitude bins. IRAC class III stars are those with excesses, if any, smaller than the 3 deviation (solid lines) from the median .
We wish to examine the mass dependence of disk emission, but we do not have spectral types for most of these stars. As a proxy for mass, we use the J magnitude, which is relatively unaffected by disk excess emission, and convert to approximate mass ranges using the 3 Myr isochrone from Baraffe et al. (1998) for low mass (1 M) stars and Siess et al. (2000) high mass (1 M) stars, assuming a distance of 440 pc and E(B-V)=0.05. Figure 11 shows versus J, with the regions expected for objects in different ranges of mass: HAeBe range (2 M), Intermediate Mass TTS (IMTTS) range (1.0-2.0 M), TTS range (0.1-1.0 M) and Brown dwarfs range (0.1 M). Most of the objects with optically thick and evolved disks are located in the mass range of T Tauri stars.
Using the results from Figure 11, we derive the fractions of stars with optically-thick disks (filled circles + dotted line) and all disk-bearing stars (open circles + dashed line) versus J magnitude, with corresponding mass ranges indicated (see also Table 5). The lowest fraction of disks is observed in the highest mass stars (HAeBe range), in agreement with the fraction calculated for the overall population of OB1b sub-association (Hernández et al., 2005). There is a marginal evidence that the disk fraction declines toward lower masses (into the brown dwarf range), in agreement with results from Lada et al. (2006) for the young (2-3 Myr) stellar group IC 348. Nevertheless, including the error bars, the fraction is also consistent with no mass dependence toward lower masses. The fraction of thick disks in the TTS mass range agrees with the result from Oliveira et al. (2006, 336 %; ) for low mass stars.
Only 155% of disk-bearing stars in the TTS mass range are disk evolved objects, approximately in agreement with results from the 4 Myr-old cluster Tr 37 (10%; Sicilia-Aguilar et al., 2006), although with better statistics and higher photometric accuracy. If we assume a steady-state evolution of disks, and also assume that the evolved disks are going through a phase of clearing of small dust particles in the inner disk, then our observed frequency suggests a timescale of inner disk clearing Myr Myr.
4.3 Disk diversity: SEDs
Figure 13 shows SEDs (data from IRAC, MIPS, 2MASS and optical B, V, R and I magnitudes when are available) for selected members. The first 5 rows show the SEDs of stars in the mass range of TTS (0.1-1.0 M), while the last row shows the SEDs of stars in the mass range of HAeBe stars (2 M). SEDs (solid lines) are normalized to the J band and are sorted by different levels of IR excesses indicating differences in the disks. Each panel is labeled with the internal running identification number and the classification from the IRAC SED slope analysis (§4.2). The dotted line represents the median SED (Table 3) of optically thick disk stars in the mass range of TTS defined in Figure 11 (hereafter, optically thick disk median SED); error bars denote the quartiles of the distribution. This typical disk emission in the Orionis cluster is lower than the median in Taurus (D’Alessio et al., 1999, dot-dashed line in the first upper-left panel), which has an age of 1-2 Myr, indicating differences due to evolutionary effects such as grain growth and/or settling to the disk midplane (see also Sicilia-Aguilar et al., 2006; Lada et al., 2006), or lower accretion-rate (D’Alessio et al., 2006). The dashed lines represent the median photospheric SED (Table 4) in the T Tauri mass range.
The first row of Figure 13 shows the SEDs of evolved disk objects (SO905, SO1057, SO759 and SO587) which exhibit modest infrared disk emission. The lower level of infrared excess emission could be explained by decreasing the height of the irradiation surface in the disks due to a higher degree of settling, which diminishes the degree of flaring, thus producing flatter disk structures (D’Alessio et al., 2006). The second row of SEDs (SO120, SO1268, SO299 and SO897) shows some transition disk candidates, which exhibit little or no excess in IRAC bands but 24 µm emission similar to optically thick disks. This indicates a removal of small dust particles in the inner disks but not depletion or removal in the outer disk. In the next rows, the stars SO818, SO1267, SO908, SO1156, SO540 and SO1266 show somewhat weaker IRAC excesses. The stars SO73, SO927, SO1154, SO1153, SO457, and SO668 show larger infrared excesses than the optically thick median, which might indicate more highly flared disk structure (D’Alessio et al., 2006; Dullemond & Dominik, 2005), edge-on disks, or a contribution from an envelope. SO927 has strong emission in the H (Weaver & Babcock, 2004). SO1153 (V510 Ori; HH 444) and SO1154 (HH 445) are Herbig-Haro objects producing collimated outflows (Andrews et al., 2004). Finally, SO457 has been identified by Oliveira & van Loon (2004) as a class I object.
In the last row of Figure 13, SEDs of earlier-type members are compared with photospheres of stars with similar spectral types (long dashed line Kenyon & Hartmann, 1995). The star SO724 (B2; Guetter, 1981) shows small excess at 8 µm but has no excess at 24 µm, this star was classified in §4.2 as an evolved disk object possibly due to a background PAH contamination at 8 µm. The stars SO913 (B9.5; Guetter, 1981) and SO956 (A8; Guetter, 1981) show small or no excesses in the IRAC bands but have significant excesses at 24 µm, consistent with being debris disk stars. Finally, the star SO411, classified as class I candidate in §4.2, shows small excesses at wavelengths shorter than 5.8 µm and a rising SED at longer wavelengths. This emission line star, with spectral type F5 (Gregorio-Hetem & Hetem, 2002), could be an accreting transition disk object in the HAeBe mass range. This object alternatively could be considered to be an IMTTS, as F5 is the usual transition spectral type between HAeBe and IMTTS (see Hernández et al., 2004).
4.4 Disk evolution
Figure 14 shows the fraction of stars in the TTS mass range with near-infrared disk emission in different stellar groups, as a function of age (Hernández et al., 2005; Haisch et al., 2001). Recent Spitzer results for the young stellar clusters NGC7129 (Gutermuth et al., 2004), Taurus (Hartmann et al., 2005c), Chameleontis (Megeath et al., 2005a), Tr37 and NGC7160 (Sicilia-Aguilar et al., 2006), IC348 (Lada et al., 2006), and Upper Scorpius (Carpenter et al., 2006) have been included in this plot. The disk fractions shown in Figure 14 include stars with optically thick and evolved disks (disk-bearing stars) detected mostly using IRAC photometry. The Orionis cluster (filled square) follows (within the scatter of the distribution) the disk fraction trend outlined by in other stellar groups (Haisch et al., 2001; Hillenbrand et al., 2006).
Aside from the decrease in the disk fraction with age, the amount of infrared disk emission also decreases with age. Figure 15 shows the distribution of for low mass stars in the stellar groups Taurus (Hartmann et al., 2005c), IC348 (Lada et al., 2006), Orionis (this work) and Tr 37 (Sicilia-Aguilar et al., 2006). As in Figure 13, the youngest group, Taurus, has a larger population of stars with robust optically thick disks ( -1). In contrast, in the more evolved stellar groups most disk-bearing stars have an -1, indicating a reduction in the height of the disk photosphere (less disk flaring) in the inner regions.
The Taurus sample suggests a relatively clear break between stars without IRAC excesses and optically-thick disk systems (Hartmann et al., 2005c), although the sample size is relatively small. The Orionis sample also suggests a small fraction of objects with intermediate or evolved disk excesses, as discussed previously. The evolved disk fraction is less certain in Tr 37, due to the larger photometric errors for that more distant cluster. The IC 348 sample suggests a larger fraction of evolved disks than seen in Ori; the reality of this possible difference requires further study.
In contrast to IC 348, the Orionis and Tr 37 clusters include high mass stars located in their center (O9 in Orionis cluster and O7 in Tr37); however, the medians of are similar in these stellar groups (Figure 15). This suggests that external photoevaporation in Orionis and Tr 37 may be not very important for disk dissipation.
4.5 Spatial distribution of the Orionis cluster
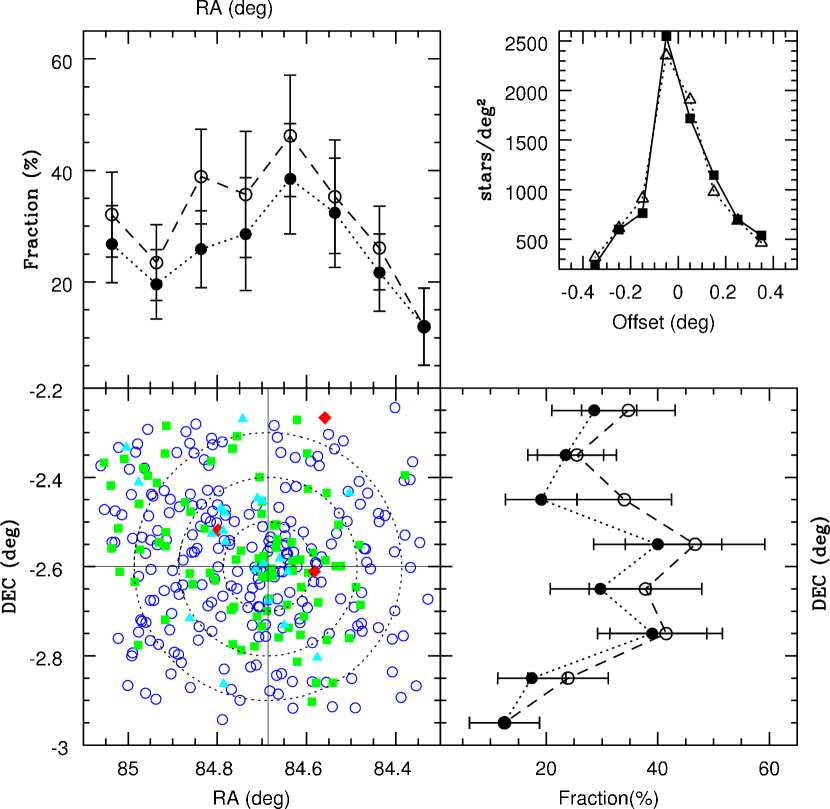
Figure 16 shows the spatial distribution of members with and without infrared excesses. As shown in the upper right panel, the space density has a peak with a FWHM of 0.25 (1.9 pc). The upper-left panel shows the ratio of systems with disks to the total members in radial distance bins defined by the semi-circles East-West versus the radial distance from the center of the cluster. Solid circles (+dotted line) represent the fraction of thick disks, while open circles (+dashed line) represent the total fraction of disk-bearing stars, defined in §4.3. The error bars represents the statistical error in our disk fractions, where N is the number of stars with disks. Similarly, the lower-right panel shows the fraction of disks in radial distance bins defined by the semi-circles North-South. In contrast to the result of Oliveira et al. (2006), using K and L band observations, there is evidence for a higher disk fraction near the cluster center. However, we cannot rule out a small, relatively uniform contamination of non-members which could also produce this effect.
There is a slight increase in the disk fraction in the north-east direction; in the direction toward NGC2024 (age 1 Myr, D440 pc; Levine et al., 2006; Eisner & Carpenter, 2003), located at 1.0 deg from the Orionis center; this fraction could be affected by disk-bearing members of this younger stellar group. Since NGC2024 is centrally concentred, the fraction could be also affected by stars extends toward the Horsehead nebula (located at 0.6 deg from the Orionis center), which also shows several class II objects in separate Spitzer maps (Megeath et al., 2005b). Spectroscopic studies are necessary to test whether the disk fractions in the outer regions are affected by non-members.
4.6 Disk and X-ray emission
A sub-sample of 81 stars have X-ray luminosities from Franciosini et al. (2006), including 8 evolved disks, 21 optically thick disks and 52 class III stars. Figure 17 shows the cumulative distribution of class III stars and stars with optically thick disks as a function of X-ray luminosity. The significance level of 64% in a Kolmogorov-Smirnov (KS) test indicates that class III stars have similar X-ray luminosities as stars with disks. This suggests that the presence of optically thick disks have small or no influence on X-ray emission, such as might be caused by an accretion shock, in agreement with the results from Franciosini et al. (2006).
4.7 Contamination expected in the uncertain members sample
Stars selected as uncertain members are relatively faint (J13.0). From 133 stars in this sample, only 11 objects have IRAC SED slopes consistent with the presence of disks (10 thick disk + 1 evolved disks). So, the fraction of disk-bearing stars for the uncertain members (8.32.5 %) is very low compared with the fraction of disk-bearing stars expected for members with J13 in the Orionis cluster (31.34.8). Assuming that the source of non-members are class III stars and the disk-bearing stars are actual members of the cluster, we can expect that at least 84 class III stars (70 % of the uncertain member sample) do not belong to the Orionis cluster and are likely to be field M dwarfs or other sources of contaminations. Additional spectroscopic studies are essential to determine membership for this sample.
5 Conclusions
We have used the IRAC and MIPS instruments on board the Spitzer Space Telescope to study the frequencies and properties of disks around 336 members of the 3 Myr old Orionis cluster, with results for another 133 objects of uncertain membership. We confirm and strongly improve upon previous results showing that disk fractions are much lower around A-type and intermediate-mass T Tauri stars, implying that disk evolution is much more rapid for stars with masses . In particular, we find that only a few percent of all A-F stars have optically thick disks, with perhaps another % having detectable optically-thin, probable debris disks. This fraction of probable debris disk is lower that those found in the older Orion OB1b (38%) and OB1a (46%) sub-associations, suggesting that Orionis cluster could be in a phase between the clearing of the primordial disk and the formation of large icy objects, which produce the second-generation dust observed in debris disk systems (Hernandez et al., 2006). The disk frequency % we find for T Tauri stars is reasonably consistent with studies of other populations, perhaps a bit lower. We also find no evidence that the disk fraction decreases significantly among the highest-mass brown dwarfs. Overall, disk frequencies follows the overall trend of decreasing disk frequency with increasing age observed in other young stellar populations.
About 15% of the T Tauri disk systems exhibit weak IRAC excesses inconsistent with simple optically-thick disk models. If these systems are in the process of clearing small dust particles from their inner disks, the observed fraction suggests that the timescale for this evolution is Myr. We also find that the infrared excesses among optically-thick disks in Ori are systematically lower than the excesses observed from younger Taurus molecular cloud stars. This result confirms and strongly extends previous results indicating an overall decrease in the level of emission of optically-thick disks with age, which may indicate an overall settling of dust particles to the disk midplanes, or grain growth, or both. The populous nature and relatively near distance of the Orionis cluster allows us to improve the statistics of these correlations, providing an important step toward a full characterization of protoplanetary disk evolution in clustered environments, in which most stars form. Finally, we do not find correlation between X ray luminosity and the disk infrared excess, suggesting that the presence of optically thick disks have small or not influence on the X ray emission.
Appendix A Previous membership studies
The Orionis cluster has been the subject of several photometric and spectroscopic studies to identify members of its population.. Analyzing the photometric and kinematic properties of the bright population in the cluster, Kharchenko et al. (2004) determined an angular size of 0.40 degrees and identified 7 stars with photometric and kinematic membership probabilities larger than 50%. Since the cluster is reasonably close, relatively young and has low reddening, many of the previous studies have focused on identifying low mass stars and substellar objects. Adopting an age interval of 2-7 Myr and the Hipparcos distance of the star Ori (352 pc), Béjar et al. (1999, 2001, 2004) presented several lists of low mass stars, brown dwarfs and free-floating planets belonging to the Orionis cluster, selected from optical and NIR color-magnitude diagrams. Adopting an age of 2.5 Myr and the distance calculated for OB1b subassociation (440 pc), Sherry et al. (2004) reported photometric membership for a sample of low mass stars (193 objects) based on the V versus V-I color-magnitude diagram. Sherry et al. (2004) found that the cluster has 160 members in the mass range from 0.2 to 1.0 . Adopting an age of 3 Myr and a distance of 350 pc, Scholz & Eislöffel (2004) reported photometric membership for 135 candidates of very low mass stars (0.4 ) using the color magnitude diagrams, I versus I-J, and photometric variability.
Zapatero Osorio et al. (2002) presented intermediate and low resolution spectra including the H and Li I 6708Å lines and confirmed 25 low mass stars and 2 brown dwarfs as members of the cluster. Barrado y Navascués et al. (2003) confirmed 51 low mass stars and brown dwarfs as members using low resolution spectroscopic analysis of forbidden lines, as well as Li I 6708Å and H lines. Kenyon et al. (2005) presented an intermediate-resolution spectroscopic study of 76 photometrically selected stars ranging in mass from 0.04 to 0.3 ; 57 stars were confirmed as members on the basis that they exhibit Li I 6708Å in absorption, a weak Na I doublet (8183,8195 Å) indicating low surface gravity consistent with PMS status, and radial velocities expected for the kinematic properties of the cluster. Burningham et al. (2005) confirmed as members 38 low-mass stars using high-resolution spectroscopic analysis of Na I doublet. Kenyon et al. (2005) and Burningham et al. (2005) showed that optical photometric selection alone is very effective to identify low mass members belonging to the cluster, with small contamination by non-members for stars with I17 magnitudes.
Recently, Oliveira et al. (2006) compiled 59 spectroscopic confirmed members of the cluster and studied the circumstellar disks of the sample using NIR data. Franciosini et al. (2006) detect 175 X-ray sources down to the substellar limit. Half of this sample could be new members of the cluster based on the X-ray emission as indicator of youth.
References
- Andre et al. (2000) Andre, P., Ward-Thompson, D., & Barsony, M. 2000, Protostars and Planets IV, 59
- Andrews et al. (2004) Andrews, S. M., Reipurth, B., Bally, J., & Heathcote, S. R. 2004, ApJ, 606, 353
- Baltay et al. (2002) Baltay, C., et al. 2002, PASP, 114, 780
- Baraffe et al. (1998) Baraffe, I., Chabrier, G., Allard, F., & Hauschildt, P. H. 1998, A&A, 337, 403
- Barrado y Navascués et al. (2001) Barrado y Navascués, D., Zapatero Osorio, M. R., Béjar, V. J. S., Rebolo, R., Martín, E. L., Mundt, R., & Bailer-Jones, C. A. L. 2001, A&A, 377, L9
- Barrado y Navascués et al. (2003) Barrado y Navascués, D., Béjar, V. J. S., Mundt, R., Martín, E. L., Rebolo, R., Zapatero Osorio, M. R., & Bailer-Jones, C. A. L. 2003, A&A, 404, 171
- Béjar et al. (1999) Béjar, V. J. S., Zapatero Osorio, M. R. & Rebolo, R. 1999, ApJ, 521, 671
- Béjar et al. (2001) Béjar, V. J. S., et al. 2001, ApJ, 556, 830
- Béjar et al. (2004) Béjar, V. J. S., Zapatero Osorio, M. R., & Rebolo, R. 2004, Astronomische Nachrichten, 325, 705
- Bessell & Brett (1988) Bessell, M. S. & Brett, J. M. 1988, PASP, 100, 1134
- Briceño et al. (2005) Briceño, C., Calvet, N., Hernández, J., Vivas, A. K., Hartmann, L., Downes, J. J., & Berlind, P. 2005, AJ, 129, 907.
- Briceño et al. (2006) Briceño, C., Hartmann, L., Hernández, J., Calvet, N., Vivas, A. K., Furesz G., & Szentgyorgyi, A. 2006, submitted to ApJ.
- Brown et al. (1998) Brown, A. G., Walter, F. M., & Blaauw, A. 1998, in ASP Conf. Ser., The Orion Complex Revisited, ed. M.J. McCaughrean & A. Burkert
- Brown et al. (1994) Brown, A. G. A., de Geus, E. J., & de Zeeuw, P. T. 1994, A&A, 289, 101
- Burningham et al. (2005) Burningham, B., Naylor, T., Littlefair, S. P., & Jeffries, R. D. 2005, MNRAS, 356, 1583
- Caballero (2005) Caballero, J. A. 2005, Astronomische Nachrichten, 326, 1007
- Calvet et al. (2002) Calvet, N., D’Alessio, P., Hartmann, L., Wilner, D., Walsh, A., & Sitko, M. 2002, ApJ, 568, 1008
- Calvet et al. (2004) Calvet, N., Muzerolle, J., Briceño, C., Hernández, J., Hartmann, L., Saucedo, J. L., & Gordon, K. D. 2004, AJ, 128, 1294
- Calvet et al. (2005) Calvet, N., et al. 2005, ApJ, 630, L185
- Carkner et al. (1998) Carkner, L., Kozak, J. A., & Feigelson, E. D. 1998, AJ, 116, 1933
- Carpenter et al. (2006) Carpenter, J. M., Mamajek, E. E., Hillenbrand, L. A., & Meyer, M. R. 2006, ArXiv Astrophysics e-prints, arXiv:astro-ph/0609372
- Cohen & Schwartz (1976) Cohen, M., & Schwartz, R. D. 1976, MNRAS, 174, 137
- Cutri et al. (2003) Cutri, R. M., et al. 2003, VizieR Online Data Catalog, 2246, 0.
- D’Alessio et al. (1999) D’Alessio, P., Calvet, N., Hartmann, L., Lizano, S., & Cantó, J. 1999, ApJ, 527, 893
- D’Alessio et al. (2005a) D’Alessio, P., et al. 2005a, ApJ, 621, 461
- D’Alessio et al. (2005b) D’Alessio, P., Merín, B., Calvet, N., Hartmann, L., & Montesinos, B. 2005b, Revista Mexicana de Astronomia y Astrofisica, 41, 61.
- D’Alessio et al. (2006) D’Alessio, P., Calvet, N., Hartmann, L., Franco-Hernández, R., & Servín, H. 2006, ApJ, 638, 314
- Dullemond & Dominik (2004) Dullemond, C. P. & Dominik, C. 2004, A&A, 417, 159
- Dullemond & Dominik (2005) Dullemond, C. P., & Dominik, C. 2005, A&A, 434, 971
- Eisner & Carpenter (2003) Eisner, J. A., & Carpenter, J. M. 2003, ApJ, 598, 1341
- Engelbracht et al. (2006) Engelbracht, C. W., et al. 2006, in preparation.
- Fazio et al. (2004) Fazio, G. G., et al. 2004, ApJS, 154, 39
- Franciosini et al. (2006) Franciosini, E., Pallavicini, R., & Sanz-Forcada, J. 2006, A&A, 446, 501
- Furlan et al. (2006) Furlan, E., et al. 2006, ApJS, 165, 568
- Guetter (1981) Guetter, H. H. 1981, AJ, 86, 1057
- Gómez & Kenyon (2001) Gómez, M., & Kenyon, S. J. 2001, AJ, 121, 974
- Gordon et al. (2005) Gordon, K. D., et al. 2005, PASP, 117, 503
- Gorlova et al. (2004) Gorlova, N., et al. 2004, ApJS, 154, 448
- Gregorio-Hetem & Hetem (2002) Gregorio-Hetem, J., & Hetem, A. 2002, MNRAS, 336, 197
- Gutermuth et al. (2006) Gutermuth, R. et al., 2006, in prep.
- Gutermuth et al. (2004) Gutermuth, R. A., Megeath, S. T., Muzerolle, J., Allen, L. E., Pipher, J. L., Myers, P. C., & Fazio, G. G. 2004, ApJS, 154, 374
- Haisch et al. (2001) Haisch, K. E., Lada, E. A., & Lada, C. J. 2001, ApJ, 553, L153
- Hartmann (2005a) Hartmann, L. 2005a, ASP Conf. Ser. 337: The Nature and Evolution of Disks Around Hot Stars, 337, 3
- Hartmann (2005b) Hartmann, L. 2005b, ASP Conf. Ser. 341: Chondrites and the Protoplanetary Disk, 341, 131
- Hartmann et al. (2005c) Hartmann, L., Megeath, S. T., Allen, L., Luhman, K., Calvet, N., D’Alessio, P., Franco-Hernandez, R., & Fazio, G. 2005c, ApJ, 629, 881
- Herbst & Shevchenko (1999) Herbst, W., & Shevchenko, V. S. 1999, AJ, 118, 1043
- Hernández et al. (2004) Hernández, J., Calvet, N., Briceño, C., Hartmann, L., & Berlind, P. 2004, AJ, 127, 1682
- Hernández et al. (2005) Hernández, J., Calvet, N., Hartmann, L., Briceño, C., Sicilia-Aguilar, A., & Berlind, P. 2005, AJ, 129, 856.
- Hernandez et al. (2006) Hernandez, J., Briceño, C., Calvet, N., Hartmann, L., Muzerolle, J., & Quintero, A. 2006, accepted in Astrophysical Journal.
- Hillenbrand et al. (2006) Hillenbrand, L., Carpenter, J., & Meyer, M., 2006, in preparation.
- Jeffries et al. (2006) Jeffries, R. D., Maxted, P. F. L., Oliveira, J. M., & Naylor, T. 2006, MNRAS, L62
- Kenyon et al. (2005) Kenyon, M. J., Jeffries, R. D., Naylor, T., Oliveira, J. M., & Maxted, P. F. L. 2005, MNRAS, 356, 89
- Kenyon & Hartmann (1995) Kenyon, S. J. & Hartmann, L. 1995, ApJS, 101, 117
- Kenyon & Hartmann (1987) Kenyon, S. J., & Hartmann, L. 1987, ApJ, 323, 714
- Kharchenko (2001) Kharchenko, N. V. 2001, Kinematika i Fizika Nebesnykh Tel, 17, 409.
- Kharchenko et al. (2004) Kharchenko, N. V., Piskunov, A. E., Röser, S., Schilbach, E., & Scholz, R.-D. 2004, Astronomische Nachrichten, 325, 740.
- Lada & Lada (1995) Lada, E. A., & Lada, C. J. 1995, AJ, 109, 1682
- Lada et al. (2006) Lada, C. J., et al. 2006, AJ, 131, 1574
- Landsman (1993) Landsman, W. B. 1993, ASP Conf. Ser. 52: Astronomical Data Analysis Software and Systems II, 52, 246
- Levine et al. (2006) Levine, J. L., Steinhauer, A., Elston, R. J., & Lada, E. A. 2006, ApJ, 646, 1215
- Lyra et al. (2006) Lyra, W., Moitinho, A., van der Bliek, N. S., & Alves, J. 2006, A&A, 453, 101
- Megeath et al. (2005a) Megeath, S. T., Hartmann, L., Luhman, K. L., & Fazio, G. G. 2005a, ApJ, 634, L113
- Megeath et al. (2005b) Megeath, S. T., et al. 2005b, Massive star birth: A crossroads of Astrophysics, IAU Symposium Proceedings of the international Astronomical Union 227, Held 16-20 May, Italy, edited by Cesaroni, R.; Felli, M.; Churchwell, E.; Walmsley, M. Cambridge: Cambridge University Press, pp.383-388.
- Muzerolle et al. (2003) Muzerolle, J., Hillenbrand, L., Calvet, N., Briceño, C., & Hartmann, L. 2003, ApJ, 592, 266
- Oliveira et al. (2006) Oliveira, J. M., Jeffries, R. D., van Loon, J. T., & Rushton, M. T. 2006, MNRAS, 369, 272
- Oliveira & van Loon (2004) Oliveira, J. M., & van Loon, J. T. 2004, A&A, 418, 663
- Oliveira et al. (2002) Oliveira, J. M., Jeffries, R. D., Kenyon, M. J., Thompson, S. A., & Naylor, T. 2002, A&A, 382, L22
- Preibisch & Feigelson (2005) Preibisch, T., & Feigelson, E. D. 2005, ApJS, 160, 390
- Reach et al. (2006) Reach, W. et al. 2006, Infrared Array Camera Data Handbook, version 3.0, Spitzer Science Center, California Institute of Technology, Pasadena, California 91125 USA.
- Rieke et al. (2004) Rieke, G. H., et al, 2004, ApJS, 154, 25
- Rieke et al. (2005) Rieke, G. H., et al. 2005, ApJ, 620, 1010
- Scholz & Eislöffel (2004) Scholz, A., & Eislöffel, J. 2004, A&A, 419, 249
- Sherry et al. (2004) Sherry, W. H., Walter, F. M., & Wolk, S. J. 2004, AJ, 128, 2316
- Schlegel et al. (1998) Schlegel, D. J., Finkbeiner, D. P., & Davis, M. 1998, ApJ, 500, 525
- Sicilia-Aguilar et al. (2005) Sicilia-Aguilar, A., Hartmann, L. W., Hernández, J., Briceño, C., & Calvet, N. 2005, AJ, 130, 188
- Sicilia-Aguilar et al. (2006) Sicilia-Aguilar, A., et al. 2006, ApJ, 638, 897
- Siess et al. (2000) Siess, L., Dufour, E., & Forestini, M. 2000, A&A, 358, 593
- Stern et al. (2005) Stern, D., et al. 2005, ApJ, 631, 163
- Vivas et al. (2004) Vivas, A. K., et al. 2004, AJ, 127, 1158
- Walter et al. (1997) Walter, F. M., Wolk, S. J., Freyberg, M., & Schmitt, J. H. M. M. 1997, Memorie della Societa Astronomica Italiana, 68, 1081
- Walter et al. (1998) Walter, F. M., Wolk, S. J., & Sherry, W. 1998, ASP Conf. Ser. 154: Cool Stars, Stellar Systems, and the Sun, 154, 1793
- Warren & Hesser (1978) Warren, W. H., Jr., & Hesser, J. E. 1978, ApJS, 36, 497
- Ward-Thompson et al. (2005) Ward-Thompson, D., Hartmann, L., & Nutter, D. J. 2005, MNRAS, 357, 687
- Weaver & Babcock (2004) Weaver, W. B., & Babcock, A. 2004, PASP, 116, 1035
- Weidenschilling (1997) Weidenschilling, S. J. 1997, Icarus, 127, 290
- Wu et al. (2005) Wu, H., Cao, C., Hao, C.-N., Liu, F.-S., Wang, J.-L., Xia, X.-Y., Deng, Z.-G., & Young, C. K.-S. 2005, ApJ, 632, L79
- Zapatero Osorio et al. (2002) Zapatero Osorio, M. R., Béjar, V. J. S., Pavlenko, Y., Rebolo, R., Allende Prieto, C., Martín, E. L., & García López, R. J. 2002, A&A, 384, 937
| SO | RA(2000) | DEC(2000) | [3.6] | [4.5] | [5.8] | [8.0] | [24.0] | V | Ref | Var | X-ray | Disk | Known |
|---|---|---|---|---|---|---|---|---|---|---|---|---|---|
| ID | deg | deg | mag | mag | mag | mag | mag | mag | source | type | member | ||
| 9 | 84.32781 | -2.67275 | 10.99 0.03 | 10.97 0.03 | 10.80 0.03 | 10.92 0.03 | 15.40 0.05 | q | 0 | III | 9 | ||
| 27 | 84.34599 | -2.54623 | 13.00 0.03 | 12.94 0.03 | 12.86 0.04 | 12.99 0.05 | 18.42 0.02 | 9 | III | ||||
| 41 | 84.35401 | -2.86730 | 10.30 0.03 | 10.31 0.03 | 10.28 0.03 | 10.25 0.03 | III | ||||||
| 52 | 84.36209 | -2.36497 | 10.54 0.03 | 10.56 0.03 | 10.50 0.03 | 10.49 0.03 | 13.77 0.08 | q | 0 | III | |||
| 59 | 84.36683 | -2.60175 | 12.65 0.03 | 12.62 0.03 | 12.51 0.04 | 12.52 0.04 | 17.64 0.05 | q | 0 | III | |||
| 60 | 84.36792 | -2.40508 | 12.87 0.03 | 12.82 0.03 | 12.82 0.04 | 12.80 0.05 | 18.08 0.11 | q | 0 | III | 9 | ||
| 73 | 84.37888 | -2.39521 | 10.90 0.03 | 10.44 0.03 | 10.04 0.03 | 9.11 0.03 | 5.64 0.03 | 16.28 0.10 | q | 1 | II | 9 | |
| 74 | 84.37941 | -2.52922 | 9.46 0.03 | 9.39 0.03 | 9.30 0.03 | 9.32 0.03 | 9.19 0.04 | III | |||||
| 77 | 84.38132 | -2.40748 | 10.99 0.03 | 10.98 0.03 | 10.93 0.03 | 10.93 0.03 | 15.83 0.11 | q | 1 | III | 9 | ||
| 82 | 84.38269 | -2.75514 | 9.24 0.03 | 9.21 0.03 | 9.16 0.03 | 9.20 0.03 | 8.95 0.04 | 9.42 0.02 | III | ||||
| 92 | 84.38811 | -2.89332 | 10.59 0.03 | 10.74 0.03 | 10.64 0.03 | 10.55 0.03 | 14.99 0.04 | q | 0 | III | 9 | ||
| 115 | 84.40181 | -2.24377 | 10.74 0.03 | 10.72 0.03 | 10.67 0.03 | 10.70 0.03 | 15.49 0.10 | q | 0 | III | 9 | ||
| 116 | 84.40192 | -2.69906 | 14.19 0.03 | 14.02 0.03 | 13.98 0.06 | 13.97 0.09 | III | 1,2,3,6 | |||||
| 117 | 84.40270 | -2.56669 | 11.82 0.03 | 11.83 0.03 | 11.81 0.03 | 11.76 0.04 | 17.12 0.05 | q | 0 | III | 9 | ||
| 123 | 84.40760 | -2.76226 | 11.51 0.03 | 11.47 0.03 | 11.40 0.03 | 11.44 0.03 | 16.37 0.05 | q | 1 | III | 9 | ||
| 124 | 84.40766 | -2.83598 | 9.49 0.03 | 9.54 0.03 | 9.45 0.03 | 9.44 0.03 | 9.65 0.05 | III | |||||
| 147 | 84.42406 | -2.48557 | 9.51 0.03 | 9.50 0.03 | 9.47 0.03 | 9.53 0.03 | 9.59 0.04 | 10.90 0.07 | 7 | III | |||
| 164 | 84.43706 | -2.49920 | 9.91 0.03 | 9.90 0.03 | 9.91 0.03 | 9.89 0.03 | 9.80 0.05 | 10.95 0.09 | 7 | III | |||
| 165 | 84.43856 | -2.48111 | 12.65 0.03 | 12.58 0.03 | 12.55 0.04 | 12.49 0.04 | 18.76 0.13 | 9 | III | 9 | |||
| 168 | 84.43889 | -2.73678 | 8.96 0.03 | 9.02 0.03 | 8.95 0.03 | 8.95 0.03 | 8.94 0.04 | 10.66 0.07 | 7 | III | |||
| 194 | 84.45671 | -2.60506 | 10.12 0.03 | 10.17 0.03 | 10.06 0.03 | 10.10 0.03 | 10.03 0.06 | III | |||||
| 209 | 84.46288 | -2.43542 | 13.64 0.03 | 13.53 0.03 | 13.68 0.05 | 13.38 0.07 | III | 2,3 | |||||
| 214 | 84.46497 | -2.59045 | 10.81 0.03 | 10.80 0.03 | 10.79 0.03 | 10.72 0.03 | 15.64 0.01 | 9 | 1 | III | 8,9 | ||
| 219 | 84.46685 | -2.60126 | 13.92 0.03 | 13.81 0.03 | 13.73 0.05 | 13.70 0.07 | 0 | III | 6 | ||||
| 220 | 84.46747 | -2.56052 | 11.85 0.03 | 11.85 0.03 | 11.78 0.03 | 11.77 0.04 | 16.89 0.03 | 9 | 0 | III | 9,12 | ||
| 229 | 84.47091 | -2.55951 | 9.45 0.03 | 9.46 0.03 | 9.43 0.03 | 9.42 0.03 | 9.40 0.04 | 1 | III | ||||
| 240 | 84.47515 | -2.74462 | 11.92 0.03 | 11.88 0.03 | 11.86 0.03 | 11.82 0.03 | 17.02 0.05 | q | 0 | III | 8,9 | ||
| 243 | 84.47665 | -2.65823 | 8.51 0.03 | 8.68 0.03 | 8.55 0.03 | 8.51 0.03 | 8.47 0.03 | 10.91 0.07 | 7 | 1 | III | 7 | |
| 244 | 84.47683 | -2.72711 | 8.99 0.03 | 9.06 0.03 | 8.98 0.03 | 8.96 0.03 | 8.98 0.04 | III | |||||
| 247 | 84.47852 | -2.68587 | 12.04 0.03 | 11.80 0.03 | 11.45 0.03 | 10.82 0.03 | 8.41 0.03 | 18.55 0.06 | q | 0 | 0 | II | 5,9 |
| 251 | 84.47960 | -2.46006 | 12.45 0.03 | 12.36 0.03 | 12.30 0.04 | 12.46 0.04 | 18.49 0.10 | 9 | III | 9 | |||
| 254 | 84.48156 | -2.55146 | 13.66 0.03 | 13.35 0.03 | 12.94 0.04 | 12.32 0.04 | 9.70 0.05 | 0 | II | 2,3,12 | |||
| 256 | 84.48218 | -2.40933 | 13.79 0.03 | 13.74 0.03 | 13.56 0.06 | 13.77 0.10 | III | 2,3 | |||||
| 260 | 84.48530 | -2.73263 | 11.91 0.03 | 11.96 0.03 | 11.85 0.03 | 11.86 0.03 | 16.84 0.05 | q | 0 | III | 9 | ||
| 271 | 84.48935 | -2.64562 | 12.92 0.03 | 12.76 0.03 | 12.58 0.04 | 12.03 0.04 | 9.40 0.04 | 0 | II | 1,2,3,6,8,12 | |||
| 275 | 84.49076 | -2.91668 | 11.62 0.03 | 11.62 0.03 | 11.60 0.03 | 11.55 0.03 | 14.86 0.04 | q | 1 | III | |||
| 283 | 84.49328 | -2.69059 | 12.06 0.03 | 11.96 0.03 | 11.90 0.03 | 11.96 0.04 | 18.92 0.07 | q | 0 | 0 | III | 6,9,12 | |
| 293 | 84.49872 | -2.85090 | 9.61 0.03 | 9.70 0.03 | 9.62 0.03 | 9.59 0.03 | 9.67 0.04 | III | |||||
| 297 | 84.50228 | -2.75267 | 11.56 0.03 | 11.47 0.03 | 11.47 0.03 | 11.43 0.03 | 17.75 0.06 | q | 0 | 1 | III | 9,12 | |
| 299 | 84.50394 | -2.43548 | 11.68 0.03 | 11.76 0.03 | 11.66 0.03 | 11.33 0.03 | 6.76 0.03 | 16.70 0.11 | q | 1 | TD2 | 9 | |
| 300 | 84.50434 | -2.76042 | 10.12 0.03 | 9.70 0.03 | 9.29 0.03 | 8.64 0.03 | 5.87 0.03 | 17.59 0.07 | q | 1 | II | 9 |
Note. — Table 1 is published in its entirety in the electronic edition of the Astrophysical Journal. A portion is shown here for guidance regarding its form and content.
| SO | RA(2000) | DEC(2000) | [3.6] | [4.5] | [5.8] | [8.0] | [24.0] | Disk |
|---|---|---|---|---|---|---|---|---|
| ID | deg | deg | mag | mag | mag | mag | mag | type |
| 33 | 84.34808 | -2.74109 | 14.49 0.03 | 14.46 0.04 | 14.42 0.07 | 14.44 0.15 | III | |
| 47 | 84.35836 | -2.34652 | 13.53 0.03 | 13.55 0.03 | 13.47 0.05 | 13.80 0.11 | III | |
| 57 | 84.36604 | -2.51190 | 13.45 0.03 | 13.45 0.03 | 13.33 0.04 | 13.52 0.08 | III | |
| 71 | 84.37812 | -2.40533 | 14.45 0.03 | 14.48 0.04 | 14.51 0.11 | 14.21 0.13 | III | |
| 81 | 84.38234 | -2.40128 | 14.36 0.03 | 14.27 0.04 | 14.19 0.07 | 14.13 0.14 | III | |
| 87 | 84.38534 | -2.75422 | 13.67 0.03 | 13.70 0.04 | 13.86 0.08 | 13.96 0.15 | III | |
| 107 | 84.39636 | -2.44933 | 12.10 0.03 | 12.01 0.03 | 11.91 0.03 | 11.94 0.03 | III | |
| 120 | 84.40674 | -2.42888 | 13.48 0.03 | 13.49 0.03 | 13.35 0.05 | 13.30 0.09 | 9.95 0.05 | TD1 |
| 219 | 84.46685 | -2.60126 | 13.92 0.03 | 13.81 0.03 | 13.73 0.05 | 13.70 0.07 | III6 | |
| 127 | 84.40806 | -2.80576 | 12.78 0.03 | 12.82 0.03 | 12.80 0.04 | 12.73 0.04 | III | |
| 134 | 84.41515 | -2.30742 | 14.14 0.03 | 13.93 0.03 | 13.87 0.06 | 13.74 0.08 | III | |
| 154 | 84.43077 | -2.44282 | 14.48 0.03 | 14.45 0.04 | 14.35 0.08 | 14.15 0.09 | III | |
| 174 | 84.44174 | -2.45832 | 13.71 0.03 | 13.63 0.03 | 13.61 0.05 | 13.53 0.08 | III | |
| 188 | 84.45503 | -2.36186 | 14.14 0.03 | 14.17 0.04 | 13.94 0.06 | 14.06 0.13 | III | |
| 207 | 84.46257 | -2.32070 | 14.13 0.03 | 14.18 0.03 | 14.14 0.07 | 14.20 0.11 | III | |
| 221 | 84.46809 | -2.44730 | 14.24 0.03 | 14.22 0.03 | 14.29 0.07 | 14.10 0.12 | III | |
| 236 | 84.47451 | -2.48824 | 14.48 0.03 | 14.46 0.04 | 14.07 0.07 | 14.13 0.13 | III |
Note. — Table 2 is published in its entirety in the electronic edition of the Astrophysical Journal. A portion is shown here for guidance regarding its form and content.
| Wavelength | Median | Upper | Lower | stars |
|---|---|---|---|---|
| µm | log | used | ||
| 0.44 | -1.506 | -1.254 | -1.654 | 22 |
| 0.55 | -1.002 | -0.842 | -1.274 | 51 |
| 0.64 | -0.738 | -0.588 | -0.928 | 60 |
| 0.79 | -0.308 | -0.220 | -0.376 | 52 |
| 1.24 | 0.0 | 0.0 | 0.0 | 64 |
| 1.66 | -0.037 | -0.005 | -0.065 | 64 |
| 2.16 | -0.209 | -0.125 | -0.245 | 64 |
| 3.6 | -0.563 | -0.400 | -0.645 | 64 |
| 4.5 | -0.733 | -0.580 | -0.836 | 64 |
| 5.8 | -0.910 | -0.748 | -0.978 | 64 |
| 8.0 | -0.962 | -0.804 | -1.076 | 64 |
| 24 | -1.238 | -1.029 | -1.430 | 58 |
| Wavelength | Median | Upper | Lower | stars |
|---|---|---|---|---|
| µm | log | used | ||
| 0.44 | -1.360 | -1.206 | -1.550 | 60 |
| 0.55 | -0.863 | -0.610 | -1.166 | 116 |
| 0.64 | -0.597 | -0.400 | -0.870 | 128 |
| 0.79 | -0.204 | -0.144 | -0.324 | 97 |
| 1.235 | 0 | 0 | 0 | 137 |
| 1.662 | -0.057 | -0.037 | -0.073 | 137 |
| 2.159 | -0.257 | -0.241 | -0.273 | 137 |
| 3.6 | -0.748 | -0.733 | -0.777 | 137 |
| 4.5 | -1.038 | -1.007 | -1.083 | 137 |
| 5.8 | -1.306 | -1.278 | -1.348 | 137 |
| 8.0 | -1.693 | -1.660 | -1.723 | 137 |
| 24 | -3.259 | -3.198 | -3.431 | 421 |
| Range | Thick Disks | Thick+Evolved Disks |
|---|---|---|
| % | % | |
| HAeBe | 3.73.7 | 14.87.4 |
| IMTTS | 19.65.9 | 26.86.9 |
| TTS | 31.13.8 | 36.34.1 |
| BDwarfs | 29.79.0 | 33.39.7 |
| Total | 26.62.8 | 33.93.1 |


.