The Millennium Galaxy Catalogue: Science highlights
Abstract
The Millennium Galaxy Catalogue (MGC) provides a structural database comprising 10,095 well resolved galaxies drawn from a 37.5 sq. deg region of sky, with mag and 96.1 per cent spectroscopic completeness. The data are being used to investigate a number of diverse topics including: the nearby galaxy merger rate (via close pairs and asymmetry); dust attenuation; bulge and disc luminosity functions; the luminosity size relations; the supermassive black hole mass function; galaxy bimodality; the space-density of high and low surface brightness galaxies; blue spheroids; and the total -band luminosity function. Plans to extend the MGC in area (200 sq. deg), depth ( mag), resolution (0.5′′) and wavelength are underway.
1. Introduction
The Millennium Galaxy Catalogue (MGC; Liske et al. 2003) originated with a major award of time with the Wide Field Camera at the Isaac Newton Telescope. Over a period of three annual cycles (1999-2001) an equatorial strip 75 deg long by 0.5 deg wide was observed via sequential 12.5 min -band exposures with large overlap regions suitable for bootstrap calibration. All data were reduced through the Cambridge Survey Unit Pipeline. Basic photometry was performed using SExtractor and calibrated as described in Liske et al. (2003) providing photometric and astrometric accuracies of mag and respectively. The catalogue contains over one million galaxies with 10,095 brighter than mag over an effective useable area of 30.88 sq. deg, defining mgc-bright. All detections were verified by eye and corrected where necessary. The MGC overlaps with the 2dFGRS NGP (Colless et al. 2001) and the SDSS Early Data Release region (Stoughton et al. 2002) providing redshifts for almost half of mgc-bright, the remainder were obtained over the subsequent three years (2001-2004, see Driver et al. 2005) via (predominantly) general user 2dF time at the AAT, supplemented with additional time at the ANU 2.3m, and the NTT, Gemini and TNG telescopes to pursue very high and very low surface brightness systems. Most recently we have completed 2D Sérsic and Sérsic bulge plus exponential disc profiling of all 10,095 galaxies (see Allen et al. 2006) with GIM2D (Simard et al. 2003). All data products were publicly released at the IAU General Assembly in Prague and are available via our website: http://www.eso.org/jliske/mgc.
2. Science highlights
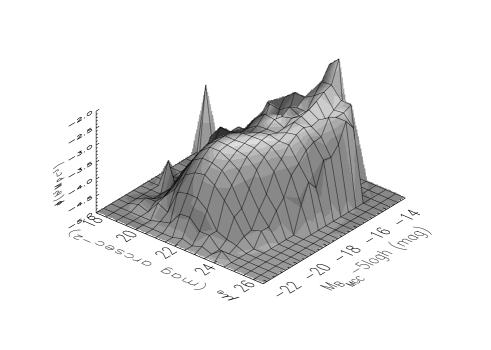
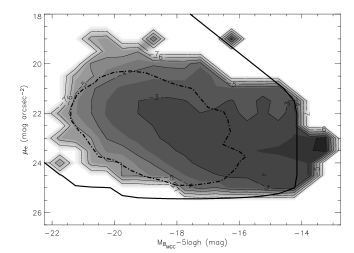
2.1. The bivariate brightness distribution (-plane)
In Driver et al. (2005) we derive the space-density of galaxies as a function of magnitude and mean effective surface brightness (the so called bivariate brightness distribution). Our 2D variant of step-wise maximum likelihood enables us to compensate for the different volumes over which galaxies of similar luminosity but distinct surface brightnesses can be seen, as well as define the MGC selection boundary. The distribution (see Fig. 1) shows the strong luminosity-surface brightness relation but more importantly that; (i) galaxies near () are well defined by a Gaussian distribution in surface brightness which is unimpeded by the selection boundary, and (ii) that faintward of mag the surface brightness and size selection boundaries start to severely hinder our ability to sample the dwarf population, causing a loss of % of the dwarfs at the high surface brightness end alone (see Liske et al. 2006). The conclusion is that while the bright-end of the galaxy luminosity function is well defined, the dwarf regime is poorly constrained and warrants further investigation via a deeper survey (both in terms of flux limit, spatial resolution and spectroscopic follow up limit).
2.2. Galaxy bimodality in colour and structure
In Driver et al. (2006) we identified a remarkably strong bimodal distribution in the colour and structure plane (see Fig. 2). Subdividing by morphological type we found that ellipticals/lenticulars (bulge-dominated systems) lie in the red compact peak, late-types (disc only systems) lie in the blue diffuse peak, and mid-type spirals (bulge plus disc systems) straddle the two peaks with no obvious bimodality. We interpreted this to imply that galaxy bimodality is a fundamental reflection of the two-component nature of galaxies (i.e., combinations of spheroids and discs and not two distinct galaxy types). This in turn implies that galaxies may form via a two stage process: spheroids form early via a dissipational collapse/rapid merger phase (suggested by their colours and concentrated 3D structure), and galaxian discs grow more slowly via splashback (dissipationless collapse), infall and/or accretion (suggested by their colours and more fragile 2D structure). In Driver et al. (2007, in prep but see Driver, Liske & Graham 2006) we confirm, via our bulge plus disc structural decompositions of the mid-type spirals, that the two-component interpretation appears to hold, with the bulges and discs of mid-type spirals lying in distinct non-overlapping peaks in the colour-structure plane. The current dominant semi-quiescent phase is also suggested by our relatively low merger rate found from the MGC data by both dynamically close pairs (De Propris et al. 2005) and asymmetry indicators (De Propris et al. 2007).

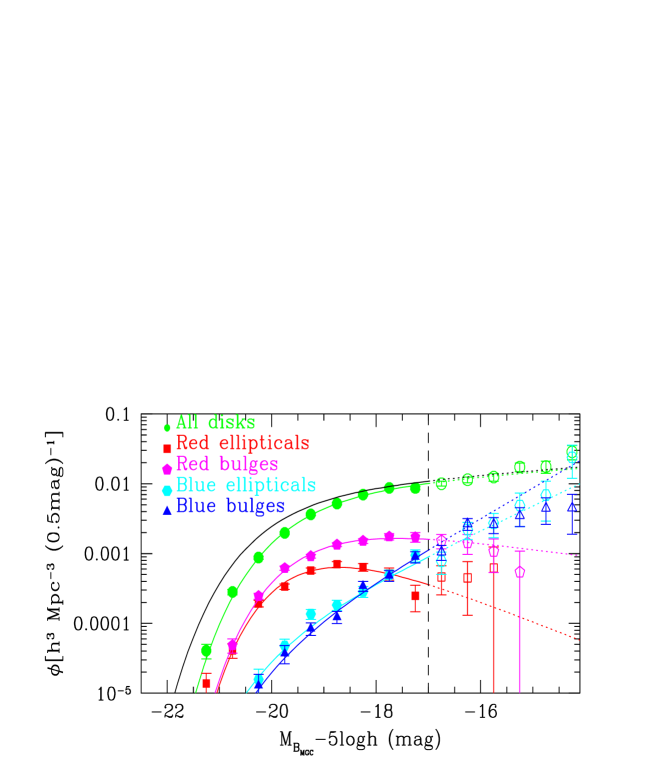
2.3. The luminosity function of bulges and discs etc.
In Driver et al. (2007a) we derive the luminosity function of discs, red ellipticals, classical bulges, blue ellipticals and pseudo-bulges (see Fig. 3). We derive their luminosity densities and stellar mass densities and find the following breakdown in terms of the stellar mass of 58:13:26:1.5:1.5 (%) respectively. Adopting the two-mode model for galaxy formation (rapid bulge assembly followed by semi-quiescent disc formation) this implies that the later disc-mode is responsible for the bulk of stars visible today (i.e., %).
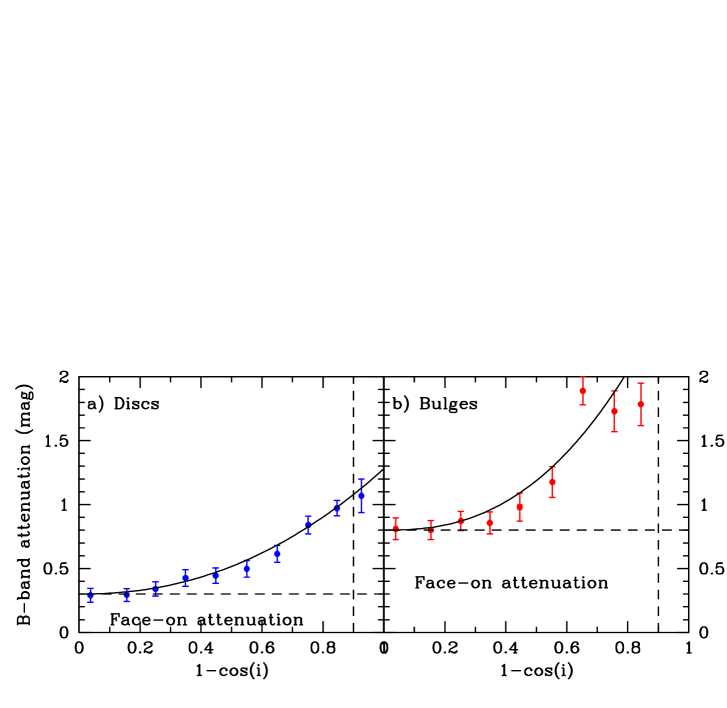
2.4. Dust attenuation of bulges and discs
In Driver et al. (2007b) we derive the bulge and disc luminosity functions in intervals of inclination and find a strong dependency of the characteristic turnover luminosity with disc inclination. We interpret this as due to dust and find our data agree well with the predictions of Tuffs et al. (2004). Using the Tuffs et al. models we constrain the mean face-on opacity of discs and derive a face-on attenuation of 0.2 mag for galaxy discs and 0.84 mag for galaxy bulges. Together the total galaxy attenuation is dramatic (see Fig. 4) implying that only 50% of the -band photons produced by stars emerge from the nearby galaxy population with the remainder absorbed by dust grains in the ISM. This has dramatic implications for the -band luminosity density and derived -band galaxy luminosity functions, and also affects stellar masses based on optical colours.
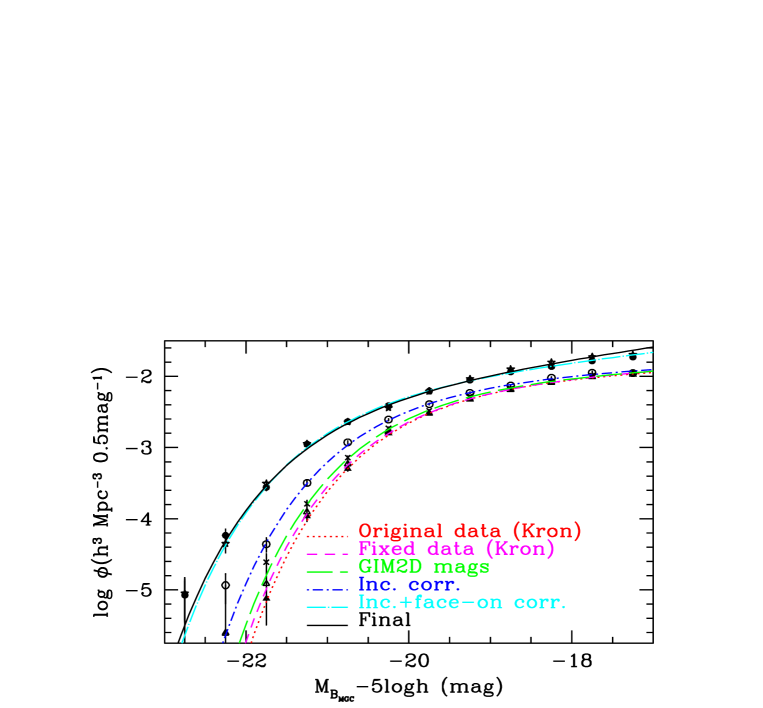
2.5. The -band luminosity function corrected for dust attenuation
In Driver et al. (2007, in prep.) we rederive the -band galaxy luminosity function(s) incorporating our dust attenuation correction (as well as upgrade our photometry from Kron to gim2d magnitudes) and apply individual and corrections for the bulge and disc components (see Fig. 5). We find that the -band galaxy luminosity function turnover moves brightwards by 1.0 mag when dust is correctly taken into account. Returning to the component stellar mass contributions we now find that the stellar mass locked up in bulges is significantly higher and revise our earlier values to: 58:10:29:1.5:1.5 (see §2.3).
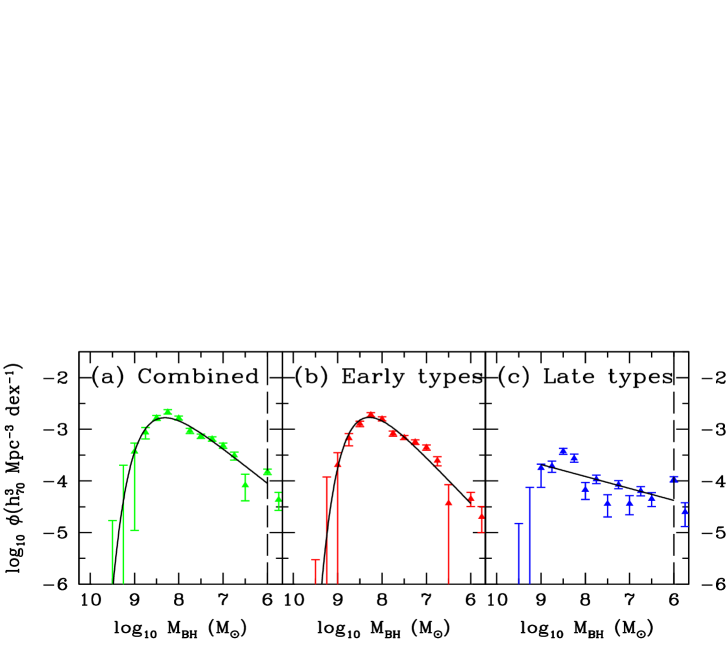
2.6. Supermassive black holes
Graham & Driver (2007) provide an updated – relation (akin to the – relation, see Novak, Faber & Dekel 2006) which can be used for predicting accurate supermassive black hole masses in other galaxies. Using the measured (spheroid) Sérsic indices drawn from the 10k galaxies in the MGC, we provide a new estimate of the local supermassive black hole mass function (Graham et al. 2007; see Fig. 6). The observational simplicity of our approach, and the direct measurements of the black hole predictor quantity, i.e. the Sérsic index, for both elliptical galaxies and the bulges of disc galaxies makes it straightforward to estimate accurate black hole masses in early- and late-type galaxies alike. Moreover, the – relation has a total absolute scatter of only 0.31 dex.
3. Summary
The MGC is a relatively modest project but is now starting to produce some fairly unique science. In cosmological terms the survey is currently too small to place constraints on cosmological parameters but we can investigate the breakdown of the cosmic baryon budget today. From the MGC we are finding that % of the baryons produced in the Big Bang are currently in stars, per cent are in interstellar dust grains, and % are locked up in supermassive black holes. Plans are afoot to now expand the MGC by ingesting the UKIRT/UKIDSS, VST KIDS and VISTA VIKING data along with extended spectroscopic coverage with AAOmega at the AAT and supporting GALEX and Spitzer observations. The extended survey (GAMA), will provide a gain in sky coverage, gain in spatial resolution, mag increase in spectroscopic follow-up, and gain in wavelength coverage and should provide the ultimate post-SDSS structural and spectroscopic galaxy resource for multipurpose galaxy studies. One key objective will be to explore CDM on 1 Mpc to 1 kpc scales where the interplay between CDM and baryon physics becomes crucial.
References
- Allen et al. (2006) Allen P.D., Driver S.P., Graham A.W., Cameron E., Liske J., De Propris R., 2006, MNRAS, 371, 2
- Colless et al. (2001) Colless M.C., et al., 2001, MNRAS, 328, 1039
- De Propris et al. (2005) De Propris R., Liske J., Driver S.P., Allen P.D., Cross N.J.G., 2005, AJ, 130, 1516
- De Propris et al. (2007) De Propris R., Conselice C.J., Liske J., Driver S.P., Patton D.R., Graham A.W., Allen P.D., 2007, AJ, submitted
- Driver et al. (2005) Driver S.P., Liske J., Cross N.J.G., De Propris R., P.D. Allen, 2005, MNRAS, 360, 81
- Driver et al. (2006) Driver S.P., et al., 2006, MNRAS, 368, 414
- Driver et al. (2007a) Driver S.P., Allen P.D., Liske J., Graham A.W., 2007a, ApJL, submitted
- Driver et al. (2006) Driver S.P., Liske J., Graham A.W., 2006, in IAU Symp. 235, (astro-ph/0610752)
- Driver et al. (2007b) Driver S.P., Popescu C.C., Tuffs R.J., Graham A.W., Liske J., Allen P.D., De Propris R., 2007b, MNRAS, submitted
- Graham & Driver (2005) Graham A.W., Driver S.P., 2005, PASA, 22, 118
- Graham & Driver (2007) Graham A.W., Driver S.P., 2007, ApJ, in press, (astro-ph/0607378)
- Graham et al. (2007) Graham A.W., Driver S.P., Allen P.D., Liske J., 2007, MNRAS, submitted
- Liske et al. (2003) Liske J., Lemon D.J., Driver S.P., Cross N.J.G., Couch W.J., 2003, MNRAS, 344, 307
- Liske et al. (2006) Liske J., Driver S.P., Allen P.D., Cross N.J.G., De Propris R., 2006, MNRAS, 369, 1547
- Novak et al. (2006) Novak G.S., Faber S.M., Dekel A., 2006, ApJ, 637, 96
- Simard et al. (2003) Simard L., et al., 2002, ApJS, 142, 1
- Stoughton et al. (2002) Stoughton C., et al., 2002, AJ, 123, 485
- Tuffs et al. (2004) Tuffs R.J., Popescu C.C., Völk H.J., Kylafis N.D., Dopita M.A., 2004, A&A, 419, 835