A Radio through X-ray Study of the Hot Spots, Active Nucleus, and Environment of the Nearby FR II Radio Galaxy 3C 33
Abstract
We present results from Chandra/ACIS-S, Spitzer, XMM-Newton, HST, and VLA observations of the radio hot spots, extended environment, and nucleus of the nearby (=0.0597) FR II radio galaxy 3C 33. This is a relatively low-power FR II radio galaxy, and so we expect, a priori, to detect a significant X-ray synchrotron component to the emission from the hot spots. We detect X-ray emission coincident with the two knots of polarized optical emission from the southern hot spot (SHS), as well as along the northwest arm of this hot spot. We also detect X-ray emission from two compact regions of the northern hot spot (NHS), as well as diffuse emission behind the radio peak. The X-ray flux density of the region at the tip of the southern hot spot, the most compact radio feature of the southern lobe, is consistent with the synchrotron self-Compton (SSC) process. The X-ray flux densities of the other three regions of the SHS and the two compact regions of the NHS are an order of magnitude or more above the predictions from either the SSC and inverse-Compton scattering of the CMB (IC/CMB) mechanisms, thus strongly disfavoring these scenarios unless they are far from equipartition ( 4-14 times smaller than the equipartition values). The X-ray flux from the diffuse region behind the NHS is consistent with the IC/CMB prediction assuming a small departure from equipartition. However, the radio to X-ray flux density distributions of the three regions of the SHS cannot be fitted with a fully convex, monotonically decreasing spectral model as a function of frequency. We conclude that the X-ray emission is synchrotron emission from multiple populations of ultrarelativistic electrons unless these regions are far from equipartition. There must therefore be complex, unresolved substructure within each knot, similar to that which is found in Chandra observations of nearby FR I jets such as Centaurus A and 3C 66B to explain the flux density distributions. The nuclear spectrum consists of a heavily absorbed (41023 cm-2) power law with a bright Fe Kα line (200 eV) and an Fe K edge, thermal emission from galactic gas, and an additional component that could either be reflection from the torus or a second power law representing emission from an unresolved pc scale jet. The detection of X-ray emission from both hot spots combined with the large absorbing column toward the primary power-law component of the nucleus conclusively demonstrate that the jets must lie relatively close to the plane of the sky and that relativistic beaming cannot be important. We also detect diffuse X-ray emission, some of which is likely to originate in hot galaxy or group-scale gas, and some of which may be attributed to IC/CMB off the relativistic electrons of the radio lobes.
1 Introduction
The origin of X-ray emission from the radio hot spots of FR II radio galaxies is still a subject of considerable debate. For many sources, inverse-Compton scattering of radio photons by the relativistic electrons of the hot spot (the synchrotron self-Compton mechanism (SSC)) with the magnetic field at or near the equipartition value provides an adequate description of the broad band (radio to X-ray) spectra (Harris, Carilli, & Perley, 1994; Hardcastle et al., 2002). There are, however, many sources for which the X-ray emission is orders of magnitude larger than the SSC prediction and for which this paradigm is clearly incomplete. It has recently been suggested, based on analysis of archival Chandra observations of the compact hot spots of 3CRR radio galaxies, that in some cases synchrotron emission can be the dominant component and can be orders of magnitude larger than the SSC component (Hardcastle et al., 2004). It was found that lower radio power hot spots tended to have stronger optical and X-ray synchrotron components (Brunetti et al., 2003; Hardcastle et al., 2004). It was speculated that this represents an intermediate case between X-ray synchrotron emission as seen in the jets of FR I radio galaxies and the SSC mechanism of the powerful FR II hot spots. Some hot spots do indeed appear to show a SED consistent with synchrotron emission from a simple continuous-injection model (Heavens & Meisenheimer, 1987) between the radio and X-ray (e.g. 3C 403; Kraft et al. 2005). However, Tavecchio et al. (2005) showed that good optical/UV constraints on the fluxes of the hot spots in some FR II quasars preclude fitting a single-component synchrotron model to the radio through X-ray data, while the normalization of the X-ray emission is inconsistent (orders of magnitude too large) with an SSC model. Instead, they suggested that models involving beaming (such as the deceleration model of Georganopoulos & Kazanas 2003) may be required to explain the observations. The synchrotron hypothesis can be directly evaluated with high resolution X-ray images of the hot spots of nearby FR IIs: high spatial resolution is necessary if we are to understand the relationship between the X-ray emission and the various radio and optical structures related to jet termination in these sources.
In the paper, we present results from new Chandra, Spitzer, and XMM-Newton observations, combined with archival HST, GALEX, and VLA observations, of the hot spots, the nucleus, and the extended environment of the nearby (=0.0597, see (Popescu et al., 1992)) FR II radio galaxy 3C 33. 3C 33 is a double radio source that extends 4′ on the sky with a weak radio core (Hargrave & McEllin, 1975). The radio emission at 1.4 GHz is dominated by the southern hot spot (SHS) (Rudnick, 1988; Rudnick & Anderson, 1990). Optical emission coincident with the radio peak of the SHS was first reported by Simkin (1979), and it was subsequently determined that this emission is highly polarized (40%), thus conclusively confirming it as synchrotron emission (Meisenheimer & Röser, 1986; Crane & Stiavelli, 1992). Imaging and spectroscopic studies of the hot spot have shown a complex optical morphology with a steep power-law slope (Simkin, 1986; Crane, Stockton, & Saslow, 1987). The hot spots were not detected in a ROSAT/HRI observation, but the upper limit to the X-ray flux demonstrated that there must be a break in the synchrotron spectrum between the optical and X-ray bands (Hardcastle, Birkinshaw, & Worrall, 1998). The primary scientific goal of the new observations is to resolve spatially the emission regions of the hot spots from the radio to the X-ray band in order to elucidate the emission processes that are important at the terminal hot spots of FR IIs. 3C 33 is an ideal candidate for this study as it is the nearest narrow-line FR II in the 3CRR catalog with optical synchrotron emission detected from a hot spot (Meisenheimer & Röser, 1986). The proximity of 3C 33 permits us to resolve spatially the emission features at the highest possible linear resolution. In addition, since this source has a narrow-line nucleus, relativistic beaming is not likely to be important in modifying the spectral or morphological properties of the hot spots.
This paper is organized as follows. Section 2 contains a summary of the observations, the results of the data analysis are presented in section 3, and we discuss the implications of our results in section 4. Section 5 contains a brief summary and conclusions. We assume WMAP Year-1 cosmology throughout this paper (Spergel et al., 2003). The observed redshift (=0.0597) of the host galaxy of 3C 33 corresponds to a luminosity distance of 263.9 Mpc, and one arcsecond is 1.14 kpc. All uncertainties are at 90% confidence for one parameter of interest unless otherwise stated, and all coordinates are J2000. Absorption by gas in our Galaxy (=4.01020 cm-2) (Dickey & Lockman, 1990) is included in all spectral fits and count rate to flux density conversions.
2 Observations
The radio galaxy 3C 33 was observed with Chandra/ACIS-S in two observations (OBSID 6190 and 7200) on November 8, 2005 and November 12, 2005 (PI: Stephen Murray). The total observing time was 40.3 ks. The observation was pointed so that the SHS was near the best focus, but all regions of the radio galaxy, including the northern hot spot (NHS) and nucleus, were contained on the S3 chip. We made light curves for the S3 CCD in the 5.0 to 10.0 keV band, excluding the nucleus, to search for background flares, and removed intervals where the background rate was more than 3 above the mean, leaving 39831.6 s of good data. Bad pixels, hot columns, and events along node boundaries also were removed, and standard ASCA grade filtering (0,2,3,4,6) was applied to the events file. Emission from 3C 33 fills only a small fraction of the field of view of the S3 chip, so local background was used in all spectral analysis. The X-ray core is aligned to 0.1′′ with the radio core, so no adjustment of the X-ray coordinates was necessary. All X-ray images presented in this paper were generated from the Chandra data.
XMM-Newton observed 3C 33 for a total of 17 ks in two separate observations on 2004 January 4 and 2004 January 21 (PI: Martin Hardcastle). The data were processed with the Scientific Analysis Software (SAS) using the standard pipeline tasks emchain and epchain and filtered for patterns (MOS) or (pn) and using the bit-mask flags 0x766a0600 for MOS and 0xfa000c for pn, which are equivalent to the standard flagset #XMMEA_EM/EP but include out of field-of-view events and exclude bad columns and rows. In the first of the two observations, the background count rate was low (0.2 counts s-1 for MOS and 0.4 counts s-1 for pn) so that no temporal filtering was required; however, both the MOS and pn data from the second observation suffered from a large flare at the start of the observation, which rendered the pn data unusable and required the MOS data to be filtered using a count rate threshold of 0.5 counts s-1. The resulting clean, merged data had a duration of 9700 s (MOS) and 6314 s (pn). The XMM-Newton data were used primarily in our study of the nucleus and the extended, low surface brightness diffuse emission from the group. The SHS was detected in these observations, the NHS was not. The larger XMM-Newton PSF (relative to Chandra) provides no additional structural constraints, so we use only the Chandra data in our study of the hot spots.
We present data from three Spitzer observations of 3C 33, two data sets taken from the public archive (one IRAC and one MIPS observation, both pointed towards the SHS - program ID 3327), and an additional IRAC observation (program ID 3418) centered on the host galaxy taken by the 3CRR low-z consortium (Birkinshaw et al. 2007, in preparation). The IRAC observations were made on July 23, 2004 (3327), and January 6, 2005 (3418), with observations times of 96 and 360 seconds, respectively. The MIPS (24 m only) observation was made on December 23, 2004 (3327) with an observation time of 200 seconds. The images used were produced by the data analysis pipeline version 14.1.0. The SHS is detected in all four IRAC bands and the MIPS image. The NHS is only contained within the Spitzer field of view in the 2005 IRAC observation and the MIPS image, and is detected in all four IRAC bands and the MIPS 24 m band, although there is some confusion from adjacent stars.
We also use archival HST (WFPC and WFPC2) and VLA data in this paper. The SHS was observed for 2400 s with the HST/WFPC2 instrument in 1995 as part of the HST survey of radio-galaxy hot spots (PI: P. Crane) using the F702W filter (pivot wavelength of 6919 Å), and for 1800 s with the HST/WFPC instrument using the F606W filter (pivot wavelength of 5888 Å) (Crane & Stiavelli, 1992). There have been no HST observations of the NHS. We obtained the reprocessed data of the SHS from the HST archive and used the IRAF synphot package to apply photometric calibrations. The fluxes were reddening-corrected using the dust maps of Schlegel, Finkbeiner, & Davis (1998). The correction to the flux densities is 25% in the visual. A 1.5-GHz radio map with a resolution of 4.0 arcsec was obtained from the 3CRR Atlas111http://www.jb.man.ac.uk/atlas/: this is the image of Leahy & Perley (1991). At higher frequencies, we used 4.9 and 15-GHz data from the VLA public archive. Details of the VLA data used and the maps made from them are given in Table 1. The data were calibrated and reduced in the standard manner using AIPS. Results from analyses of these data have been previously published in Rudnick (1988) and Rudnick & Anderson (1990).
Finally, we also examined the XMM-Newton Optical Monitor (UVM2 filter) data and archival GALEX images of 3C 33. The hot spots were not detected in any of the UV images. The observation time of the GALEX observation was sufficiently short (90 s) that the upper limits are not interesting (they lie well above an extrapolation of the optical detections or limits). The XMM-Newton OM upper limits lie above the GALEX limits because of a combination of the narrower bandpass and lower effective area. The 3 upper limits on the flux density of S1 in the GALEX NUV (pivot wavelength 2297 Å) and FUV (pivot wavelength 1524 Å) bands are 2.0 and 6.1 Jy, respectively. These values were dereddened using the extinction curve of Cardelli, Clayton, & Mathis (1989).
3 Analysis
3.1 Hot Spots
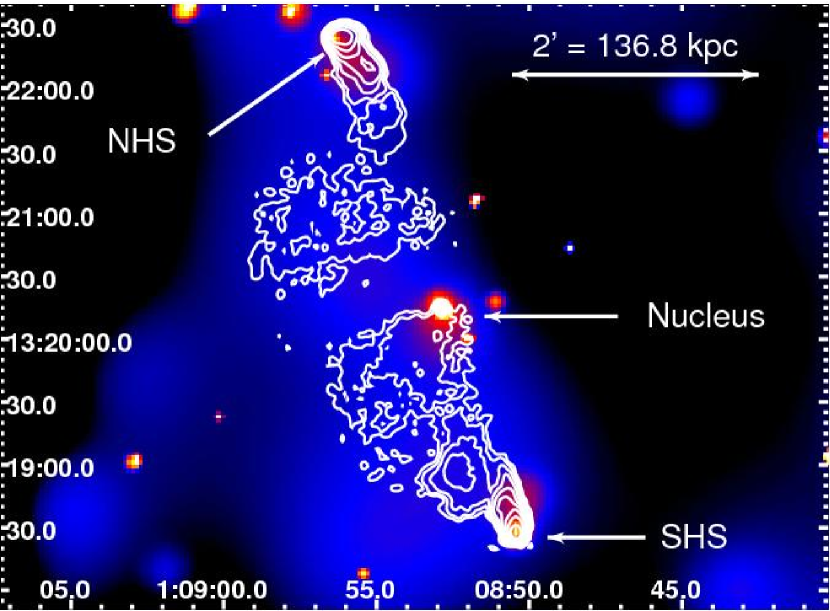
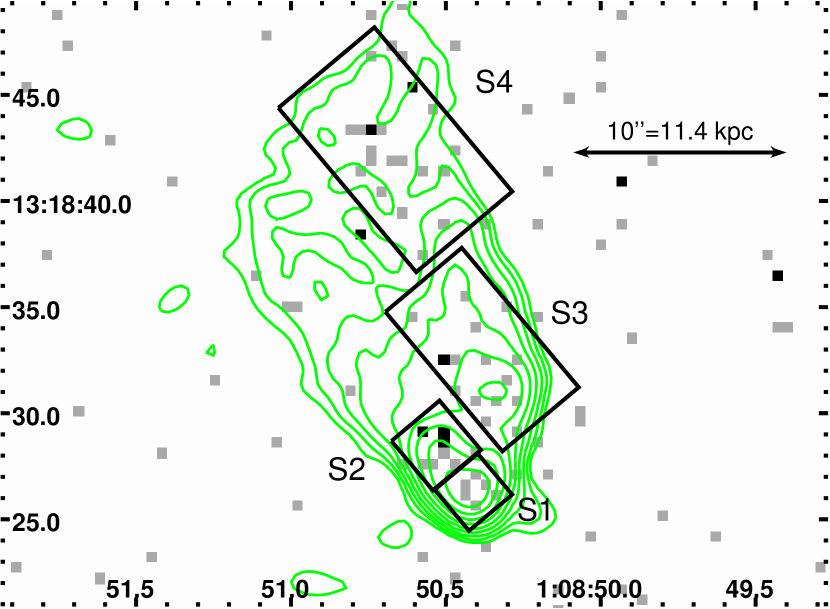
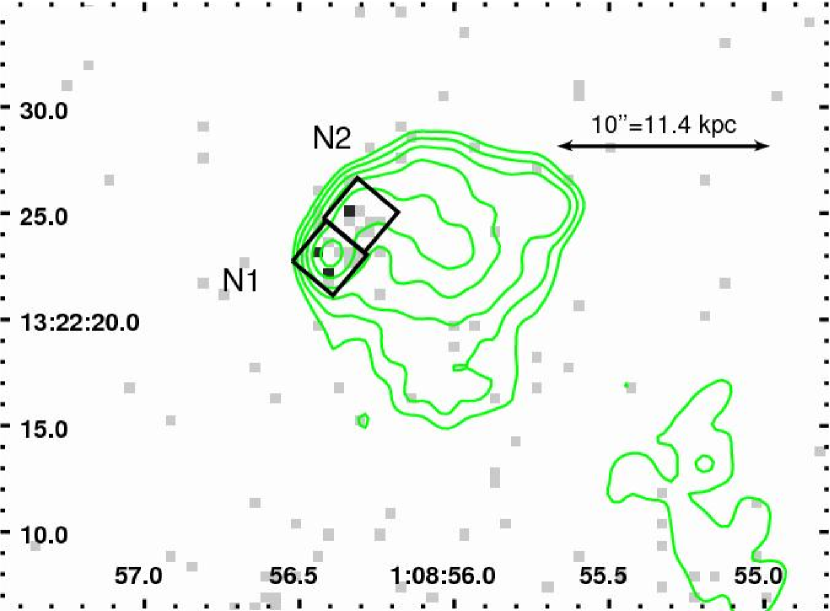
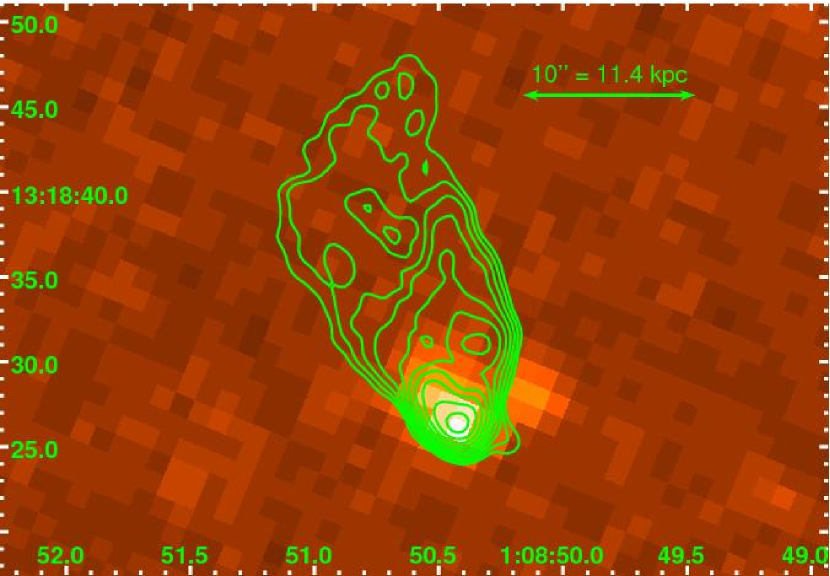
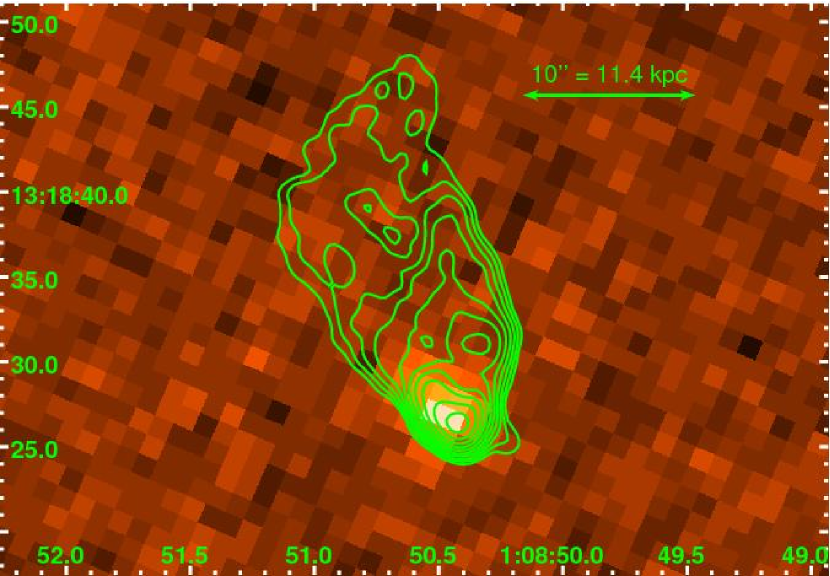
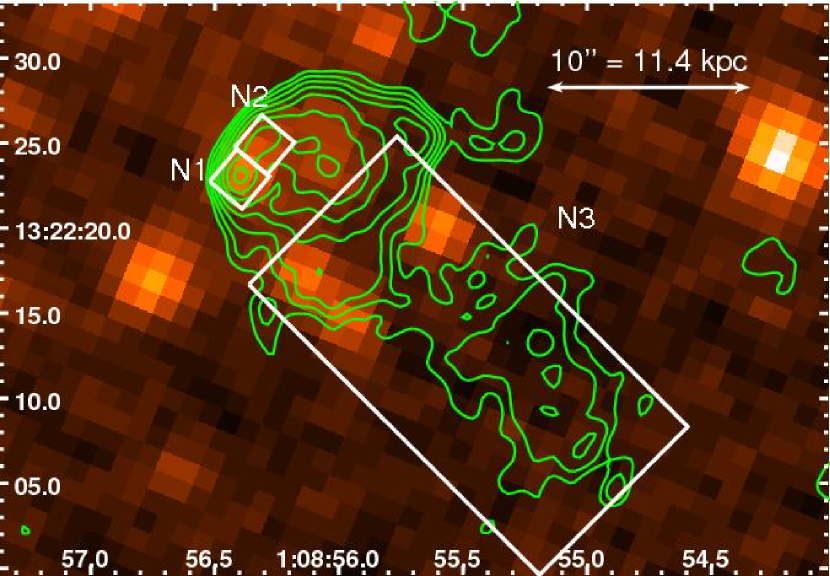
An adaptively-smoothed Chandra/ACIS-S image of 3C 33 with 1.4 GHz radio contours overlaid is shown in Figure 1. The positions of the nucleus and the two hot spots (NHS and SHS) are labeled. Unsmoothed Chandra/ACIS-S images of the SHS and NHS in the 0.5-5.0 keV band with 4.9 GHz radio contours overlaid are shown in Figures 2 and 3, respectively. We have divided the SHS and the NHS into four and three regions, respectively, for analysis. The regions S1-S4 and N1-2 are shown in the two figures and summarized in Table 2. Two additional regions, labeled DN1 and DS1, coincident with diffuse X-ray emission between the nucleus and the radio hot spots are also contained in Table 2. The 1 keV flux density is given for each region assuming a power law spectrum with photon index 2 and Galactic absorption, consistent with the spectral fits described below.
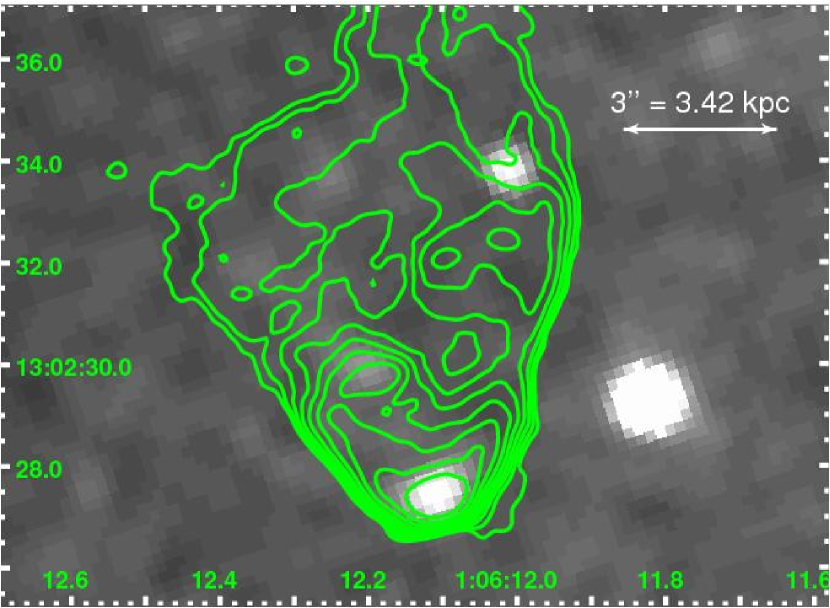
In both the NHS and SHS, spatially-resolved X-ray emission is detected coincident with the compact radio peaks (regions S1 and N1). In the SHS, X-ray emission is also detected closer to the nucleus than the hot spot to the northeast (region S2), and along the entire northwest half of the lobe (regions S3 and S4). An HST/WFPC2 image of the SHS with 4.9 GHz radio contours overlaid is shown in Figure 4. An optical peak coincident with the radio peak (S1) is observed, as is a weaker feature 2′′ to the northeast (S2). Both of these features have X-ray counterparts. There is no apparent optical emission from S3 or S4. In the NHS, a second region of X-ray emission is detected in the NHS to the northwest of the radio peak (labeled region N2). There is also a tail of diffuse X-ray emission behind (i.e. toward the nucleus) N1 and N2. This can be seen in Figure 1 and has been labeled N3 in Table 2.
Before proceeding, we must clarify an important point of terminology. Historically the bright radio features of 3C 33 (in their entirety) that we have termed the NHS and SHS in this paper have been generally been referred to as ‘hot spots’ because they are relatively compact. This nomenclature is not entirely correct, however, as they contain both compact features and resolved, diffuse emission behind the compact features. Neither are they ‘lobes’, however, such as are seen in the canonical FR IIs Cyg A and 3C 98. For historical continuity, we will continue to use the acronyms NHS and SHS or the term ‘hot spot’ to refer to the entire radio bright features, but we will use the definitions and nomenclature of Leahy et al. (1997) when discussing our individual regions. By these criteria, S1 and N1 are primary hot spots. They are compact and are reasonably associated with the termination of the jet. Regions S2 and N2 are secondary hot spots. They are clearly hot spots in a morphological sense, although they are not the termination points of the jet. Finally, regions S3, S4, and N3 are considered to be part of the ‘hot spot complex’, although they are not hotspots. We will also use the term ‘hot spot’ to refer to compact features of FR IIs and radio quasars that are believed to be the termination of the jet. The term ‘hot spot’ will not be used in connection with individual regions that are clearly not compact (e.g. S3, S4, and N3).
There are too few counts to fit the X-ray spectra of each region of the NHS and the SHS individually (typically 10-15 source counts in each region), so we combined all the counts in S1-S4 and N1-N3 to create two spectra. We fit each spectrum with an absorbed power law model, with the absorption fixed at the Galactic value to reduce the number of free parameters. The best fit photon indices are 1.80.6 and 2.20.8 for the SHS and NHS, respectively. The quality of these data are not sufficient to discriminate between emission models (i.e. synchrotron, thermal, or inverse Compton scattering) on the basis of spectra, although we reject the thermal model for reasons detailed below. The unabsorbed X-ray luminosities of the SHS and NHS are 1.6 and 0.51041 ergs s-1, respectively, in the 0.5 to 5.0 keV bandpass.
The morphology of the SHS in the infra-red in two Spitzer/IRAC bands, 4.5 and 8.0 m, is shown in Figures 5. At the shortest IRAC wavelengths (Figure 5 left), region S1 dominates the IR emission of the SHS, although S2 is clearly detected. There is little or no emission from S3 or S4. At longer wavelengths (Figure 5 right), the fluxes from S1 and S2 are roughly equal. Thus the flux density spectral index (and therefore the electron energy distribution index) is considerably steeper for S2 than S1. The morphology of the NHS in the IR at 4.5 m, shown in Figure 6, is very different than that of the SHS. There is a bright IR peak coincident with region N1, and a 8′′ long tail of emission to the west that follows the radio contours through region N2. The limited spatial resolution of Spitzer (1.2′′) prevents us from determining whether this emission is continuous or composed of small (kpc-scale) knots. If the radio peak (N1) represents the termination point of the jet, the detection of this filament of IR emission perpendicular to the hot spot/jet axis suggests that there is particle acceleration (and therefore large velocities) perpendicular to this axis as well. This is qualitatively consistent with the ‘primary + splash model’ for the flow pattern of the NHS proposed by Rudnick & Anderson (1990).
The angular resolution of Spitzer is such that the S1 and S2 components of the SHS, and the N1 and N2 components of the NHS, are separated in IRAC channels 1 and 2 (3.6 and 4.5 ), but blended to a greater or lesser extent at the other wavelengths. The fields are further complicated by the presence of nearby foreground stars. To extract the flux densities of the separate components we therefore fitted point sources at the approximate locations of the components (leaving some freedom in the coordinates to allow for a misalignment of the radio and IR coordinate systems), and at one or two contaminating stars in the hot-spot fields. Cross-checks of the derived flux densities were made using aperture photometry, where possible. Errors on the flux densities of the components were derived from the fits taking account of the residuals in the areas fitted and the number of parameters being fitted, and include the systematic errors on the flux density scale expected in the different bands.
At 24m this degree of fitting was not possible, because the hot spot components are severely blended by the diffraction-limited point spread of Spitzer. At this band we therefore fitted the best flux densities using defined locations for the hot spot components, and compared the results with the fraction of the total flux densities for the hot spot regions that would be expected given their 3.6 to 8 spectra. Generally the results agree, though the errors from the spectral extrapolation constrained by the total flux densities of the hot spots are smaller, and so the latter results were adopted.
The results for the IR flux densities, as well as radio flux densities, of all seven regions (S1 through S4 and N1 through N3) are shown in Table 3. For completeness, the optical, UV, and X-ray flux densities (or upper limits) for S1 are shown in Table 4. The optical points are taken from either archival HST images or previously published values (Meisenheimer & Röser, 1986; Crane & Stiavelli, 1992). Regions S3, S4, and N1 through N3 were not detected in any optical or UV band.
We have constructed radio through X-ray flux density distributions for six regions. These are shown in Figures 7, 8, 9 for the S1/2, S3/4, and N1/2 pairs, respectively. All error bars are 1 statistical uncertainties. If the error bars are not visible, they are smaller than the data points. The upper limits on the IRAC fluxes shown in Figure 8 are 3 limits. The solid lines are representative single injection synchrotron models, and the dotted and dashed lines are the estimates of the minimum energy IC/CMB and SSC models, respectively. The details of these spectral models, as well as implications regarding X-ray emission mechanisms, are presented in Section 4.
3.2 Nucleus
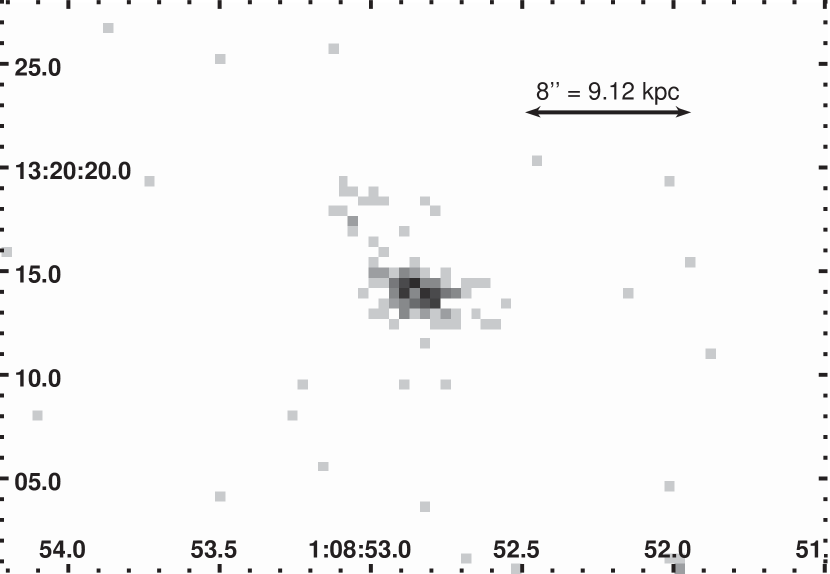
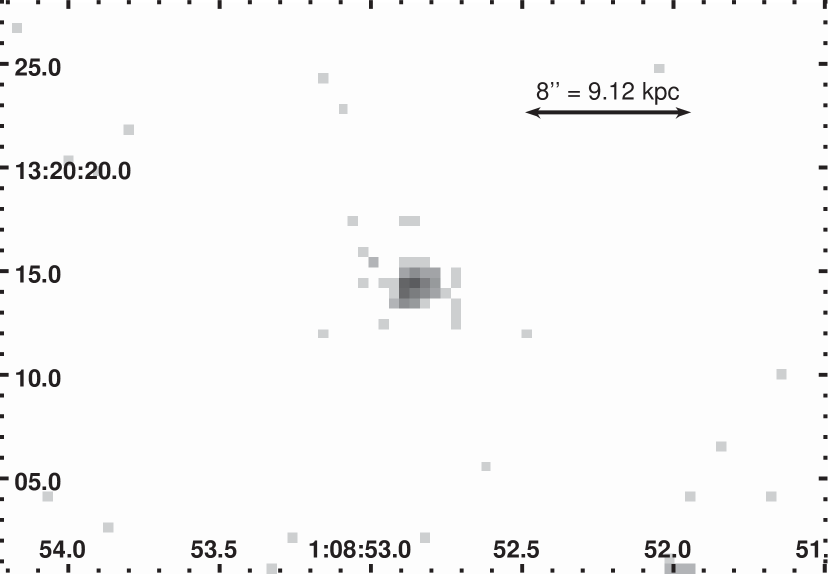
X-ray images of the nuclear region of 3C 33 in the 0.3-0.7 (soft) and 1.5-2.0 (hard) keV bands are shown in Figure 11. In the hard band, the nucleus is unresolved and consistent with a point source. In the soft band the structure is clearly extended, with the emission elongated along the northeast/southwest axis. This extension is not the frame transfer streak (FTS) as it lies roughly along the ENE/WSW axis through the nucleus. The position angle of the observed extension is rotated relative to this axis by approximately 30∘. In addition, the nucleus contains only 2000 counts, so 30 counts are expected over the entire 8′ length of the FTS. HST observations of the host galaxy show a similar elongation in the stellar distribution suggesting that the extended X-ray emission is from thermal gas. There is an additional spatially extended X-ray component 5′′ (5.7 kpc) to the northeast. It is unclear whether this is thermal emission from an extended gaseous component or X-ray emission from a nuclear jet. There is no evidence of a kpc scale jet in any of our radio maps.
The spectrum of the nucleus was extracted from a source-centered circle of radius 10 pixels (4.92′′), with background sampled from a surrounding annulus of inner radius 10 pixels and outer radius 20 pixels (9.84′′). The Chandra count rate from the nucleus is 0.05 cts s-1, indicating little pileup. Initially we fitted the spectrum of the nucleus with a three-component model: an absorbed power law, a Gaussian line representing emission from neutral Fe Kα, and a thermal (the XSPEC Astrophysical Plasma Emission Code model, or simply APEC) component. The fit was poor (=19.9 for 26 degrees of freedom) with large residuals between 1 and 3 keV, so we investigated two alternative models.
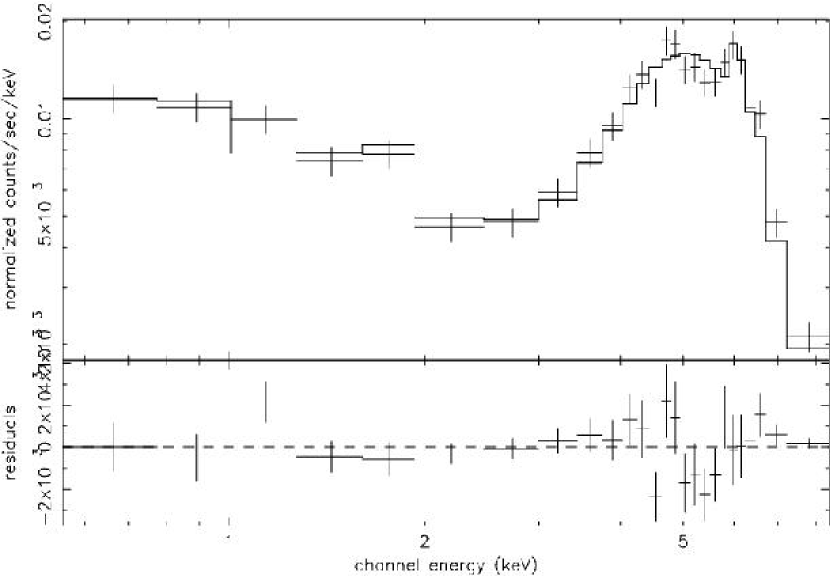
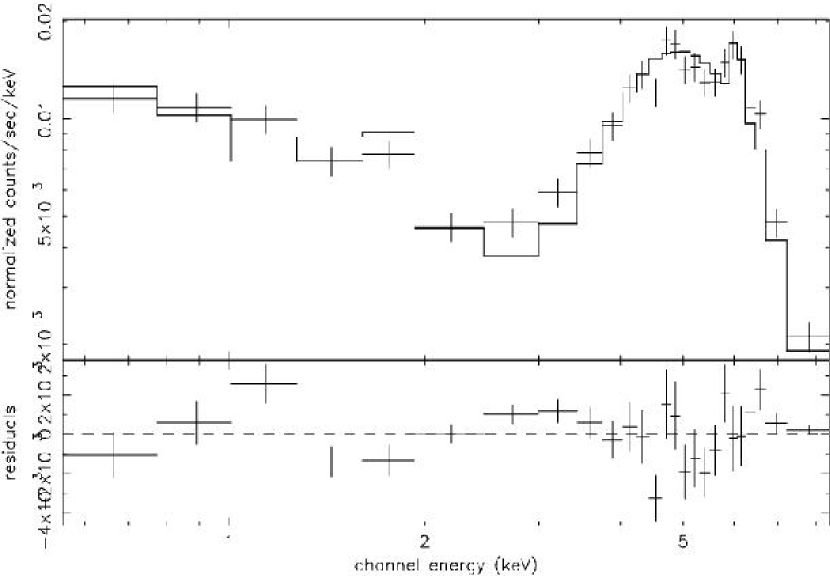
Model 1 consisted of a four component model, the three components listed in the previous paragraph plus a reflection component. The reflection model has been used to fit the X-ray spectra of Seyfert galaxies, but has rarely been found to provide an adequate description of the X-ray spectra of radio-galaxy nuclei. The X-ray spectrum with the best-fit four-component reflection and two power-law component models and residuals are shown in the left and right plots of Figure 14, respectively. Model 2 also consisted of the three components listed in the previous paragraph plus a second, less absorbed power law representing emission from a parsec scale jet. Such a model has been shown to be a good description of emission from the nuclei of FR II radio galaxies (Evans et al., 2006). A summary of best-fit parameters and uncertainties for both models is contained in Table 5. The APEC component in the model that includes a reflection component required abundances of Mg and Si that were larger than the Solar value and a sub-Solar value for Fe. This is probably not physical and may be indicative of systematics in the model such as multi-temperature gas in the ISM or more complex reflection geometry than a uniformly illuminated slab. We note that the large column density toward the primary power law in both spectral fits is consistent with the expectations from unified models for a narrow-line radio galaxy, as is generally seen in X-ray observations of large samples of such sources (e.g. Sambruna et al. 1999; Belsole et al. 2006; Evans et al. 2006; Hardcastle et al. 2006). This strongly supports the idea that the jet axis is close to the plane of the sky and that relativistic beaming is not important in modifying the appearance of the hot spots. Finally, we mention that we fitted the XMM-Newton spectra (both MOS cameras and PN) with the same models and find that the fits are consistent with the Chandra results.
3.3 Large Scale Diffuse Emission and Environment
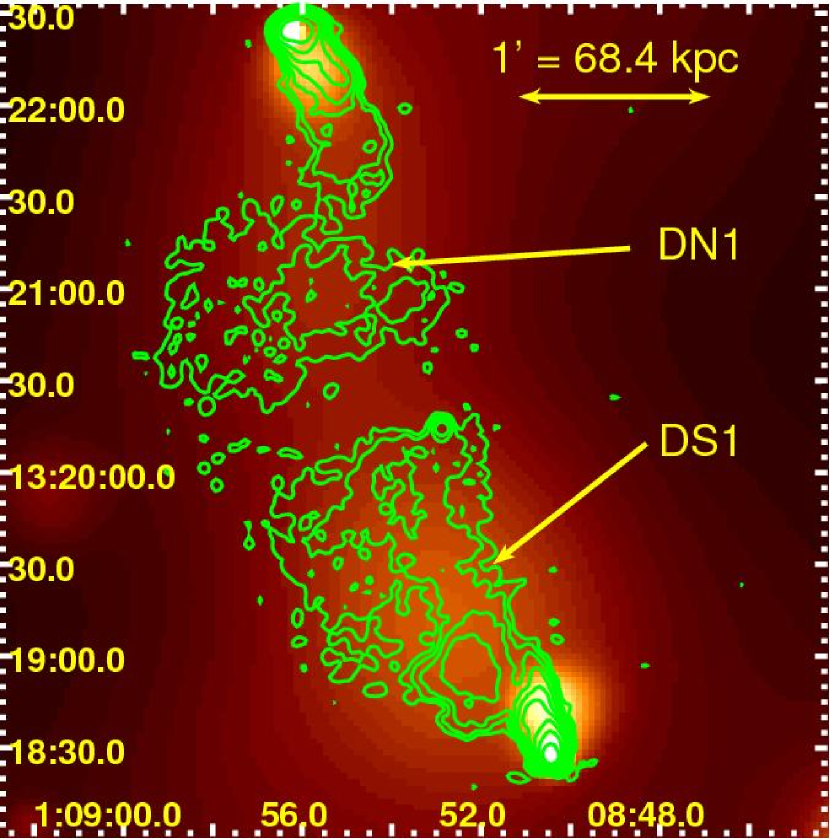
Diffuse, low surface brightness emission unrelated to either the hot spots, the central galaxy, or the active nucleus is visible in Figure 1. This emission is more clearly shown in Figure 12, an adaptively smoothed X-ray image in the 0.5-2.0 keV band with all point sources other than the NHS and SHS removed. Two regions of diffuse X-ray emission have been labeled DN1 and DS1. This emission is generally aligned along the NE/SW axis of the radio structure, and extends more than 100 kpc. There is a rough spatial correspondence between this X-ray emission and the diffuse radio lobe emission between the hot spots and the nucleus. The X-ray fluxes of regions DN1 and DS1 are 4.5 and 6.2 ergs cm-2 s-1 assuming a power-law spectrum with photon index 1.5 and Galactic absorption: this corresponds to 1-keV flux densities of 1.3 and 1.8 nJy. The combined spectrum of the two regions is well fitted with a power-law model of photon index 1.50.7 (90% confidence) and Galactic absorption. We also fitted the spectrum with an absorbed APEC model with the absorption fixed at the Galactic value and the elemental abundance fixed to 0.5 times Solar to reduce the number of free parameters. The best fit temperature is 1.5 keV (90% confidence for one parameter of interest). We believe that this emission is non-thermal, but a purely thermal model is not conclusively ruled out by the data (see Section 4.2 for complete discussion).
To investigate the properties of the undisturbed environment of 3C 33 on smaller (i.e. galactic) scales, we extracted a radial surface brightness profile from the Chandra data in the 0.5 - 2 keV energy range, excluding the radio lobe and hotspot regions. This profile is shown in Figure 13. The total number of counts (after background subtraction) in the surface brightness profile is cts. We modeled the Chandra point-spread function using ChaRT and Marx. A point-source model was not a good fit to the profile, with a clear detection of extended emission between 10′′ and 100′′. We therefore fitted a point-source plus model to the profile, although the parameters of the model were poorly constrained. Acceptable fits were obtained for values in the range of 0.67 to 0.9, with 2′′ (2.3 kpc). We extracted a spectrum in an annulus between 10 and 100 arcsec, excluding the radio lobes and hotspots, and found that the 0.5 - 2 keV spectrum is consistent with a thermal model of =1.8 keV (the spectrum above 2 keV is dominated by scattered AGN emission). This temperature is unphysically large for a relatively isolated elliptical galaxy and perhaps suggests that even the gas in the central 10 kpc of the host galaxy has been disturbed by the passage of the powerful radio jets. We used the XMM-Newton data to investigate whether any emission on larger scales was present; the data are consistent with the presence of the Chandra-detected component, but the poor data quality meant that no strong upper limits on larger-scale emission could be obtained.
We integrated the best-fitting model (, = 1.3′′) to determine the total net counts from the environment, which corresponds to a count rate of 710-3 cts s-1 in the 0.5-2.0 keV band. Using the best-fitting temperature, this corresponds to a luminosity of ergs s-1 in the 0.5-2.0 keV band, or a bolometric luminosity of 31041 ergs s-1. The luminosity-temperature relation for radio-quiet groups from Croston, Hardcastle, Birkinshaw (2005) predicts a luminosity of 41043 ergs s-1 for groups with a temperature of 1.8 keV, so that the 3C 33 group appears to be roughly two orders of magnitude less luminous than would be expected for its temperature, unless both Chandra and XMM-Newton are failing to detect a very large, smooth extended environment. A temperature of 0.5 keV is predicted for our measured luminosity. This suggests either that 3C 33 (or previous generations of outbursts from its AGN) has had a dramatic effect on the surrounding group, or that powerful radio galaxies can form in extremely poor environments.
4 Interpretation
4.1 X-ray Emission from Hot Spots
We have fitted three models to the radio through X-ray flux density distributions of the seven regions shown in Figures 7 through 10: a broken power-law synchrotron model with a high energy cut-off, a synchrotron self-Compton model (SSC) in which the X-ray emission is the result of inverse-Compton scattering of the synchrotron radio photons off the relativistic electrons, and a model of inverse Compton scattering of CMB photons (IC/CMB) off the radio synchrotron emitting relativistic electrons. Other sources of seed photons in the inverse-Compton scenario including optical photons from the stellar population of the host galaxy or beamed optical/IR photons from a hidden nuclear jet are implausible because of the distance of the hot spots from the nucleus (see Hardcastle, Birkinshaw, & Worrall (1998) for details). For example, the energy density of IR photons emitted from the nucleus (based on the nuclear flux measured in the Spitzer images) is roughly two orders of magnitude below the energy density of the CMB at the distance of the hot spots.
The relevant model parameters for the synchrotron, IC/CMB, and SSC curves shown in Figures 7 through 10 are summarized in Table 6. We assume a power-law electron energy distribution for the synchrotron fits with =100 and =108. We also allow for a break in the electron energy distribution where the index of the power law steepens. We choose to plot synchrotron models for S3 and S4 with relatively large breaks for consistency with S1 and S2. For the latter two regions, the large change in power-law index is required by the optical and IR data. The flux density distributions of S3 and S4 could be modeled with a smaller change in index which would be roughly consistent with the optical and IR limits, although the lack of detections in these bands prevent a definitive conclusion. We emphasize that in regions S3 and S4, we must be averaging over considerable substructure in the synchrotron scenario because of the short lifetime of the particles. The broken power-law model thus should be viewed as a parameterization of the data and does not imply a single-zone model. For the IC/CMB and SSC fits, we assume equipartition with no contribution from relativistic protons. For all regions other than S1, we assume a cylindrical geometry in the plane of the sky with the diameter of the cylinder equal to the short axis of the region, and the height equal to the long axis. The IC/CMB fits roll off at low frequency because of the choice of .
The SSC calculation is sensitive to the assumed geometry of the spot, and high-frequency radio observations of S1 clearly indicate the presence of compact structures smaller than the box chosen for X-ray analysis. We consider two models of the geometry of S1 for SSC calculations. Firstly, we assumed that all the radio emission in the S1 region comes from a uniform-density sphere of radius . This value was chosen as a reasonably compromise between the the 15 GHz radio morphology and the much smaller value of used in the analysis of Hardcastle, Birkinshaw, & Worrall (1998), who based it on the modeling of Meisenheimer et al. (1989). The results of this simple model are plotted in Figure 7. As the hotspot region is clearly resolved in both radio and X-ray, we next used the code of Hardcastle et al. (2002) to consider a more complex two-zone model which better matches the structure of the hotspot in the highest-resolution 15-GHz observations. This model consisted of a section of a thin spherical shell with uniform electron density embedded in a region bounded by a paraboloid with a linear electron density gradient: the magnetic field strengths in the two components were separately normalized using their observed 15-GHz flux densities, and other electron spectral parameters were as described above. The predicted X-ray flux density of this model (which is dominated by the more extended filled paraboloid region, as a thin shell is a poor source of SSC emission) is roughly a factor 2 below the estimate derived from the spherical geometry. We conclude that the largest uncertainty in the SSC flux from S1 is due to the assumed geometry, but that the observed X-ray flux is consistent with the SSC prediction with only a small departure from equipartition.
Although the observed X-ray flux from S1 is consistent with the SSC prediction, the X-ray flux densities of regions S2, S3, S4, N1, and N2 are one to two orders of magnitude larger than predicted in either the SSC and IC/CMB scenarios if the features are in equipartition. (see Figures 7 through 10). The larger region N3 is reasonably well described by the IC/CMB model with a small departure from equipartition. The radio through optical flux density distributions of the regions S2 through S4 indicate a significant steepening of the spectral index in the optical region, so that the observed X-ray emission cannot be described by an extrapolation of a simple single-component synchrotron model for these regions of the SHS; if this extrapolation is plotted (e.g. in Fig. 7) it would clearly violate the optical constraints on the flux density distributions. In fact, it has been argued that this radio to optical spectral steepening strengthens the case for a high-energy cut-off in the electron energy distribution (Meisenheimer et al., 1989; Hardcastle, Birkinshaw, & Worrall, 1998). Thus, while the X-ray emission from S1 is consistent with the SSC mechanism, neither of the two canonical emission mechanisms provide a satisfactory explanation for the X-ray emission observed in the other regions of the SHS of 3C 33. The X-ray emission from the two compact regions of the NHS (N1 and N2) is orders of magnitude above the SSC prediction, but is well described by a simple single-component synchrotron model (shown on Figure 9).
There are several important implicit assumptions in the various IC scenarios that may not be appropriate for the regions of 3C 33 where SSC and IC/CMB are nominally inadequate. Such failures could account for the discrepancies between the observed and predicted X-ray flux densities. In particular, it is possible that these regions are not in equipartition, that protons make a significant contribution to the energy density, or that the filling factor of the relativistic plasma is less than unity. Only a comparatively small departure from equipartition, a factor of 4 in magnetic field (in the sense that ), is required for regions S2 through S4 to be fitted with an IC model. However, the departure is considerably larger for the two compact regions of the NHS (). The equipartition expectations are only reduced if there is an energetically significant proton population. In principle arbitrarily large SSC fluxes may be produced by low filling factors, but in practice these would have to be implausibly low, with volume filling factor values , to explain the two orders of magnitude discrepancy between the prediction and the observations in components such as S4. These issues are explained in more detail in Hardcastle et al. (2004); Kataoka & Stawarz (2005).
Relativistic beaming is often invoked to explain the X-ray emission of jets of radio quasars and the hot spots of FR II radio galaxies in the various IC scenarios (Georganopoulos & Kazanas, 2003). This is untenable in regions S2-S4 and N1-N2 of 3C 33 for at least five reasons. First, and most importantly, X-ray emission has been detected from both the NHS and SHS. It is unlikely that both are moving towards us at relativistic velocity near our line of sight. Second, the X-ray nucleus is heavily obscured, suggesting that the jets lie close to the plane of the sky. Third, the optical nucleus is classified as a narrow emission line radio galaxy, supporting the previous point. Fourth, core prominence (the ratio of 5 GHz luminosity of the core to 178 MHz flux of the entire source) is often used to estimate the role of relativistic beaming (Orr & Browne, 1982; Morganti et al., 1997; Hardcastle et al., 2004). The core prominence of the 3C 33 nucleus is low, supporting the conclusion that beaming is not important. Fifth, VLBA observations of the core of 3C 33 show only a small (factor of 2 at a distance of 5 mas from the core with the brighter component aligned with the SHS) asymmetry in the ratio of the flux density of the jet/counterjet at 5 GHz (Giovannini et al., 2005). Thus, we conclude that relativistic beaming is not an important factor.
As an alternative, we consider a scenario in which internal motions in the regions at relativistic velocities could account for the observed X-ray emission. In this model, the radio emission originates in two distinct components, one which follows the general flow of the hot spots (i.e. non-relativistic in or near the plane of the sky) and a second component that has been deflected close to our line of sight at relativistic velocity. To evaluate the plausibility of this model, we consider knot S4. If we assume that all of the radio emission from this region originates in the beamed component and it occupies the entire volume of S4, a bulk Lorentz factor, , of 2 or greater is required, and the direction of motion must be close to the line of sight (). Assuming a smaller volume would only push higher. There is some evidence for mildly relativistic flows behind FR II hot spots, although nothing of this magnitude. We conclude that it is unlikely that the X-ray emission from these regions can be accounted for by relativistic motions of sub-components.
It is also extremely unlikely that the X-ray emission from these regions is due to hot gas that has been swept up, since the host galaxy of 3C 33 resides in a poor environment. Assuming that the X-ray emission of the SHS is from a thermal plasma with =1.5 keV and =0.5 times Solar, the density of the gas would be 10-2 cm-3 assuming a uniform filling factor. The pressure and mass of this gas would be 6.210-11 dyn cm-2 and 109 , respectively. The gas pressure of this putative shell would exceed the equipartition pressure of the diffuse regions behind the hot spot (S1) by a factor of 6 (Rudnick, 1988). This is not implausibly large as the equipartition pressure of lobes and jets of FR I radio galaxies is often less than the pressure in the ambient medium (e.g. the inner radio lobes of Cen A, see Kraft et al., 2003), although it would be unusual for an FR II. If the extended diffuse X-ray emission described in subsection 3.3 is from an extended corona, the mass of gas in the NHS and SHS would each be 5% of the total gas mass, which is implausibly large.
The only other possibility is that the X-ray emission is synchrotron radiation from a population of ultra-relativistic electrons, although the observed flux density distributions cannot be simply described with single or continuous injection models. There are, in fact, several arguments that support the multi-zone synchrotron hypothesis for regions S2, S3, S4, N1, and N2. First, the radiative lifetime of the ultra-relativistic particles is a few tens of years in the equipartition magnetic fields of the regions. All of the knots are resolved in the X-rays, so the particles must be re-energized along the length of the regions. Thus, in each knot there must be many sites of particle acceleration. There is therefore no reason to expect that a single injection model will accurately describe the broad band flux density distribution from such a scenario. Second, it is clear from Chandra observations of nearby FR I jets, whose radio through X-ray emission is believed to be synchrotron, that the morphological relationships between the radio, IR, optical, and X-ray synchrotron emitting electrons are complicated (Kraft et al., 2001; Hardcastle, Birkinshaw, & Worrall, 2001).
It is clear, however, that the simple model described in Hardcastle et al. (2004), in which a single continuous-injection spectrum describes the radio through X-ray spectrum of these regions, does not apply to 3C 33. The resolved nature of the X-ray emission, coming from throughout the bright 10-kpc SHS, in fact makes it clear that a model in which the X-rays are generated by electrons accelerated at a single location is simply not appropriate in this object. At the same time, both the resolved nature of the X-ray emission and the fact that 3C 33 lies in the plane of the sky rule out explanations involving beaming, such as those used by Tavecchio et al. (2005) for their quasar hot spots. Given the known complex distributed particle acceleration properties of low-power radio jets, we feel it is reasonable to suggest that the SHS of 3C 33 contains many discrete regions of particle acceleration and that incompatibility with a one-zone continuous injection model is not inconsistent with the X-rays having a synchrotron origin. In fact, a multiple component synchrotron model for the SHS was required by Meisenheimer et al. (1997) to explain the radio to optical spectral index and the optical morphology. Deep, high spatial resolution observations in the optical and the near-UV may offer the best prospect of testing this picture.
Therefore, both the synchrotron and SSC processes are important in the SHS of 3C 33. The equipartition magnetic field strength is 195 G for region S1 (and the field strength would be larger for a smaller assumed volume), and between 25-80 G for regions S2 through S4. Thus, the rate of synchrotron energy loss in region S1 is 5-64 times greater than in the rest of the regions. There is no X-ray synchrotron emission from S1 because the magnetic field is too large (Hardcastle et al., 2004). Extended regions of X-ray emission, where the SSC and IC mechanisms are out of the question, are strong evidence for a distributed particle acceleration process like that seen in low-power jets. This suggests that a simple choice between an SSC or an IC origin for the emission mechanism may not be appropriate for other, more distant, hot spots for which we do not have the high linear resolution that we have in 3C 33.
4.2 Diffuse Emission Co-Incident with Radio Lobes
We consider two possible models for the origin of the diffuse X-ray emission coincident with the radio lobes: inverse-Compton scattering of CMB photons off the relativistic electrons in the diffuse radio features behind the hot spots and thermal emission from hot gas. The quality of the data is not good enough for us to differentiate with certainty between these possibilities.
4.2.1 IC/CMB
X-ray emission from the extended lobes of radio galaxies is generally attributed to inverse-Compton scattering of cosmic microwave background (CMB) photons by the low-energy electrons in the lobe (Feigelson et al., 1995; Kaneda et al., 1995). Additionally, it has been shown for large samples of FR II radio sources that the X-ray fluxes measured from the lobes generally lie within a factor of a few of the prediction from the inverse-Compton process assuming equipartition magnetic fields (Kataoka & Stawarz, 2005; Croston et al., 2005). We calculate the expected inverse-Compton fluxes from the lobes on the assumption of equipartition using the code of Hardcastle, Birkinshaw, & Worrall (1998) and with the same assumptions as Croston et al. (2005) (lobes are treated as uniform cylinders, , , and a break in the electron spectrum is applied to match the radio data), taking normalizing flux densities for the lobe regions, excluding the NHS and SHS, from unpublished archival low-frequency VLA (1.4 GHz, observation AL0146) and GMRT (610 and 244 MHz, observation number 2070) data. 3C 33 is unusual in that the flux density even at low frequencies is dominated by the bright hot spots, not the lobes. This calculation predicts flux densities of 0.7 nJy for each lobe at equipartition, a factor 1.9 and 2.6 below the observed values. As Croston et al. (2005) find that this factor is typically for the sources they study, 3C 33’s lobe X-ray emission gives results consistent with those seen in other FR IIs. The X-ray morphology does not precisely match the radio morphology, although the low X-ray surface brightness and heavy smoothing of the data prevent a definitive statement. Thus it is at least plausible that this extended X-ray emission is due to inverse-Compton emission.
4.2.2 Thermal
The other possibility is that this X-ray emission is from an extended hot gas corona. We consider two models for the distribution of the gas, a uniform density sphere and a shell surrounding the radio lobes. Modeling the emission region as a uniform-density sphere of radius 1′ (68.4 kpc) with the best-fit temperature of the thermal model, we find a gas density of 710-4 cm-3 and a total mass of 21010 . A more realistic density profile (i.e. a beta-model) would only change these numbers by a factor of order unity. This is a relatively small amount of gas, probably less than the mass of stars in the host galaxy. The optical luminosity of the host galaxy (=-20.7) implies a stellar mass of 91010 assuming a mass to light ratio of 6 (Binney & Tremaine, 1987). The total thermal energy and pressure of this gas is 1.31059 ergs and 3.210-12 dyn cm-2, respectively. The thermal energy of the gas is not particularly large compared with the mechanical energy of many powerful radio galaxies such as 3C 33 (Bîrzan et al., 2004; Kraft et al., 2006). Any atmosphere of this mass, or less, is likely to have been shock heated by the radio outflow, and so would no longer be bound to the relatively shallow gravitational potential of the host galaxy of 3C 33.
Alternatively, the X-ray emission coincident with the lobes could be from a shell of gas that has been swept up and compressed by the inflation of the radio source. Modeling the northern emission region as a spherical shell with a radius of 62 kpc and thickness of 10 kpc, with the best-fitting temperature of the thermal model, we find a proton density in this shell of cm-3, and a total mass of . For a thinner, 1-kpc thick shell, the mass is (similar numbers are obtained for the southern lobe). As a comparison, we estimated the amount of mass expected to have been swept up by the expanding radio lobe, assuming the model parameters and temperature of Section 3.4, and assuming an expanding cone of opening angle 48 degrees and an outer radius of 90 kpc, which gave a mass of M☉. It is therefore possible that this emission originates from compressed gas that has been swept up by the expanding radio source; this gas may also have been shock heated, since the radio lobes are overpressured (see Section 4.3) and therefore expanding supersonically at least in their outer parts.
We note however that if the lobe-related emission is interpreted as entirely thermal in origin, then the absence of inverse-Compton emission from the radio lobes would require them to be magnetically dominated, which is not the case for the general population of FR II radio sources (Croston et al., 2005). We therefore argue that the majority of the lobe-related X-ray emission is likely to be inverse-Compton in origin; however, we cannot rule out some contribution from thermal emission related to radio-source environmental impact.
4.3 Large Scale Environment and Radio Lobe Dynamics
3C 33 appears to have a poor environment with a steep density and pressure gradient in the regions surrounding the radio lobes. We compared the internal minimum pressure of the radio lobes with the external pressure from this environment in order to investigate the dynamics of radio-lobe expansion. The radio lobes were modeled assuming equipartition and the same electron spectrum and normalizing flux densities as in Section 4.2.1, and found to have minimum internal pressures of dyn cm-2 (this value is slightly higher if the electron density implied by an inverse-Compton interpretation for the lobe X-ray flux is used: see Section 4.2.1). Our estimate of the external gas pressure depends on whether the observed diffuse X-ray emission on large scales is thermal or IC/CMB. If we assume the emission is thermal, the X-ray data beyond 20′′ from the nucleus are consistent with a flat beta-model profile of low surface brightness. For example, a component with =0.5 and =20 kpc, normalized to the observed Chandra count density at 50 arcsec, would have external pressures at the midpoints of the radio lobes of 210-12 dyne cm-2, consistent with approximate pressure balance as seen in other sources for which similar analyses have been performed (e.g. Hardcastle & Worrall 2000; Hardcastle et al. 2002; Croston, Birkinshaw, Hardcastle, & Worrall 2004; Belsole et al. 2004 among many others). On the other hand, if we simply extrapolate the best fit beta-model parameters derived for the galactic scale emission (second and third paragraphs of section 3.3), the lobes are greatly overpressured relative to the ambient medium. At the approximate midpoint of the northern lobe, a distance of kpc, the external pressure is dyn cm-2 (with the uncertainty dominated by uncertainty in the -model parameters); at the (projected) midpoint of the southern lobe, kpc from the nucleus, the external pressure was found to be dyn cm-2. Although both lobes are likely to be in pressure balance at their inner edges, with this model for the environment, which has an exceptionally steep density gradient, the northern lobe appears to be overpressured by at least an order of magnitude halfway along its length, and both lobes must be overpressured at their outer edges.
The teardrop shape of the SHS has often been interpreted as shaped by a bow shock (Rudnick, 1988), and supports the hypothesis that it is still moving supersonically (relative to the external medium) through the extended hot corona. If this interpretation is correct, the opening half-angle of the shock, is related to the Mach number of the advance of the jet head by sin()M-1. The opening angle of the SHS is 50∘, implying a Mach number of 2.4 for the advance speed of the jet head relative to the ambient medium. The equipartition pressure of the material just behind the radio hot spots of the SHS is 10-11 dyn cm-2 (Rudnick, 1988). If the bow shock interpretation is correct, this material should be in rough pressure equilibrium with the shocked IGM. The Mach number of the advance of the jet implies a pressure jump of a factor of 7 (for =5/3) across the bow shock in the IGM based on the Rankine-Hugoniot relations (Landau & Lifshitz, 1989). The ratio of the pressures of the material behind the hot spot to the unshocked ambient medium is roughly consistent with this value. Assuming a gas temperature of 1 keV (consistent with the spectral fit above and the poor environment if all the X-ray emission is from thermal gas), the velocity (advance speed) of the jet head is 1000 km s-1. The radio outburst therefore commenced 7107 years ago if the jet has not slowed appreciably. Conservatively estimating that the mechanical power deposited into the gas equals the X-ray luminosity of the nucleus, the jets have put 21059 ergs into the gas, a number roughly equal to the thermal energy of the gas (if all the diffuse X-ray emission has a thermal origin). We emphasize that this is a very conservative estimate: if in fact the mechanical power of the jets/lobes is 10-100 times greater than the nuclear luminosity as has been observed in several radio galaxies in denser environments (Bîrzan et al., 2004), the energy deposited in the gas could be considerably larger. The powerful radio outburst has at least doubled the energy density of any gas within 70 kpc of 3C 33. It (the corona) is now likely unbound and in the process of being blown out of the galaxy. The diffuse X-ray emission may be the remnant of the group gas that has escaped/is escaping as a wind.
5 Conclusions
We have detected X-ray emission from both the north and south hot spots of the radio galaxy 3C 33. The X-ray emission from the tip of the SHS (region S1) is consistent with the SSC process. For the larger regions behind S1 and for the two compact regions of the NHS (N1 and N2), the observed X-ray flux is an order of magnitude or more above the SSC prediction. All inverse-Compton scattering models are rejected unless the hot spots are far from equipartition, and relativistic beaming cannot be significant as X-ray emission is detected from both hot spots and the nucleus is heavily absorbed. The radio through optical flux density distributions show a gradual spectral steepening, indicating that the observed X-ray flux from regions S2-S4 cannot be explained by a simple power-law extrapolation of the longer wavelength spectrum. We conclude that the X-ray emission is most likely synchrotron, although the measured flux densities lie above a simple extrapolation of the radio/IR/optical flux densities, or predictions from single or continuous injection models. The distributed nature of the X-ray emission throughout the diffuse radio features behind the compact radio hot spot, not just coincident with the radio peaks as seen in, for example, Cygnus A (Wilson, Young, & Shopbell, 2000), is analogous to the synchrotron emission seen in FR I jets.
The hot spots of 3C 33 thus provide strong evidence for the presence of synchrotron and SSC components within the same hot spots, and for multiple synchrotron components in FR II hot spots where the effects of relativistic beaming are unimportant. If this radio galaxy were observed at lower spatial resolution and the entire volume of the SHS used for the SSC calculation, we would conclude that the observed X-ray emission from the SHS far exceeded the SSC prediction for the feature as a whole. In fact, both emission mechanisms are important, and SSC is the dominant mechanism in the most compact feature. This should warn us about stretching assumptions about uniform filling factors for the hot spots of more distant radio galaxies too far.
High resolution UV images of the two hot spots could be made to further evaluate the conclusions of this paper. Similarly detailed, multiwavelength (IR and optical) studies of the NHS should also be made to confirm the synchrotron origin. Detailed optical studies of the NHS have not been previously undertaken probably because of the large difference in radio flux density relative to the SHS. Higher spatial resolution optical (i.e. HST) observations of the NHS may be particularly useful in constraining the morphology of this emission.
It is now clear that the SSC explanation for the X-ray emission from the radio hot spots of FR IIs is not the complete picture, and that synchrotron emission must be important in at least some of these sources. We have demonstrated that at least in the case of 3C 33, relativistic beaming is unlikely to play an important role. The role of beaming in general, however, is not known, and can only be addressed by studying statistically complete samples. The relative importance of synchrotron versus SSC X-ray emission in FR II hot spots could be conclusively resolved if a complete sample of such radio galaxies were observed by Chandra. We believe it is crucial to Chandra’s legacy that such a sample is observed.
References
- Belsole et al. (2004) Belsole, E., Worrall, D. M., Hardcastle, M. J., Birkinshaw, M., & Lawrence, C. R. 2004, MNRAS, 352, 924.
- Belsole et al. (2006) Belsole, E., et al. 2006, MNRAS, 366, 339.
- Binney & Tremaine (1987) Binney, J. & Tremaine, S. 1987, ‘Galactic Dynamics’, Princeton University Press.
- Bîrzan et al. (2004) Bîrzan, L., Rafferty, D. A., McNamara, B. R., Wise, M., W., & Nulsen, P. E. J. 2004, ApJ, 607, 800.
- Brunetti et al. (2003) Brunetti, G., Mack, K.-H., Prieto, M. A., & Varano, S. 2003, MNRAS, 345, L40.
- Cardelli, Clayton, & Mathis (1989) Cardelli, J. A., Clayton, G. C., & Mathis, J. S. 1989, ApJ, 345, 245.
- Crane, Stockton, & Saslow (1987) Crane, P., Stockton, A., & Saslaw, W. C. 1987, A. & A., 183, 16.
- Crane & Stiavelli (1992) Crane, P., & Stiavelli, M. 1992, MNRAS, 257, P17.
- Croston, Birkinshaw, Hardcastle, & Worrall (2004) Croston, J. H., Birkinshaw, M., Hardcastle, M. J., Worrall, D. M. 2004, 353, 879.
- Croston, Hardcastle, Birkinshaw (2005) Croston, J.H., Hardcastle, M.J., Birkinshaw, M. 2005, MNRAS, 357, 279.
- Croston et al. (2005) Croston, J.H., Hardcastle, M.J., Harris, D.E., Belsole, E., Birkinshaw, M., & Worrall, D.M. 2005, ApJ, 626, 733.
- Dickey & Lockman (1990) Dickey, J. M., & Lockman, F. J. 1990, ARA&A, 28, 215.
- Evans et al. (2006) Evans, D., A., Worrall, D. M., Hardcastle, M., J., Kraft, R. P., & Birkinshaw, M. 2006, ApJ, 642, 96.
- Feigelson et al. (1995) Feigelson, E. D., Laurent-Muehleisen, S. A., Kollgaard, R. I., & Fomalont, E. B. 1995, ApJ, 449, L149.
- Georganopoulos & Kazanas (2003) Georganopoulos, M., & Kazanas, D., 2003, ApJ, 589, L5
- Giovannini et al. (2005) Giovannini, G., Taylor, G. B., Feretti, L., Cotton, W. D., Lara, L., & Venturi, T. 2005, ApJ, 618, 635.
- Hardcastle, Birkinshaw, & Worrall (1998) Hardcastle, M. J., Birkinshaw, M., & Worrall, D. M. 1998, MNRAS, 294, 615.
- Hardcastle & Worrall (2000) Hardcastle, M. J., & Worrall, D. M. 2000, MNRAS, 319, 562.
- Hardcastle, Birkinshaw, & Worrall (2001) Hardcastle, M. J., Birkinshaw, M., & Worrall, D. M. 2001, MNRAS, 326, 1499.
- Hardcastle et al. (2002) Hardcastle, M. J., Birkinshaw, M., Cameron, R., Harris, D. E., Looney, L. W., & Worrall, D. M. 2002, ApJ, 581, 948.
- Hardcastle et al. (2004) Hardcastle, M. J., Harris, D. E., Worrall, D. M., & Birkinshaw, M. 2004, ApJ, 612, 729.
- Hardcastle et al. (2006) Hardcastle, M. J., Evans, D. A., & Croston, J. H. 2006, MNRAS, 370, 1893.
- Hargrave & McEllin (1975) Hargrave, P. J., & McEllin, M. 1975, MNRAS, 173, 37.
- Harris, Carilli, & Perley (1994) Harris, D. E., Carilli, C. L., & Perley, R. A. 1994, Nature, 367, 713.
- Heavens & Meisenheimer (1987) Heavens, A.F., & Meisenheimer, K., 1987, MNRAS, 225, 335
- Kaneda et al. (1995) Kaneda, H., Tashiro, M., Ikebe, Y., Ishisaki, Y., Kubo, H., Makshima, K., Ohashi, T., Saito, Y., Tabara, H., & Takahashi, T. 1995, ApJ, 453, L13.
- Kataoka & Stawarz (2005) Kataoka, J., & Stawarz, L. 2005, ApJ, 622, 797.
- Kraft et al. (2001) Kraft, R. P., et al. 2001, ApJ, 569, 54.
- Kraft et al. (2003) Kraft, R. P., Vázquez, S. E., Forman, W. R., Jones, C., Murray, S. S., Hardcastle, M. J., Worrall, D. M., Churazov, E. 2003, ApJ, 592, 129.
- Kraft et al. (2005) Kraft, R.P., Hardcastle, M.J., Worrall, D.M., & Murray, S.S. 2005, ApJ, 622, 149.
- Kraft et al. (2006) Kraft, R. P., Azcona, J., Forman, W. R., Jones, C., Hardcastle, M., J., & Murray, S. S. 2006, ApJ, 639, 753.
- Landau & Lifshitz (1989) Landau, L. D., & Lifshitz, E. M. 1989, ’Fluid Mechanics’, 2nd ed., Butterworth and Heineman.
- Leahy & Perley (1991) Leahy, J.P., & Perley, R.A., 1991, AJ, 102, 537.
- Leahy et al. (1997) Leahy, J. P., Black, A. R. S., Dennett-Thorpe, J., Hardcastle, M. J., Komissarov, S., Perley, R. A., Riley, J. M., & Scheuer, P. A. G. 1997, MNRAS, 291, 20.
- Meisenheimer & Röser (1986) Meisenheimer, K., & Röser, H.-J. 1986, Nature, 319, 459.
- Meisenheimer et al. (1989) Meisenheimer, K., Röser, H.-J., Hiltner, P. R., Yates, M. G., Longair, M. S., Chini, R., & Perley, R. A. 1989, A. & A., 219, 63.
- Meisenheimer et al. (1997) Meisenheimer, K., Yates, M. G., and Röser, H.-J. 1997, A. & A., 325, 57.
- Morganti et al. (1997) Morganti, R., Osterloo, T. A., Reynolds, J. E., Tadhunter, C. N., & Migenes, V. 1997, MNRAS, 284, 541.
- Orr & Browne (1982) Orr, M J. L., & Browne, I. W. A. 1982, MNRAS, 200, 1067.
- Popescu et al. (1992) Popescu, C. C., Hopp, U., Hagen, H. J., & Elsaesser, H. 1992, A.& A. Suppl., 116, 43.
- Rudnick (1988) Rudnick, L. 1988, ApJ, 325, 189.
- Rudnick & Anderson (1990) Rudnick, L., & Anderson, M. 1990, ApJ, 355, 427.
- Sambruna et al. (1999) Sambruna, R. M., Eracleous, M., & Mushotzky, R. F. 1999, ApJ, 526, 60.
- Schlegel, Finkbeiner, & Davis (1998) Schlegel, D. J., Finkbeiner, D. P., & Davis, M. 1998, ApJ, 500, 525.
- Simkin (1979) Simkin, S. M. 1979, ApJ, 234, 56.
- Simkin (1986) Simkin, S. M. 1986, ApJ, 309, 100.
- Spergel et al. (2003) Spergel, D., et al. 2003, ApJS, 148, 175.
- Tavecchio et al. (2005) Tavecchio, F., Cerutti, R., Maraschi, L., Sambruna, R.M., Gambill, J.K., Cheung, C.C., & Urry, C.M. 2005, ApJ, 630, 721.
- Wilson, Young, & Shopbell (2000) Wilson, A. S., Young, A. J., & Shopbell, P. L. 2000, ApJ, 544, L27.


| Observation ID | Hotspot | Frequency | Configuration | Date | Map resolution |
|---|---|---|---|---|---|
| (GHz) | (arcsec) | ||||
| AR130 | S | 4.9 | A | 1986 Jun 05 | |
| AR148 | N | 4.9 | B | 1986 Jul 13 | |
| AR148 | N | 15.0 | B | 1986 Jul 13 | |
| AR148 | S | 4.9 | B | 1986 Jul 13 | |
| AR148 | S | 15.0 | B | 1986 Jul 13 | |
| AR223 | S | 15.0 | B | 1990 Sep 14 | |
| AR208 | S | 15.0 | A | 1990 Apr 24 |
| Region | RA | DEC | Dimensions | Angle | Rate | Flux Density |
|---|---|---|---|---|---|---|
| N1 | 01:08:56.4 | +13:22:22.9 | 2.5′′2.5′′ | 50∘ | 2.70.8 | 0.270.08 |
| N2 | 01:08:56.3 | +13:22:24.9 | 2.5′′2.5′′ | 50∘ | 2.00.7 | 0.190.07 |
| N3 | 01:08:55.8 | +13:22:13.7 | 12.4′′24.2′′ | 45∘ | 2.50.7 | 0.240.07 |
| DN1 | 01:08:55.4 | +13:21:13.0 | 1.4′1.1′ | 85∘ | 11.81.0 | 1.30.1 |
| S1 | 01:08:50.4 | +13:18:26.3 | 2.7′′2.5′′ | 40∘ | 1.40.6 | 0.140.06 |
| S2 | 01:08:50.5 | +13:18:28.5 | 3.0′′3.0′′ | 40∘ | 3.10.9 | 0.320.09 |
| S3 | 01:08:50.4 | +13:18:33.0 | 4.7′′8.6′′ | 40∘ | 3.51.0 | 0.350.10 |
| S4 | 01:08:50.7 | +13:18:42.4 | 5.9′′5.9′′ | 40∘ | 4.51.2 | 0.450.12 |
| DS1 | 01:08:52.8 | +13:19:24.0 | 1.4′1.2′ | 36∘ | 16.11.0 | 1.80.1 |
| VLA (mJy) | Spitzer (Jy) | ||||||||
|---|---|---|---|---|---|---|---|---|---|
| 1.477 GHz | 4.9 GHz | 15.0 GHz | 231 GHz | 23.9 m | 7.87 m | 5.73 m | 4.49 m | 3.55 m | |
| S1 | 622. | 270. | 34. | 1554119 | 32019 | 20721 | 1469 | 996 | |
| S2 | 506. | 169. | 77790 | 18321 | 12320 | 676 | 474 | ||
| S3 | 1670. | 617. | 158. | 82 | 68 | 20 | 11 | ||
| S4 | 435. | 140. | 45 | 77 | 9 | 8 | |||
| N1 | 64. | 24. | 196137 | 2220 | 2018 | 185 | 124 | ||
| N2 | 60. | 22. | 178125 | 2622 | 3219 | 95 | 64 | ||
| N3 | 1360. | 460. | 66 | 115 | 13 | 12 | |||
| Optical (Jy) | Galex (Jy) | Chandra (nJy) | ||||||
| 6696 Å | 6500. Å | 6493.5 Å | 4800 Å | 4497.8 Å | 2297Å | 1524 Å | 1 keV | |
| S1 | 4.5 | 3.92.8 | 3.7 | 1.3 | 3.40.7 | 2.0 | 6.1 | 0.140.06 |
| Model 1 | Model 2 | |
| Power-Law plus Reflection Model | Two Power-Law Model | |
| Primary Power law | ||
| Photon Index | 1.70.2 | 1.70.2 |
| (5.40.8)1023 cm-2 | (3.50.4)1023 cm-2 | |
| Flux | 2.410-11 ergs cm-2 s-1 | 2.910-11 ergs cm-2 s-1 |
| Luminosity | 2.01044 ergs s-1 | 2.51044 ergs s-1 |
| Fe Kα line | ||
| Centroid | 6.380.04 keV | 6.370.04 keV |
| Flux | 2.410-5 photons cm-2 s-1 | 3.110-5 photons cm-2 s-1 |
| EW | 21070 eV | 17065 eV |
| Thermal Component (APEC) | ||
| 0.420.06 keV | 0.460.05 keV | |
| 2.0 | 1.0 | |
| 2.0 | 1.0 | |
| 0.150.05 | 1.0 | |
| Flux | 5.910-14 ergs cm-2 s-1 | 5.610-14 ergs cm-2 s-1 |
| Luminosity | 5.11041 ergs s-1 | 4.81041 ergs s-1 |
| Reflection Component | Second Power Law | |
| Photon Index | 1.7 (fixed) | 2.0 (fixed) |
| Relative Norm. | 2.6 | |
| 1.20.41022 cm-2 | ||
| Flux | 1.610-12 ergs cm-2 s-1 | 8.310-13 ergs cm-2 s-1 |
| Luminosity | 1.21043 ergs s-1 | 7.01042 ergs s-1 |
| /dof | 27.3/18 | 48.1/19 |
| Synchrotron | SSC | |||||
|---|---|---|---|---|---|---|
| Region | P | Radius | Length | (G) | ||
| S1 | 2.5 | 2.7 | 2105 | Section 4.1 | 195 | |
| S2 | 2.7 | 3.2 | 4105 | 1.5′′ | 2.96′′ | 79 |
| S3 | 2.8 | 2.8 | 2105 | 2.35′′ | 8.6′′ | 53 |
| S4 | 2.9 | 2.8 | 2105 | 2.95′′ | 10.1′′ | 34 |
| N1 | 2.4 | 1.3 | 2105 | 1.25′′ | 2.5′′ | 43 |
| N2 | 2.4 | 1.3 | 2105 | 1.25′′ | 2.5′′ | 42 |
| N3 | 2.9 | 1.3 | 2105 | 6.2′′ | 24.2′′ | 25 |