Spitzer/IRAC and JH Observations of h & Persei: Constraints on Protoplanetary Disk and Massive Cluster Evolution at yr
Abstract
We describe IRAC 3.6-8 observations and ground-based near-IR JH photometry from Mimir and 2MASS of the massive double cluster h & Persei complete to J=15.5 (). Within 25’ of the cluster centers we detect sources with J 15.5, sources with [4.5] 15, and sources with [8] 14.5. In both clusters, the surface density profiles derived from the 2MASS data decline with distance from the cluster centers as expected for a bound cluster. Within 15’ of the cluster centers, 50% of the stars lie on a reddened 13 Myr isochrone; at 15’-25’ from the cluster centers, 40% lie on this isochrone. Thus, the optical/2MASS color-magnitude diagrams indicate that h & Per are accompanied by a halo population with roughly the same age and distance as the two dense clusters. The double cluster lacks any clear IR excess sources for J (). Therefore, disks around high-mass stars disperse prior to yr. At least of the fainter cluster stars have strong IR excess at both [5.8] and [8]. About of sources slightly more massive than the Sun () have IR excesses at [8]. Combined with the lack of detectable excesses for brighter stars, this result suggests that disks around lower-mass stars have longer lifetimes. The IR excess population also appears to be larger at longer IRAC bands ([5.8], [8]) than at shorter IRAC/2MASS bands (, [4.5]), a result consistent with an inside-out clearing of disks.
Subject headings:
Galaxy: Open Clusters and Associations: Individual: NGC Number: NGC 869, Galaxy: Open Clusters and Associations: Individual: NGC Number: NGC 884, Stars: Circumstellar Matter, Infrared: Stars1. Introduction
The evolution of circumstellar disks sets strong constraints on the initial conditions for terrestrial and gas giant planet formation. In young stars, the presence of circumstellar disks is inferred by near-to-mid infrared (IR) emission by dust in excess of the output of stellar photospheres. While the vast majority of stars in Myr clusters have disks, the frequency of disks declines on 1-10 Myr timescales (e.g. Hillenbrand 2005; Young et al. 2004; Mamajek et al. 2004; Haisch et al. 2001). Because circumstellar dust is the evolutionary precursor to 1 km-sized planetesimals, the timescale for the disappearance of dust emission, the ’disk evolution timescale’, is an important constraint for planet formation models (e.g. Strom et al. 1989; Hillenbrand 2005; Alibert et al. 2005; Currie 2005).
Recent observations of young ( 10 Myr) stars suggest that the evolution timescale may depend on stellar properties and locations within the disk. K band () excess from the inner () disk is relatively uncommon around both massive and very low mass stars (Hillenbrand et al. 1998). The 5 Myr Upper Sco OB association also exhibits a mass-dependent frequency of disks: sources with IR excess at 8 and at 16 appear to be more prevalent around K/M and B/A stars than for F and G stars (Carpenter et al. 2006). Spatially resolved, mid-IR observations of Myr T Tauri stars (McCabe et al. 2006) show that many disks with strong mid-IR emission lack near-IR emission, providing evidence for a location-dependent disk evolution. The drop in near-IR circumstellar dust emission may be explained by grain growth, which is probably faster in the inner disk regions due to higher midplane densities and orbital frequencies (e.g. Dullemond & Dominik 2005). Circumstellar gas dispersal by UV photoevaporation (Clarke et al. 2001; Alexander et al. 2006) and planetesimal formation by gravitational instability (Youdin & Shu 2002; Youdin & Chiang 2004; Currie 2005) may also result in a location-dependent evolution and, thus, a wavelength-dependent timescale for the disappearance of near-IR emission.
Multiwavelength near-to-mid IR observations of evolved ( Myr), massive ( 1000 members) clusters are required to measure the disk evolution timescale as a function of stellar mass and disk properties. The double cluster h & Persei, the most massive, evolved open cluster within 3 kpc, provides a rich laboratory to study disk evolution in more detail. Starting with the initial study of Oosterhoff (1937), there has been much debate concerning the age, distance, and stellar content of the clusters (e.g. Borgman & Blaauw 1964; Wildey 1964; Schild 1967; Crawford et al. 1970; Vogt 1971; Tapia et al. 1984; Marco & Benabeau 2001; Capilla & Fabregat 2002). Recent work (Keller et al. 2001; Slesnick et al. 2002, hereafter S02; Bragg & Kenyon 2005, hereafter BK05) has converged on a nearly identical age for both clusters, 12-13 Myr, a common distance of 2.34 kpc (a distance modulus 11.85), a low extinction of E(B-V)0.5 uniform across the clusters (BK05), and an initial mass function (IMF) of massive stars consistent with results for other young, massive clusters (Massey 2003; Bragg 2004). Although the clusters have similar masses of 4000 (h Per) and 3000 ( Per), the internal dynamical structure of the clusters may be very different (BK05), with some evidence for mass segregation in both clusters (S02, BK05).
While numerous optical photometric and spectroscopic studies of h & Persei exist, the cluster has yet to be explored in detail in the near-to-mid IR. Previous IR observations have been shallow, JK 11-13 (Tapia et al. 1984; Bragg & Kenyon 2002, respectively), and concentrated on understanding the population of Be stars. While some constraints have been placed on the stellar population of h & Per, the population of circumstellar disks remains unprobed. Thus, its potential to inform disk evolution theories remains untapped.
In this paper, we describe the analysis of the first deep IR survey of h & Persei. The survey combines 2MASS All-Sky Survey (2MASS) and Infrared Array Camera (IRAC) data covering the entire double cluster with deeper near-IR data of selected cluster regions from the Mimir camera at Lowell Observatory. With approximate completeness limits in JH about 3-5 magnitudes deeper than BK02 and Tapia et al. (1984), respectively, the 2MASS survey reaches stars with masses smaller than the limits of all optical surveys except for Keller et al. (2001) with less interference from the large line-of-sight extinction. When combined with longer wavelength (3.6, 4.5, 5.8, & 8 ) Spitzer/IRAC data, 2MASS and deeper near-IR surveys allow probes of disk evolution for stars with ages 10-15 Myr and masses 1.3 . From our analysis we hope to provide valuable input for circumstellar disk and massive cluster evolution models.
Our results provide good evidence for two populations of 13 Myr old stars in the direction of h & Per. In both clusters, the sky surface density declines approximately inversely with distance at 20’ from the cluster centers, which is consistent with results derived from optical data (Bragg & Kenyon 2005). At distances beyond 20’ from the cluster centers, the surface density is consistent with the background density. CMDs indicate that nearly half of the stars within 15’ of the cluster centers lie on a reddened 13 Myr isochrone. In regions of lower surface density 15’–25’ from the cluster centers, however, roughly 40% of the stars lie on the same isochrone. Thus, the double cluster may be accompanied by an extensive halo population, much like the Orion star-forming region, that has roughly the same age and distance as bone fide cluster members.
While the majority of sources have photospheric IRAC colors through 8, the cluster and halo population associated with h & Persei have a small IR excess population. Disks around stars with () are extremely rare: disks around massive stars disperse by years. The IR excess population is larger for fainter sources down to J=15.5; disks around lower mass stars may have longer lifetimes. The IR excess population also grows progressively larger with longer IRAC wavelengths, a result consistent with an inside-out clearing of protoplanetary disks.
We begin with a description of the data and reduction in Section 2 and discuss the analysis of the near-IR data in Sections 3 and 4. In Section 5, we develop our technique to identify IR excess souces and use this approach to make several estimates of the fraction of IR excess sources in the cluster. We conclude with a brief summary in Section 6.
2. Observations and Data Reduction
2.1. Near-Infrared Ground-Based J,H, & data from 2MASS
2MASS is an all-sky survey with uniform, complete photometry at J, H, and Ks (Skrutskie et al. 2006). The survey has 10 sensitivity for point sources with J 15.8, H 15.1, and Ks 14.3. For sources with 10 detections, the survey is more than 99% complete and more than 99.95% reliable, with 1 astrometric accuracies of at least 0.1 arcsec relative to the Hipparcos reference frame for sources with Ks 14. Although the 2MASS survey used cameras with 2 arcsec pixels, multiple observations of each sky position yields images with a nominal resolution of 1 arcsec.
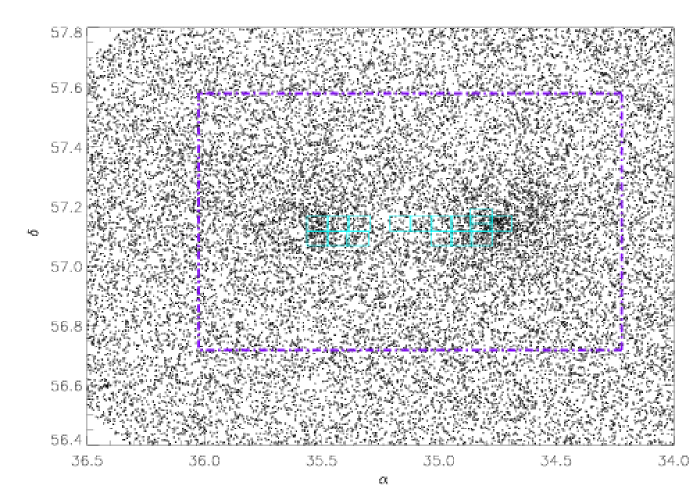
We downloaded data for h & Persei from the 2MASS point source catalog (PSC) using the IRSA web interface at IPAC111http:irsa.ipac.caltech.edu. The catalog includes 31,000 sources with 5 detections within 1 deg of (l=135o, b=-3.7o), which is a point midway between the two clusters. A skymap from the 2MASS PSC clearly shows the two clusters as dense concentrations of stars (Figure 1). There are 11,000 sources within 25’ of either cluster center.
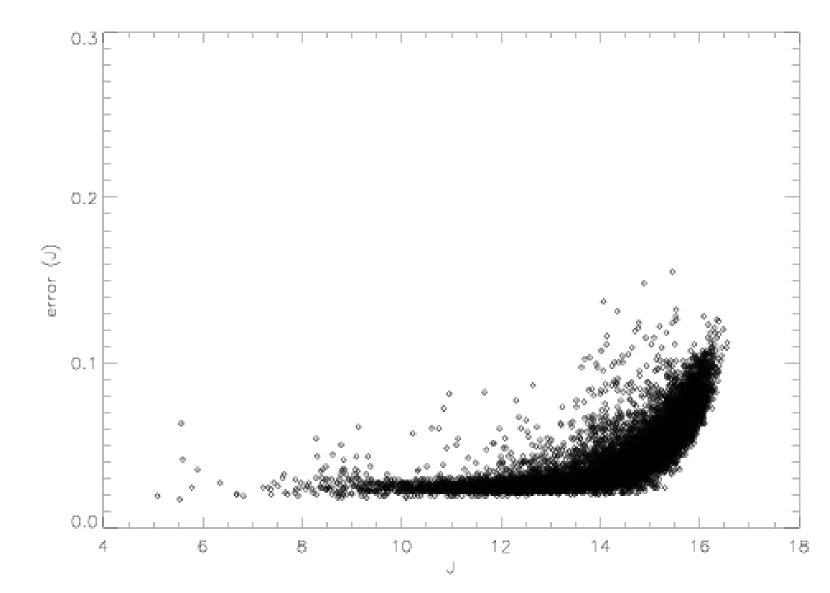
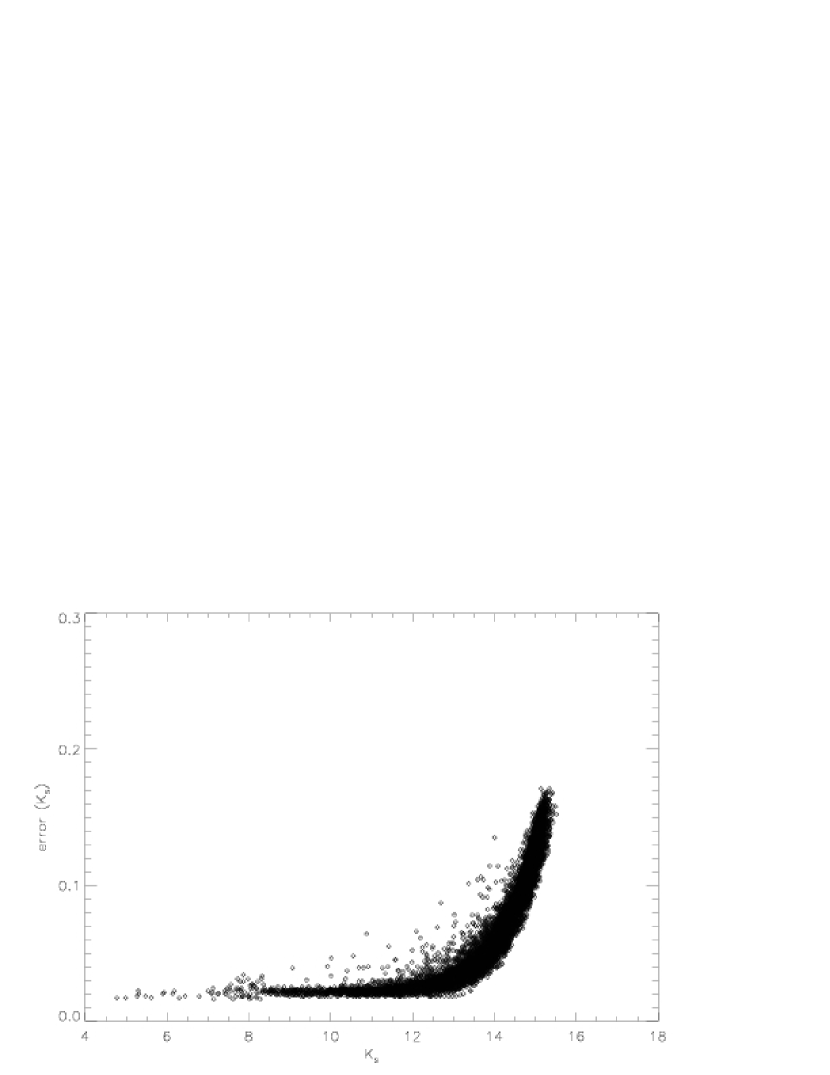
Figure 2 shows the magnitude and error distributions for J and Ks using stars within 25’ of the cluster centers. At J (), the number counts monotonically increase to J = 15.5 (Ks = 14.8) and then turn over. Both of these peaks are somewhat brighter than the nominal 10 sensitivity limits, suggesting that confusion of sources in the galactic plane or the cluster centers might limit the source counts. However, both clusters show secondary peaks at J 14.5 and at K 14. We show below that stars within the two clusters produce these peaks.
2.2. Near-Infrared Ground-Based J, H, & data from Mimir
The relatively low spatial resolution and the shallow peaks in the JHKs magnitude distributions of the 2MASS data prompted us to acquire additional near-IR photometry. We used Mimir, a multifunction IR instrument (http://people.bu.edu/clemens/mimir/) at the f/17 focus of the 1.8m Perkins telescope at Lowell Observatory (Table 1). Mimir uses a Mauna Kea JHK filter set and covers a 3’3’ field with 0.18” pixels in this configuration. The total on-cluster coverage was square arc-minutes (Figure 1). A series of flats, darks, and biases was taken at the beginning and end of each night. The telescope was dithered by 30” for each pointing where a series of three 10-second exposures were taken. In most cases the pointings were too crowded to construct sky frames from median filtering. Therefore, we took a series of three 10-second dithered pairs of exposures for sky frames 7’ in right ascension and declination away from each dithered pair of on-cluster pointings.
We followed a standard image processing procedure. First, we subtracted a dark frame from each image and divided by a dark-subtracted and normalized flat field. Next, we subtracted each object frame by the appropriate median-filtered sky frame. We used a custom IDL procedure to interpolate over bad pixels as well as image/detector artifacts unique to each frame. We used another custom IDL procedure (similar to ’imcombine’ in IRAF) to stack 10-second frames together. Up to 18 individual frames were stacked together for each pointing yielding a total integration time of minutes each in a given field. We obtained longer integrations of 7 minutes for two of the fields, one each adjacent to the h & Per centers, typically improving the completeness limits by magnitudes. Each stacked image was visually inspected for errors in offset computation and residual image artifacts.
We identified sources and extracted aperture photometry using SourceExtractor (SE; Bertin & Arnouts 1996). Each potential source was convolved with a 9x9 gaussian filter (5-pixel FWHM) and sources on image edges were removed to eliminate spurious detections. We typically used a 12 pixel diameter for aperture photometry in all bands with a tendency to use smaller apertures for K data (due to smaller point-spread functions) and subtracted the background from a filtered, global background map. Sources from each dithered pair were matched to generate a final list of detections in each band.
To derive an absolute calibration, we matched Mimir sources with 30-40 2MASS zero-color sources on each frame. Once we established the zero-point, these sources had 1% offset as a function of JHKs. For redder sources, we measured a reliable offset between K(Mimir) and Ks(2MASS) of 3% on sources with J-K 1. Applying the conversions from Carpenter et al. (2001) to correct Mimir colors to 2MASS colors eliminated the offset. For the ensemble of Mimir sources, we estimate absolute uncertainties of 0.025 mag relative to 2MASS in all bands.
To derive coordinates for the Mimir sources, we relied on accurate 2MASS astrometry. Although tests with standard packages, such as WCStools, showed that the Mimir fields were well-oriented north-south and showed little distortion and rotation, the small Mimir fields made robust astrometric solutions difficult. Because our main goals for astrometry were matching 2MASS sources and estimating incompleteness, we computed J2000 coordinates for Mimir sources by matching several 2MASS sources per field and deriving relative coordinates using the known pixel scale. Comparisons of all Mimir sources with 2MASS counterparts yields an average positional offset of 0.8” 0.4”, with little evidence for systematic offsets as a function of position on the Mimir detector. Although better coordinate accuracy might be possible with complete astrometric solutions for all Mimir fields, this positional uncertainty is sufficient for robust source matching even in the centers of each cluster.
Figure 3 shows the J and Ks magnitude distributions for the Mimir data. These data reach 0.5 mag deeper than the 2MASS data, with clear peaks in the counts at J = 16 and at Ks = 15.5. Of the 1000 Mimir detections, 650 sources with J 16 have 5 detections in all three bands. Multiple observations of 50 sources verified these uncertainties. At the 2MASS 10 sensitivity limit, we recover all 2MASS sources. At this limit, the typical magnitude difference was J 0.1 mag and K 0.15 mag, which is consistent with the expected error distribution.
Figure 3 shows the same secondary peaks as the 2MASS data. For a cluster age of 13 Myr, a distance modulus of 11.85, the Siess et al. (2000) isochrones, and the color conversion table from Kenyon & Hartmann (1995), the peaks at J = 14.5 and Ks = 14.25 correspond to stars with masses . With these assumptions, stars at the J = 16 limit have masses of 1.1–1.2 . In Section 3, we restrict our analysis of the Mimir data to those 650 sources detected at all bands.
2.3. IRAC 3.6-8 data
We obtained observations of h & Persei on January 18, 2004 with IRAC (Fazio et al. 2004) on the Spitzer Space Telescope. The IRAC survey covers about centered on = 02:20:29.166, = +57:12:27.54 (Figure 1). There is a 7 arcmin offset between the channel 1/3 and channel 2/4 mosaics. We used the 12s high dynamic range mode to obtain two frames in each position, with 0.4s and 10.4s integration times. The observation of each field was repeated with a small offset, which allowed 20.8s integration time for each position. We identified image artifacts and cosmic ray hits by comparing the two observations.
The data were taken during a period of above-normal solar activity. To remove cosmic rays we evaluated two approaches. First, we took the conventional steps of mosaicing and extracting sources, relying on the cosmic ray circumvention features of the software. We used PhotVis (v. 1.09) for source finding and aperture photometry (see Gutermuth et al. 2004). The radii of the source aperture, and the inner and outer sky annuli were 2.4, 2.4, and 7.2 arc-seconds respectively. In the second approach, we used a custom IDL routine developed by T. C. to extract sources individually from the BCD data prior to mosaicing, applied array-location-dependent photometric corrections (see Quijada et al. 2004; http://ssc.spitzer.caltech.edu/irac/locationcolor), removed sources near image edges, and interpolated over pixels flagged as cosmic ray hits/image artifacts in the first method. This approach degraded the detection limit but allowed better control of the cosmic ray artifacts than by mosaicing alone. Source Extractor aperture photometry was performed using a 4 pixel diameter aperture; the background count level and rms was computed from the filtered, global background pixel map.
We compared the results of the two methods and examined the raw data to determine the best method for each band. This comparison included examining the number of sources with colors bluer than Rayleigh Jeans and the scatter in color-color plots, both taken as indicators of cosmic ray effects. The source extraction prior to mosaicing provided the most reliable results in bands 1 and 2 ([3.6] and [4.5]), while mosaicing first was better in bands 3 and 4 ([5.8] and [8]). The slightly larger PSFs in the latter two bands provided enough pixels for the circumvention software to distinguish cosmic rays from real point sources. Since the intrinsic ratio of signal to noise is higher at [3.6] and [4.5] than [5.8] and [8], the degradation from extracting sources prior to mosaicing was not serious for the shorter wavelength bands.
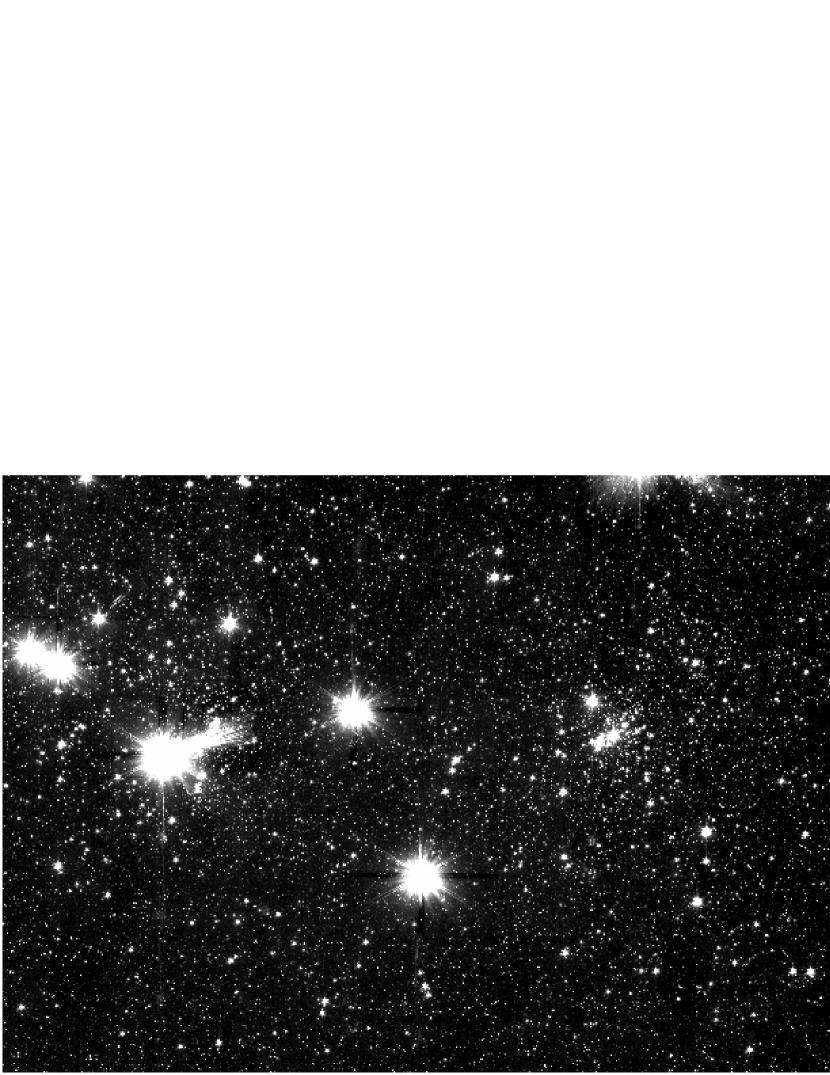
We calibrated the photometry using large aperture measurements of standard stars obtained during h & Per observations, applying an aperture correction for each channel to account for the difference between the aperture sizes used for standard and h & Per photometry (see Reach et al. 2005 for calibration details). The brightest sources (th magnitude) are saturated even in the short exposure frames. Figure 4 shows the mosaic image of the [3.6] channel at low contrast.
We bandmerged the data using a sub-arcsecond matching radius to minimize the contamination of any residual cosmic ray hits mistakenly identified as ’sources’ by the source extraction algorithms of SE and PhotVis.
To remove sources that are likely AGN or galaxies with aromatic emission, we rely on published optical data, our JH data, and IRAC colors. Requiring 2MASS, Mimir, or optical counterparts eliminated most highly reddened extragalactic sources. In the IRAC bands, typical field AGN have [4.5] 14 and [4.5]-[8] 1.25 (Gutermuth, unpublished); galaxies with aromatic emission lie to the right of a line from ([3.6]-[5.8],[4.5]-[8]) (0,1) to (1.5,3) with [4.5]-[8] 1 as well as ([4.5]-[5.8],[5.8]-[8]) (0,1) to (1,2.25) with [5.8]-[8] . We identify very few sources with optical/near-IR counterparts and [4.5]-[5.8] 1 or [5.8]-[8] . Thus, extragalactic sources have negligible impact on our analysis.
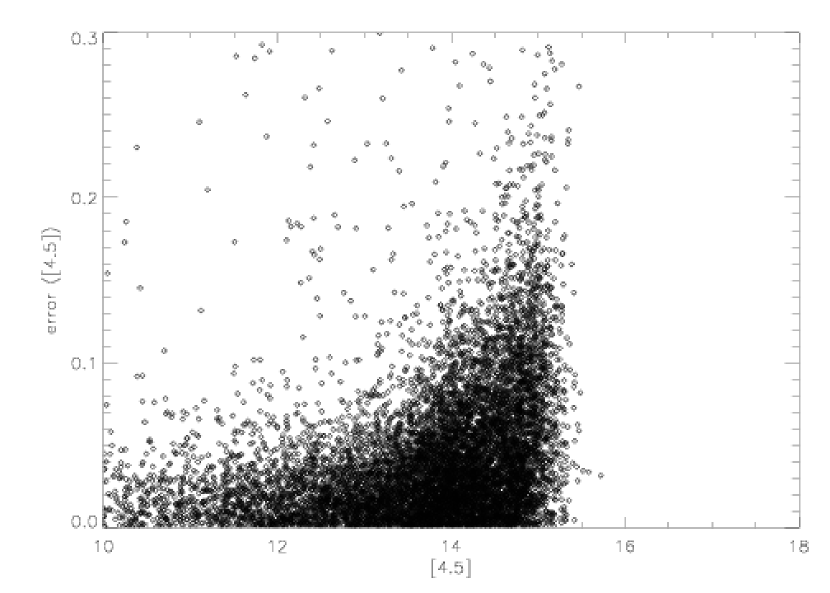
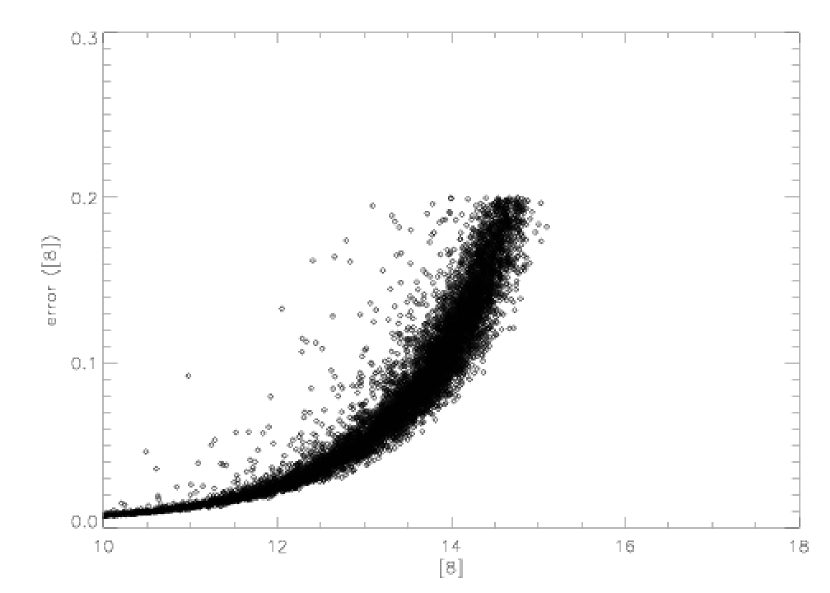
Figure 5 shows magnitude distributions for the four IRAC bands and error distributions for [4.5] and [8]. At [3.6] and [4.5], the distributions have a monotonic rise to [3.6] [4.5] 14, a broad plateau at [3.6] [4.5] 14-15, and a sharp drop at [3.6] [4.5] 15. The longer wavelength IRAC bands have steeper magnitude distributions and brighter magnitudes with peak count levels ([5.8] 14.25 and [8] 13.75). The errors shown in the IRAC bands demonstrate that the average photometric uncertainty is well below 0.2 ( 5) at least through [4.5]=15 and [8]=14.5.
As with the 2MASS and Mimir data, the IRAC data show evidence for a secondary peak in the magnitude distributions. This peak lies at [3.6] [4.5] 14 and [5.8] 13.75. Adopting the Siess et al (2000) isochrone and the Kenyon & Hartmann (1995) colors for main sequence stars, the peaks at JH and [3.6]-[5.8] are consistent with cluster stars having masses 1.3 at a distance modulus 11.85.
Figure 6 shows our estimate of sample completeness, where we plot the ratio of sources detected in both IRAC and 2MASS to those detected in 2MASS for each IRAC band as a function of 2MASS J magnitude (for J 15.0). The sample oscillates between 90 and 100% complete in each IRAC band at magnitudes brighter than expected based on where the source counts peak in each band. This discrepancy, most noticeable in the [4.5] band, is due to the very small matching radius employed in combining the 2MASS and IRAC data sets, not photometric errors. If the matching radius is increased, the completeness level in the IRAC bands increases at the expense of larger cosmic ray contamination. Because our goal is to estimate the fraction of sources with small IR excesses, we prefer to analyze a smaller sample with more robust colors. When the -[IRAC] colors are analyzed in Section 5, we consider the effect that uneven sample completeness has on our estimates of the IR excess population. Table 2 lists our photometry from 2MASS and IRAC.
3. Ground-based JH Data Analysis
To make reliable estimates for the fraction of cluster members with IR excesses, we must (i) derive the fraction of stars in either cluster, (ii) derive robust criteria for defining an IR excess, and (iii) combine the two criteria into clear estimates for the excess fraction. In this section, we consider two methods for estimating the fraction of stars within each cluster, number counts and model isochrones. The first method measures the number of stars in the clusters relative to the stars in the background population. Model isochrones allow us to estimate the fraction of stars with magnitudes and colors that are consistent with the magnitudes and colors of stars on a 13 Myr isochrone (S02). Both approaches yield similar results.
With probabilities for cluster membership established, we then consider whether any cluster stars have near-IR excesses.These data demonstrate that the vast majority of sources brighter than the completeness limits have colors consistent with photospheric colors at 1-2 m. Thus, we find no evidence for near-IR excess sources in h & Per for , which correspond to cluster stars with masses 1.3 .
3.1. 2MASS archival JH data: density distribution and cluster membership
3.1.1 Density Distribution of Sources on the Sky
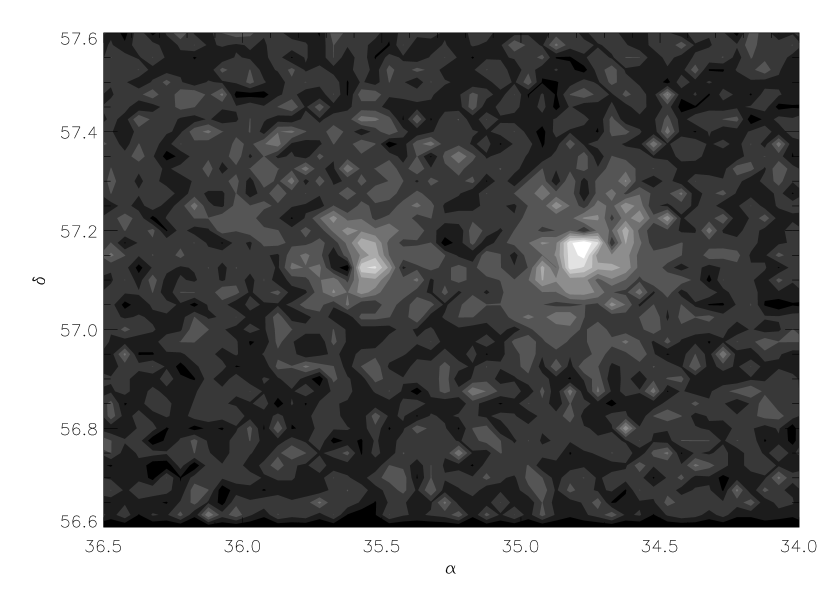
To investigate spatial inhomogeneities and other structure, we computed the projected sky surface density of stars, a standard approach for deriving the properties of star clusters (e.g. Binney & Tremaine 1987). We restrict our analysis here and in Section 3.1.2 to sources brighter than J=15.5. To derive the surface density of stars (top panel of Figure 7), we counted stars in 1.5 1.5 arcmin bins, displaying the density in 10 increments from 0-90 of the peak surface density of 15 arcmin-2 in the center of h Per. This surface density is higher than the 7-8 arcmin-2 peak found by BK05, who were restricted to sources with spectral types earlier than A5. Based on J magnitude to spectral type conversions using the Siess et al. (2000) isochrones and preliminary MMT/Hectospec spectroscopy (Currie et al. in prep), our population includes sources with spectral types earlier than K0.
Aside from the strong peaks, each cluster has considerable small-scale structure. BK05 report a kidney-shaped isodensity contour in Per, a fairly symmetric inner core surrounded by a rectangular isodensity contour in h Per, and other structures 5-10 arcmin from the cluster centers. With the deeper 2MASS data, these structures are clearly visible at of the peak density and well above the median background level of 2.7 arcmin-2. The mean level is arcmin-2 and the background noise fluctuates by 0.65 arcmin-2.
Other asymmetric structures are also apparent 10-15 arcmin from the cluster centers, which may suggest that both clusters are asymmetric on large scales, 10 pc at a distance of 2.34 kpc. However, features 15’-25’ from the cluster centers have amplitudes comparable to the noise level and thus might not be real. Deeper near-IR data could verify the existence of lower-amplitude structure.
The bottom panel of Figure 7 shows the radial surface density plots derived from the 2D map, using 1’-wide half-annuli (facing away from midway point of h & Per). In both clusters, the surface density drops rapidly from 2.5 to 10 arcmin and then slowly merges into the apparent background level arcmin from the cluster centers. The surface density reaches the median background density level of 2.7 arcmin-2 (=0.278 arcmin-2; J 15.5) 20-25 arcmin away from the h& Per centers at , and , respectively (BK05). Although the clusters clearly are not symmetric, we can derive a reasonable estimate of the fraction of stars within the clusters by integrating the surface density above this background level. This approach yields a cluster population of 2000 stars, 35% of the total population within 15 arcmin of the cluster centers.
Although the median background level is reached ’ there is a small gradient in the radial surface density profile from arcmin (e.g. to the limit of our sample), though no clear general gradient across the field along constant right ascension or declination. There are also is at least one region beyond 10’ from either cluster center (from 12 to 20’ away from Per) that may extend above its surroundings background level on scales larger than size scale of the background fluctuations. This behavior motivates us to investigate the stellar content within the ’background’ (beyond ’ from the cluster centers). Thus, we now compare the color-magnitude (CMD) diagrams of the cluster-dominated and low-density regions.
3.1.2 Possible Evidence for a Halo Population of year old sources in the vicinity of h & Persei
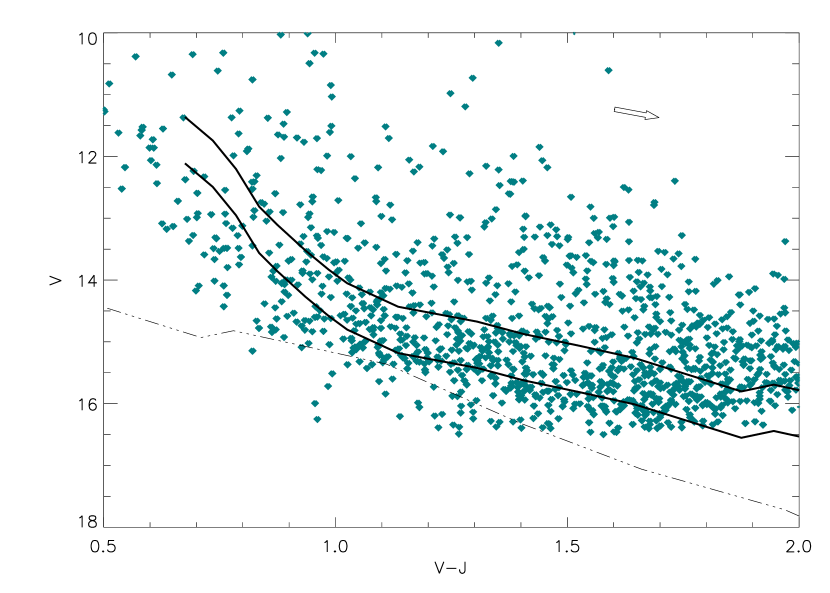
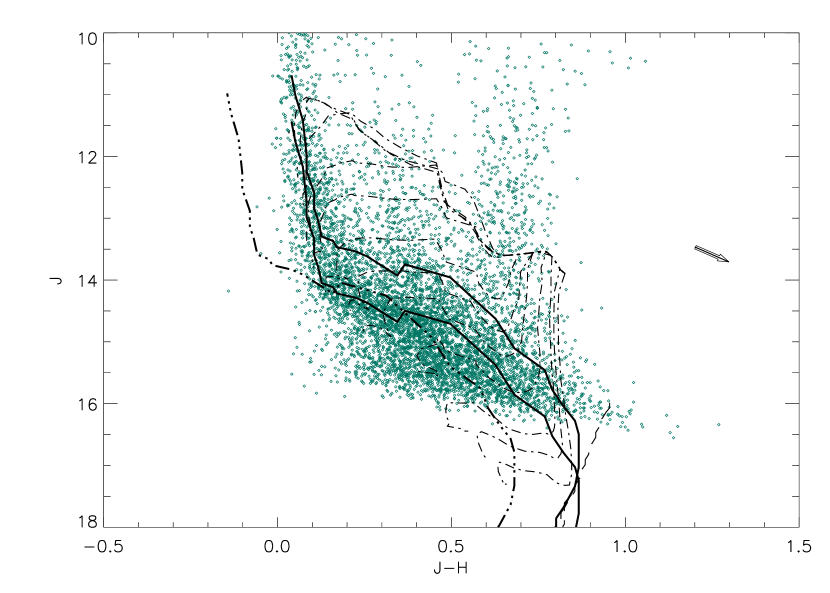
With no evidence for a significant age spread (S02) or patchy extinction (BK05) across the clusters, we can use the cluster’s isochrone to constrain cluster membership. We construct V/V-J and J/J-H color-magnitude diagrams, using data from S02 and 2MASS. For both color-magnitude diagrams, we adopt an age of 13 Myr for the cluster (S02) using theoretical isochrones from Siess et al. (2000). For the J/J-H diagram we also used pre-main sequence tracks from Bernasconi et al. (1996) for comparison, which show excellent agreement. To compute the cluster reddening, S02 restricted their analysis to the cluster nuclei and found a median reddening of E(B-V) 0.56. Using a larger spatial sample of sources, BK05 computed a slightly smaller E(B-V) of 0.52. Since the larger spatial sample of BK05 is more similar to ours, we consider this estimate more appropriate for our sample and adopt it. This choice has negligible bearing on our results since the reddening is low and yields an age within 1 of S02’s value (Bragg 2004). Converting from optical to infrared extinction via Bessel & Brett (1988) yields E(J-H) 0.185 for E(B-V) 0.52.
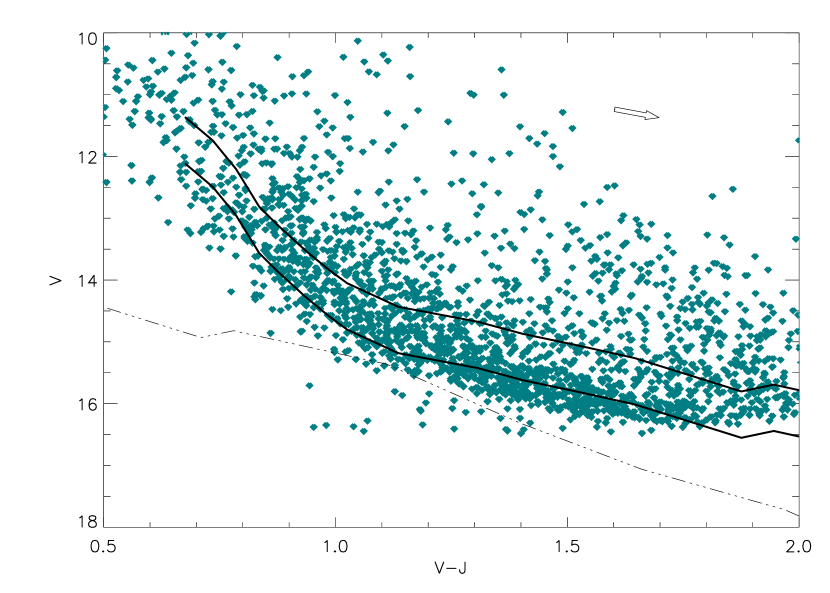
If the clusters have a small spread in age, the fraction of stars identified as being on the 13 Myr isochrone should be similar to the estimate derived from the number counts in Section 3.1.1. For objects with J 14.5, the V/V-J diagram provides an efficient method to test for cluster membership. The S02 V data have corresponding 2MASS J limits of 14.5; the diagonal slope (see Figure 8, top panels) of the isochrone on V/V-J allows good detection of blue, early spectral type (typically) background, non-member sources and very red, foreground non members. For objects with J 14.5, the V data become incomplete. However, as shown in Figure 8 (bottom panels), the J/J-H CMD isochrone is sensitive to membership in this magnitude range and thus provides a good substitute for the optical CMD. The two CMDs are used together to identify sources of the same age and distance of h & Per brighter than J = 15.5. We divide our sample into two main populations: an ’on cluster’ population corresponding to sources within 15’ of the cluster centers and a low-density population for sources between 15’ and 25’ away. We chose 15’ for the first population because it corresponds to 3-4 cluster core radii (BK05). Based on our density distribution analysis, this distance corresponds to the point where the typical stellar density begins to approach the median background level. The 25’ outer radius for low-density regions is chosen primarily because it fully samples our entire IRAC coverage. According to the modified Hubble law distribution ( ) of cluster members, the cluster density 4 core radii away should be 6% of the peak density. If the number of stars in a circle of diameter 1 arcmin at the center is N, an annulus of 1 arcmin width at 15 arcmin should have roughly 4-5 N stars in the cluster and roughly 25-30 times that many in the ‘background’. The fraction of stars in the cluster beyond 15’ to 25’ should be over twice as small ( 0.01-0.03). Therefore, if h & Persei sit in a background of non-related field stars, the low-density regions beyond 15’ will be dominated by sources of different ages and distances than sources in h & Per. The density of sources tracking the isochrone should be far larger within 15’ than outside 15’.
The V/V-J diagram for sources within 15’ of the h & Persei cluster centers (Figure 8, top left panel) clearly shows a distribution of sources tracking the 13 Myr isochrone for V=12-16. The isochrone slightly bends at V 15-15.5. Foreground sources are clearly visible above the isochrone. Figure 8 (bottom left panel) shows the J/J-H CMD diagram for all sources within 15’. Sources with J 14.5 track the reddened isochrone well except for some sources with J-H 0.5 that are probably foreground M dwarfs or background M supergiants. The isochrone ’bends’ horizontally at J . Almost all sources to J = 15-15.5 fall along the 13 Myr isochrone or are redder. Although many sources with J 15.5 may follow the isochrone, the larger errors ( 0.1) and increasing population of blue sources make it hard to measure the cluster population. Thus, we restrict our analysis to stars with J 15.5.
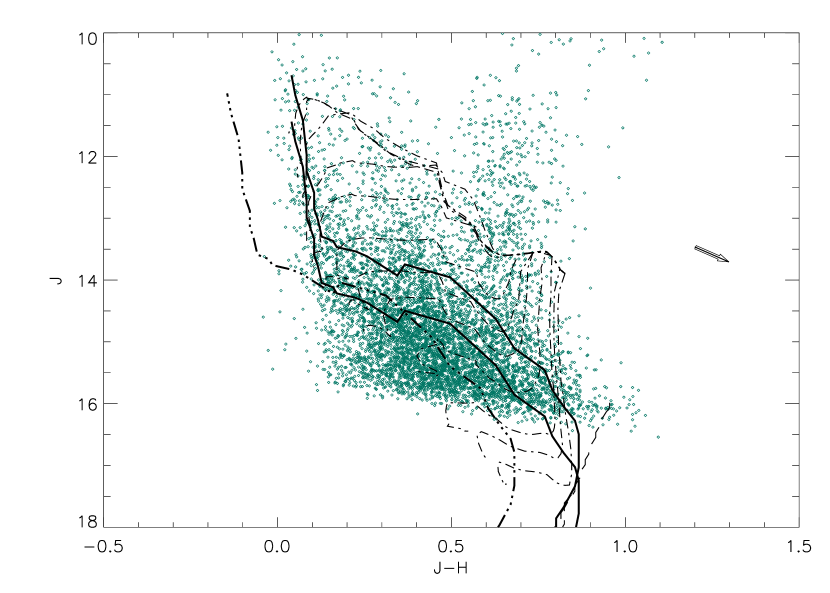
The top-right panel of Figure 8 shows the V/V-J diagram for sources both 15’-25’ from each cluster center and greater than 15’ from both centers. While sources appear quite scattered around the isochrone for V 14, there is a significant population of sources between the two isochrones (for single and binary stars) for V = 14 - 16.5. There are also many sources between the corresponding isochrones in the J, J-H CMD (Figure 8, bottom right panel). From analysis of the projected radial density distribution, regions 15’ from either center should contain mostly background or foreground, non-member sources. The fact that the fainter of these sources loosely follow the 13Myr isochrone for the cluster suggests that there may be a larger region of enhanced formation of low mass stars in the same general direction. This behavior would be similar to the situation with the Orion cluster, for example.
We now quantify the fraction of sources in the h & Persei 2MASS coverage that are consistent with cluster membership by counting the number of stars that are, within photometric errors, lying on the V/V-J and J/J-H isochrones and the number lying outside them. We require that sources be within 0.3 magnitudes ( 5 added in quadrature) of the isochrone to count as a member. This procedure neglects colors expected for unresolved binaries, which would increase the source brightness for a given color. We compare the number of h & Per sources less than 15’ away from either cluster core and the number between 15’ and 25’ away. Sources 15’ from one cluster and 15’ from the other cluster were not counted.
From the V/V-J diagram, of sources within 15’ of the cluster centers have a CMD position consistent with cluster membership ( 767 with J 14.5). In the sample of stars at 15’-25’ from the cluster centers, lie in a similar zone on the CMD. About of sources within 15’ have a CMD position consistent with a 13 Myr isochrone ( 2600 sources with J 15.5) on the J/J-H diagram. Stars near the 13 Myr isochrone between 15’ and 25’ away from either center make up a comparable fraction . If we group the two populations together of the 11,000 sources are of the same age, distance and reddening as h & Persei. Therefore, within 25’ of the cluster centers the population of sources with J 15.5 lying near a 13 Myr isochrone is 4700: 2500 closer to h Persei and 2200 closer to Persei. Estimates for the fraction of 13 Myr sources from the J/J-H diagram are comparable ( 27 and 20 for 15’ and 15-25’ respectively) to those from the V/V-J diagram in the appropriate limit (J 14.5): the lower fractional memberships for J 14.5 are likely caused by a high number of foreground K and M stars and background M supergiants. Thus, to within 10-15, both the V/V-J (J 14.5) and J/J-H (J 14.5, 15.5) CMDs predict comparable estimates of the percentage 13 Myr sources at the distance of h & Persei. Furthermore, the percentage of sources lying on the 13 Myr isochrone in the low-density regions (15’-25’) and high-density regions ( 15’) are consistent within 10 of one another. If the ’background’ were dominated by foreground and background sources then the percentage of 13 Myr sources in the high-density regions should be much larger than in the low-density regions.
It is difficult for a random distribution of foreground/background stars with a wide range of ages and spectral types to mimic a yr isochrone, so we conclude that at least some of the ’background’ population includes young stars with nearly identical ages and distances as those in the two clusters. From the poorer definition of the cluster along the isochrones in the right panels of Figure 8, these stars may be distributed over a few hundred parsecs along the line of sight, centered roughly on the clusters and probably associated with them. The population of sources roughly tracking the 13Myr isochrone in J/J-H only slowly disappears by 60’ from the cluster centers (not shown), suggesting a diameter of about 100 pc. However, while it may be possible that the halo population extends to 60’ away from h & Per, carefully quantifying its disappearance, particularly for the upper main sequence at 13 Myr, requires wider angle imaging and deep spectroscopy and is beyond the scope of this paper.
The existence of a halo population of stars at about the same age, distance, and reddening as those within the cores of h & Persei was considered by Schild (1967) based on spectroscopy and photometry of the brightest sources; S02 also noted that, to V 16, the optical colors of bright sources beyond 5’ of either cluster center and those within 5’ of either cluster center appeared quite similar. Our result, probing stars slightly fainter than those studied by S02 and over larger spatial area, is broadly consistent with both of these references. For the rest of the paper, we shall restrict our analysis to sources within 25’ of the cluster centers. We use the V/V-J and J/J-H diagrams to identify sources within this radius that appear to have the age, distance, and reddening of h & Per.
3.2. JH color-color diagrams from 2MASS and Mimir
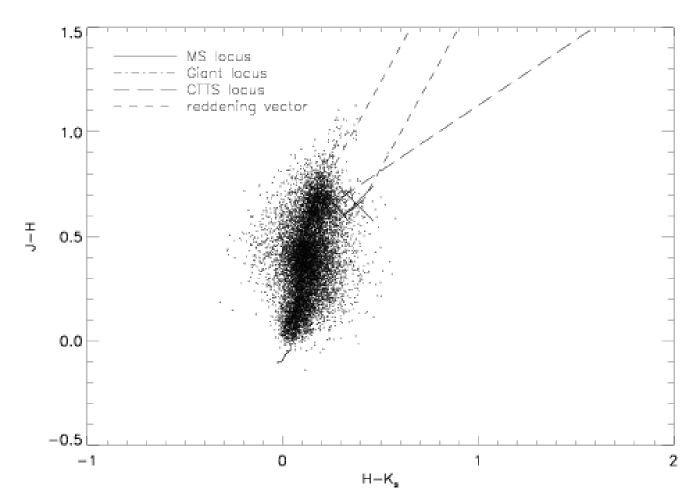
Now we investigate the near-IR 2MASS colors of all sources within 25’ of the cluster centers ( 11,000) with J 15.5. The color-color diagram is shown in Figure 9 with the main sequence locus, giant locus, classical T Tauri locus, and reddening bands. Stars with J-H 0.0-0.25 and H- 0.0-0.3 will include Be stars with near-IR excess from optically-thin gas (Dougherty et al. 1991,1994). Excesses around later-type stars with J-H 0.3 and H- 0.35 are more likely to have near-IR excess emission from warm dust. The vast majority of sources have photospheric colors. Sources off the locus are distributed evenly on both sides, suggesting that photometric errors may be responsible for any - ’excess’. To characterize the population more accurately and (later) search for near-IR excess sources at we rely on Mimir data with deeper completeness limits at .
We analyze Mimir sources with 0.2 and J 16. Figure 10 shows the color-color diagram for all sources in the Mimir survey. The vast majority of sources fall along the main sequence locus. Figure 11 shows data separately for h Persei and Persei; h Persei has more sources with a slight excess for small J-H colors ( 0.3). The horizontal spread in color is noticeably smaller for sources with 0.1. Many sources have colors consistent with disk excess emission (H- 0.4 or redder). However, restricting ourselves to sources that may be cluster members based on the J/J-H diagram, the IR excess population from H- through J=15.5-16 is extremely small: less than .
4. IRAC Analysis: 2MASS -[IRAC] colors & IRAC-only colors
To learn whether excesses are more common at longer wavelengths we consider the IRAC data. Restricting our analysis to sources within 25’ of the cluster centers, we have 7000 sources with 5 detections at [3.6] and [4.5]; 5000 of these have 5 detections at [5.8] and [8.0]. To minimize contamination due to large errors, we restrict this sample to the sources with ,[IRAC] 14.5.
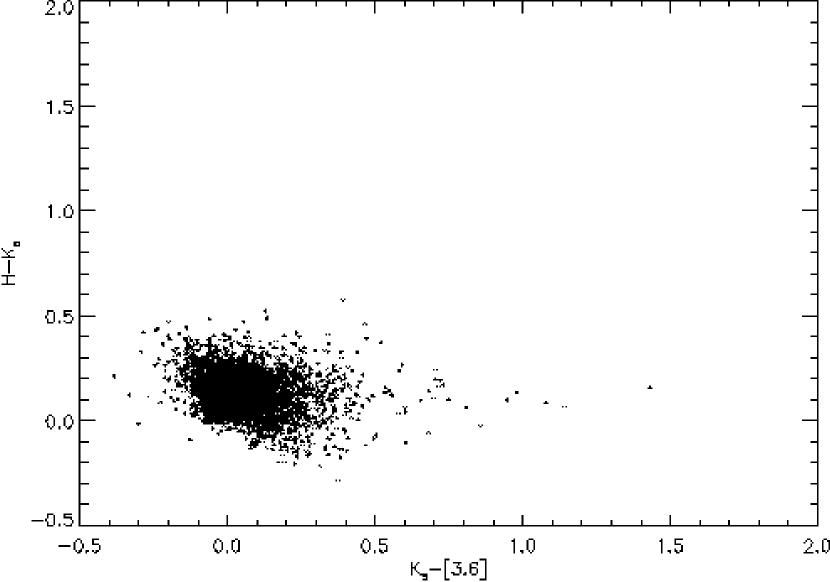
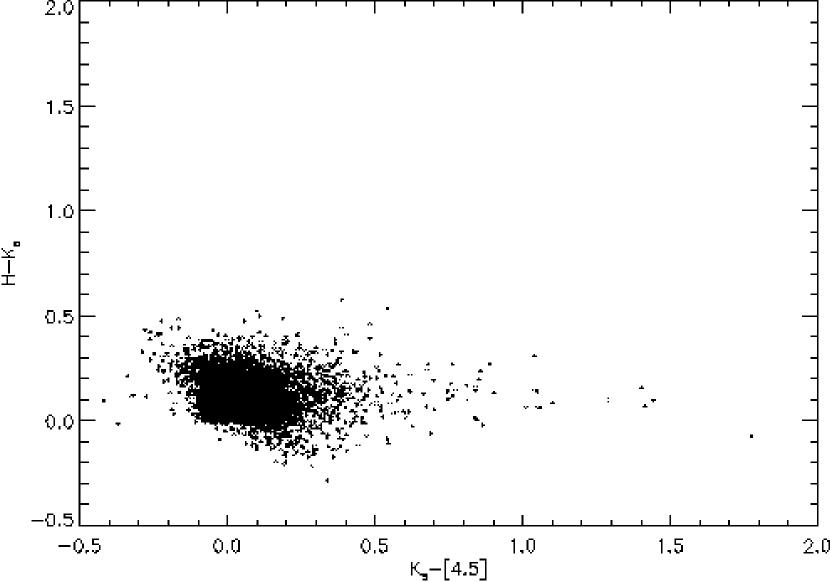
The H-/-[3.6] and H-/-[4.5] diagrams are shown in Figure 12. In each plot, nearly all sources have photospheric colors, with -[3.6], [4.5] 0.0-0.3 or 0.4. Sources with -[3.6], [4.5] much larger than 0.3-0.4 are much redder than normal stellar photospheres. The number of ’red’ sources is larger at [4.5] than at [3.6] and suggests the existence of an IR excess population in h & Per.
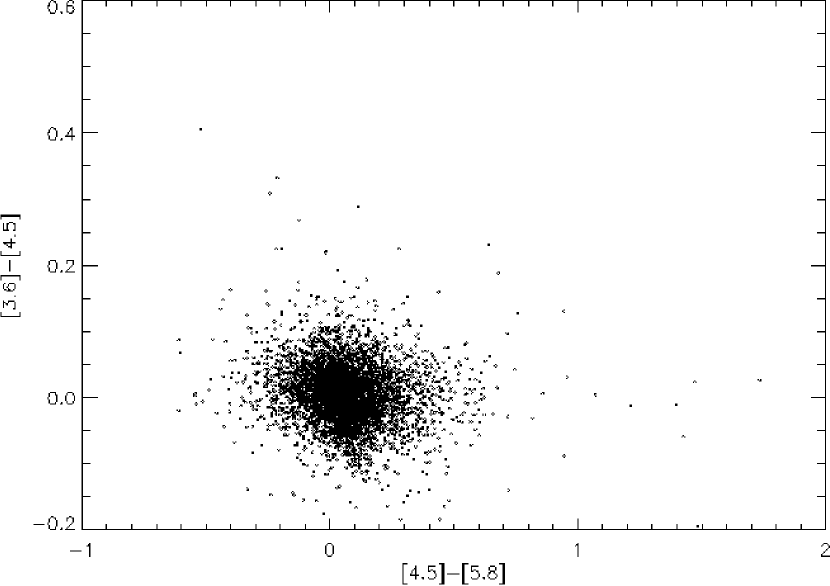
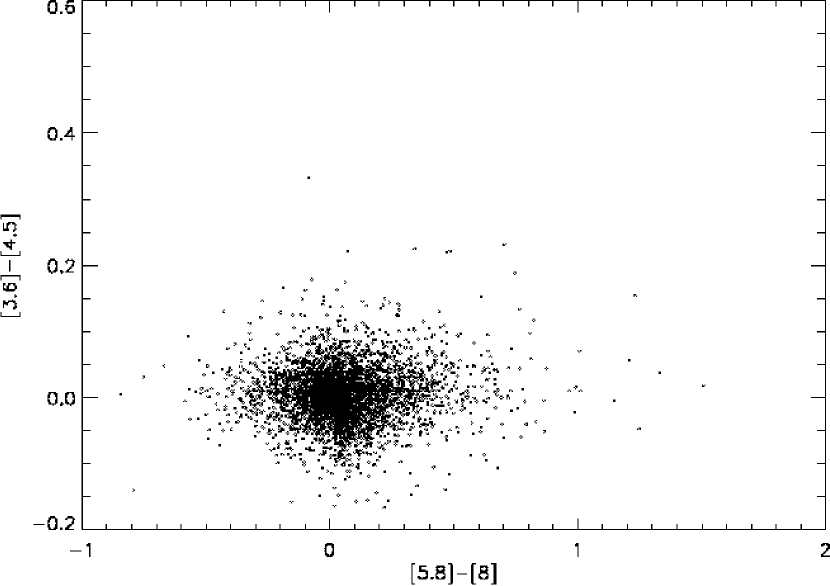
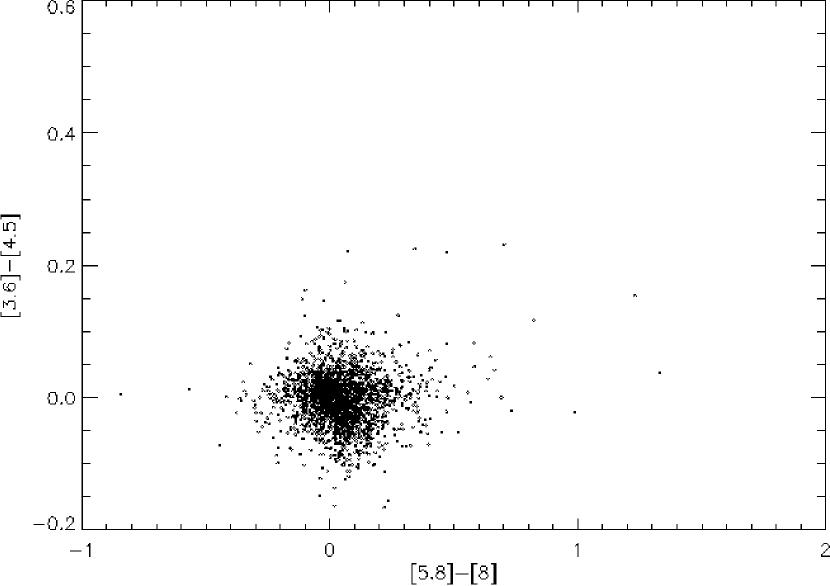
Figure 13 shows the [3.6]-[4.5]/[4.5]-[5.8] and -[3.6]/-[5.8] color-color diagrams. In previous studies of IRAC colors of pre-main sequence stars (e.g. Hartmann et al. 2005), a division between class II and class III T Tauri stars occurs roughly at [4.5] -[5.8] 0.2-0.25. The h & Persei color distribution has a red limit of about 0.3 resulting from the intrinsic dispersion of colors. Many sources have colors redder than this limit (,[4.5]-[5.8] 0.3). There are few sources with [4.5]-[5.8] -0.3. The common-baseline -[3.6]/-[5.8] diagram shows the very red population even more clearly. Photospheric sources have -[5.8] 0.3-0.4. The plot also suggests that there may be some sources with red colors at -[5.8] but not -[4.5], judging from the relatively larger number of sources.
The distribution at [5.8]-[8] (Figure 14, left panel) continues to show a very gradual, as opposed to abrupt, transition in colors from photospheric ([5.8]-[8] 0.2) to very red ([5.8]-[8] 0.4, see Allen et al. 2004). In Hartmann et al. (2005) there are very few sources with [5.8]-[8]=0.25-0.4. The lack of any gap in h & Per is likely due to larger photometric errors at [8]. The same plot for 10 sources (Figure 14, right panel) shows a much smaller dispersion in [5.8]-[8] colors containing sources with [5.8]-[8]=0.25-0.4. There is also a substantial number of 10 detections with [5.8]-[8] .
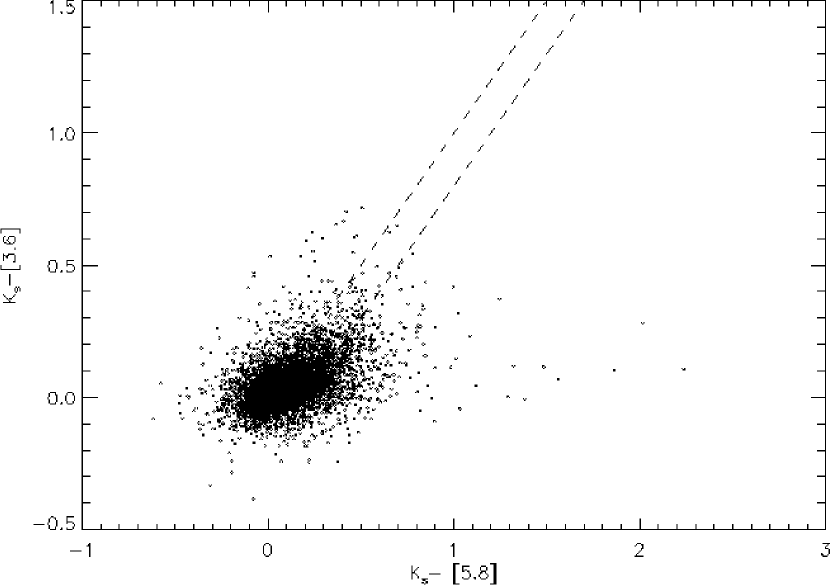
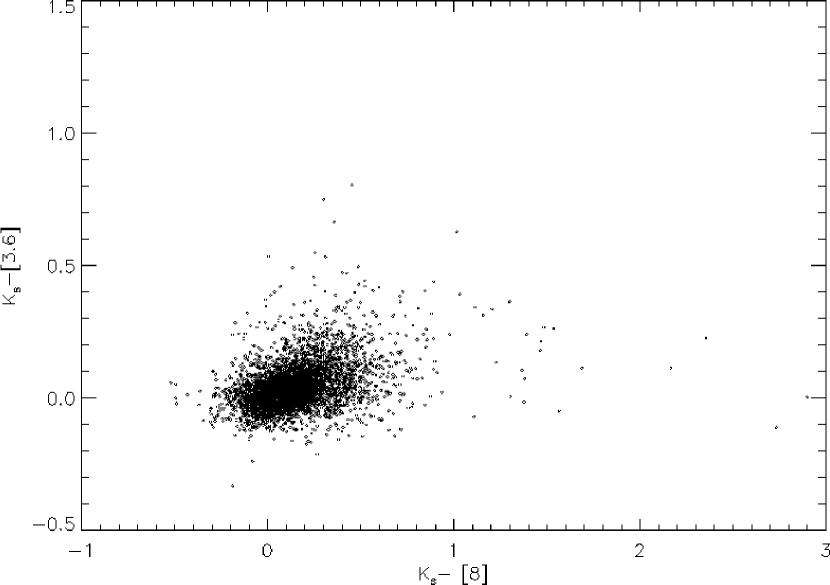
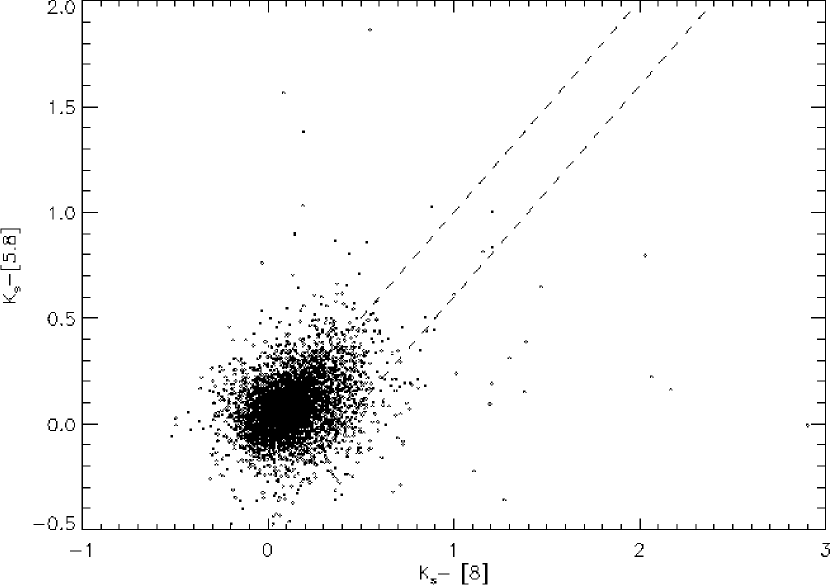
Constructing colors from the 2MASS band and IRAC bands at [5.8] and [8] provides the clearest evidence for an IR excess population in h & Persei. Figure 15 shows the -[3.6]/-[8] color-color diagram, which is our closest analogue to the K-L/K-N diagram used by Kenyon & Hartmann (1995) to distinguish Class II and III T Tauri stars in Taurus. Photospheric sources appear to have -[8]; with -[8] 0.4 there is a clear population of IR excess sources. The -[5.8]/-[8] diagram also shows an excess population for -[5.8,8] 0.4.
The population of very red, IR excess sources in -[IRAC] is statistically significant. The mean and dispersion in -[4.5] are -0.02 0.06; 0.07 0.1; and 0.07 0.1 at J=12, 14.5, and 15. For -[8] color these values are 0.06 0.1, 0.15 0.18, and 0.24 0.19; the values for -[3.6] are similar to -[4.5] and those for -[5.8] are in between -[4.5] and [8]. The median colors are nearly identical in all cases. In all -[IRAC] colors there exists a substantial population of sources that are more than 2-5 redder than the mean color while a corresponding blue population does not exist. It is clear from the IRAC colors that h & Persei harbors a significant IR excess population.
5. Analysis of the IR Excess Population
Now we quantify the fraction of sources with excesses from 2MASS and IRAC photometry and thus the population of sources with circumstellar disks. With no evidence for IR excess at , we estimate the fraction of sources with IR excess at [4.5], [5.8], and [8], using as a common short wavelength baseline and then relate the IR excess population to intrinsic stellar properties via the 2MASS J band. The J filter should have emission dominated by the stellar photosphere, especially for sources older than 10 Myr that typically are not actively accreting. Converting from J magnitudes to stellar properties is also more straightforward than with optical filters because J is less affected by reddening. We analyze the IR excess population as a function of J in 0.5 magnitude bins.
In Section 5.1, we describe our two methods for selecting sources as h & Persei members. Next, we describe our criteria for identifying a source as an IR excess source in section 5.2. We estimate the size of the IR excess population using a highly restrictive model for membership and IR excess identification and then using a less restrictive model. We describe both models in section 5.3.
The estimates from both the restrictive and less restrictive models show excellent agreement. The relative size of the IR excess population to the total population increases with J magnitude. Most of the IR excess sources have J=14-15; very few excess sources are brighter than J=13.5-14. This result implies that the frequency of disks around stars with ages 10-15 Myr is likely higher for lower stellar masses. The IR excess population is consistently larger at longer IRAC wavelengths than at shorter wavelengths: this behavior is expected if circumstellar disks clear from the inside out. At least of sources with J=14-15 () have IR excess indicative of a circumstellar disk. We also identify sources that have IR excess at both [5.8] and [8]. About of sources have strong IR excess at both long wavelength IRAC channels for sources as faint as J=15.0.
5.1. Sample Selection
Our first task is to remove probable non members of h & Persei. After removing sources identified as AGN/aromatic-emission galaxies we used the V/V-J and J/J-H color-magnitudes to remove sources inconsistent with the 13 Myr isochrone (Section 2.3). The most restrictive, cautious approach is to use only the sources with optical photometry from S02 because the long-baseline V-J color is better at identifying non members than the shorter-baseline J-H color. For this approach we require sources lying within 0.3 magnitudes ( errors added in quadrature) of the isochrone in V
| (1) |
Thus our sources consistent with h & Per membership should fall within a band 0.3 magnitudes brighter and fainter than the nominal reddened isochrone. However, the V magnitude data from S02 is complete only to in J. Thus, restricting our analysis to optical sources eliminates stars with J 14.5 or 1.6 .
A less restrictive approach uses the 2MASS J-H color to identify Myr, 2.34 kpc distant stars. Sources in unresolved binary systems should be magnitudes too bright for their color. The faint limit, however, should be unchanged. Our criteria are then:
| (2) |
This 2MASS sample is complete to J=15.5, which includes stars with .
5.2. IR Excess Criteria
A color threshold is set for a source to be considered an IR excess candidate using the 2MASS - [IRAC] color-color diagrams and Kenyon & Hartmann (1995) photometry and color table as a guide. For the [4.5] channel we use the -[3.6]/-[4.5] diagram, for the [5.8] channel we use -[3.6]/-[5.8], and for the [8] channel we use -[3.6]/-[8] (Figures 11, 12, and 14). The main distribution of sources in these diagrams has -[IRAC] . For comparison, Kenyon & Hartmann found that sources with K-L were typically class III T Tauri stars with weak emission and little evidence of circumstellar dust at L band (see also McCabe et al. 2006, figures 1 and 2). According to the Siess et al. (2000) isochrones, 13 Myr sources more massive than 1 should also not have K-L, assuming the extinction derived by BK05. Sources with -[IRAC] are then likely IR excess source candidates.
To avoid defining sources with large photometric errors as excess sources, we make the additional requirement that a source’s color must be redder than the absolute threshold plus the source’s photometric error, , in the IRAC bands, or
| (3) |
Fainter IRAC sources ( 14-14.5) then typically must have -[IRAC] 0.5-0.6 to be classified as excess sources. As a sanity check, we also require that the next longest wavelength IRAC band show at least a marginal excess, -[IRAC] , if a 5 detection was made at such a channel.
Finally, we remove potential completeness-related bias and calculate errors on the size estimates of the IR excess population. First, because the completeness limits from J through [8] vary, we apply a uniform cutoff across 2MASS and IRAC bands and restrict ourselves to sources with ,[IRAC], as the count rate for 5 detections at [8] falls to half-peak values by 14.5. Because sources with 14.5 have J- 0.4-0.7, we add a further restriction that sources must have J. Estimates for the size of the IR excess population in each IRAC band are then drawn from a single population. Nominally, the errors for the IR excess fraction in each 0.5 J magnitude bin are calculated from Poisson statistics, /N, where is the number of sources with IR excess and N is the number of sources in the bin with detections in 2MASS and at a given IRAC band. We retain this error estimate as an upper bound on the IR excess fraction. However, there may be sources in our coverage that are detected in 2MASS but not in IRAC and are brighter than our J magnitude cutoff. Thus, these sources would not be included in our calculation for N because of their non-detection in IRAC. This could bias our results in favor of detecting more IR excess sources and fewer photospheric sources near magnitude 14.5 and thus is another source of error.
To put a limit on this error, we calculate the number of sources in each bin detected at both J and . If the IRAC sample is 100% complete, this number M should be equal to N, otherwise it will be larger. We then assume that any source in M not detected in N is not an IR excess source and divide the total number of IR excess sources by M. This procedure yields an absolute lower limit on the fraction of sources with IR excess in each 0.5 magnitude bin. We subtract this value from the nominal fraction to produce an error estimate due to sample completeness. The larger of the two errors, the Poisson error and the completeness error, is chosen as the lower bound on the IR excess fraction.
5.3. Two Models for Analyzing the IR Excess Population
Equipped with our two approaches for sample selection, our method for identifying an IR excess source,
and our brightness cutoffs in 2MASS & IRAC, we now describe our two models for analyzing the IR excess population.
The models are summarized
in Table 3.
Model 1 (Restrictive) - We require that sources have optical counterparts from S02 and that they are within 0.3
magnitudes of the 13 Myr V/V-J isochrone (Equation 1). We require that IR excess candidates fulfill the condition set
in Equation 3. We investigate the IR excess population at [4.5], [5.8],
and [8] for sources with .
Errors for the size of the IR excess population in all models assume Poisson statistics.
Model 2 (Less Restrictive) - We require that sources have near-IR colors consistent with the 13 Myr J/J-H isochrone as described
by Equation 2. We require that the IR excess candidates fulfill the condition set in Equation 3.
The IR excess population is analyzed through J=15.
As additional checks of the reliability of the data, we examined the individual frames for the sources with apparent excesses and considered as highest weight the excesses detected at both [5.8] and [8]. We quantify the excess population at both [5.8] and [8] as well.
5.4. IR Excess Population: Restrictive Model
We show the size of the IR excess population relative to the total population as a function of J magnitude for our restricted model (Model 1) for -[4.5], -[5.8], and -[8] in Figure 16. The most striking feature in the diagram is the complete lack of IR excess sources at any band for J : 0/250 sources with J=11-13.5 have IR excess. We only begin to detect excess sources at [8] by J=13.9. The IR excess population at [4.5] and [5.8] only starts to appear by . While our approach may underestimate the fraction of IR excess sources near our faint limit of J=14.5 (), sources with J=11-13.5 typically have small photometric errors ( mag) at all 2MASS and IRAC bands. Thus, we have not missed IR excess sources brighter than J=13.5 () from our sample.
We note two other features in the IR excess population. The [8] IR excess fraction is consistently larger than at [4.5] and [5.8]. This result is consistent with an inside-out clearing of circumstellar disks. Stars with J=14-14.5 (2.2-1.6 also tend to have a larger fraction of IR excess sources than stars with J=13.5-14. For J=14-14.5, 14/409 (3.4 +0.9,-1%) sources have IR excess at [8]; for J=13.5-14 only 2/169 () of sources have [8] excess. This result coupled with the lack of excess sources at J suggests that the frequency of IR excess sources is related to stellar properties.
5.5. IR Excess Population: Less Restrictive Model
Now we investigate the IR excess population as a function of J magnitude for our less restrictive model (Model 2; Figure 17). While this approach may introduce more non members, the larger number of cluster members in this sample (to J 15.5) yields a larger statistical significance for our results. There are no IR excess sources for J 13.5: 0/399 with J=11-13.5 have IR excess at [8] or at shorter wavelengths. Thus the lack of IR excess sources at IRAC bands to J=13.5 is model independent.
The IR excess population from this sample appears remarkably similar to the restrictive sample where the two overlap (to J=14.5). In both models the [8] excess population is consistently larger than that at [4.5] and [5.8]. The IR excess population at [8] increases from (8/496) of the total population from J=13.5-14 to 3.5 +0.6,-0.9 % (34/983) at J=14-14.5. This result agrees with the estimates (complete to J=14.5) derived in section 5.4. Thus to J=14.5, our estimates of the IR excess population’s size is not sensitive to whether we use the long-baseline V/V-J or the short-baseline J/J-H diagram to constrain cluster membership. For J=14.5-15 the IR excess population at [8] is 8.1 +1.1,-4.5% (50/618). The population of sources with J=14.5-15, , and [8] detected with errors is smaller than the total population of sources with J=14.5-15 and : this accounts for the relatively large lower bound error. We note that if the sample were restricted to ,[8] , where completeness is better, the percentage of excess sources is roughly halfway between our measured value of 8.1% and the lower limit of 4% at %. Thus, the IR excess population at [8] near the brightness limit of our analysis comprises about 4-8% of the total population.
The excess population at -[4.5] is consistently the smallest, ranging from zero through J=13.5 to 0.2 , 1.4 (16/1117), to 1.0 +0.5,-0.6% (11/1138) of the total population from J=13.5-14, 14-14.5, and 14.5-15 respectively. Over the same range in J magnitude the [5.8] excess population represents respectively zero, 0.6, 1.6 (19/1214), and 3.3 +0.5,-0.6% (38/1150) of the total population.
5.6. Sources with Clear IR Excess at both [5.8] and [8]
If the IR excess population is dominated by sources with optically thick circumstellar disks extending to the magnetospheric truncation radius (Kenyon et al. 1996), then the IR excess population at [5.8] and [8] should be nearly identical. However, in both models for analyzing the IR excess population, the fraction of sources with IR excess at [8] is consistently larger. It is plausible that sources may not have IR excess at short-wavelength IRAC bands but have excess beyond , especially at 10-20 Myr. For example, TW Hya, a 10 Myr T Tauri star, has photospheric colors through [4.5], and a clear IR excess only at [8] (Hartmann et al. 2005). Other evolved T Tauri stars, such as the ’transitional’ T Tauri stars in Taurus (Kenyon & Hartmann 1995), have SEDs consist with a star+circumstellar disk where the disk has an inner hole. Sources with strong IR excess longward of [5.8] may also be explained by debris produced by planet formation (Kenyon & Bromley 2004; Currie et al. 2006). However, unlike for TW Hya and similar systems, we do not have constraints beyond 8 on IR excess candidates in h & Per since the MIPS completeness limit is typically too bright to detect these candidates (Currie et al. 2006; Balog & Currie et al., in prep.).
Therefore sources with both [5.8] and [8] excess set an absolute lower limit on the size of the IR excess population. We set the excess criteria to -[5.8,8] and use our sample from Model 2. The IR excess population at both [5.8] and [8] begins at J=13.8 and represents of the population for sources with J=14-14.5. This percentage increases to for J=14.5-15, slightly less than but still consistent with the excess fraction at [5.8] alone from Model 2. We also recover the same IR excess population vs. J magnitude relation in models 1 and 2, albeit at a lower statistical significance.
Thus, for sources with at least have IR excess at both [5.8] and [8]. If we include sources with photospheric colors at all wavelengths short of 8 then about of sources with J=14.5-15 have IR excess.
5.7. Distribution of IR excess sources on V/V-J and J/J-H Color-Magnitude Diagrams
Here we consider estimates of the IR excess population without cluster membership criteria. If IR excess sources are distributed randomly in V/V-J or J/J-H space our IR excess population estimates might be invalid.
Figure 18 shows our results. In the top panel of Figure 18 IR excess sources with V band photometry from S02 preferentially lie along the 13 Myr isochrone. They are far more clustered around the isochrone than the distribution of all sources. This trend also prevails for sources without V band photometry as shown in the bottom panel of Figure 18. Here, the IR excess population is preferentially clustered along the 13 Myr J/J-H isochrone. Just over half of the sources within 25’ of h & Persei are foreground/background stars, so the sizes of the h & Per population and foreground/background populations are comparable. However, the IR excess population for h & Per cluster and halo population members is clearly larger than the population of non members. This result is expected if our membership and IR excess criteria are valid.
5.8. Statistical Trends in the IR Excess Population of h & Persei
To conclude, analyzing the excess populations at -[4.5], [5.8], and [8] according to our two models leads to the following trends. First, both models show a complete lack of h & Persei sources with J and IR excess at any band. This result suggests that almost all inner disks ( about 1 AU from the star) around massive stars () disappear prior to 10 Myr. Second, both models show a general increase in the IR excess population with J magnitude. This suggests that a small number of disks around lower mass stars (to ) have lifetimes longer than 10 Myr. Third, to J=14.5 () about 3-4 % of sources have IR excess in the IRAC bands.
The deeper completeness and stronger statistical constraints from Model 2 separately yield the following additional results. The IR excess population is larger at [8] than at [5.8] and, especially, [4.5]. This result is consistent with an inside-out clearing of disks. About 4-8% of sources slightly more massive than the Sun (J=14.5-15, ) have IR excess. Tighter constraints on the cluster membership from optical spectroscopy and deeper IRAC and MIPS observations will be required to more precisely determine the IR excess population.
6. Summary, Future Work, & Discussion
We have conducted the first deep IR survey of the double cluster, h & Per. The survey combines 2MASS JH data with deeper JH data from the Lowell Mimir camera and Spitzer IRAC 3.6-8 data covering a region with an area of roughly 0.75 . To derive the fraction of stars with IR excesses, we considered the observed stellar surface density distribution, optical and infrared color-magnitude diagrams, and infrared color-color diagrams. This analysis yields the following robust results:
-
•
For stars with J 15.5, the stellar surface density peaks at 15 . In both clusters, the density falls to background levels of 15’ away from the center peak. About of the stars within 15’ are cluster members. Comparisons of color-magnitude diagrams show that of the stars at 15-25’ from the cluster centers are of approximately the same age, distance, and reddening. In both cases, the Siess et al (2000) evolutionary tracks suggest ages of 13 Myr for cluster stars.
-
•
For stars with J 13.5, the two clusters have essentially no stars with IR excess at 8 m. This result demonstrates that disk emission with R 1 AU disappears from stars with M 2.5-3 on timescales of 10-15 Myr.
-
•
Many stars with J =13.5-15 have IR excesses: 2-3% of the stars in this magnitude range have excesses at both [5.8] and [8.0]. Combined with the lack of detectable excesses for brighter stars, these results suggest that the disk evolution time depends on the stellar mass, with lower mass stars having longer disk evolution timescales.
In addition to these firm conclusions, our analysis indicates the following more tentative results:
-
•
If the requirement that sources have excesses at both [5.8] and [8] is relaxed, the fraction of sources with IR excesses increases from 3-4% at J = 14-14.5 to 4-8% at J=14.5-15.
-
•
At a fixed brightness, a larger fraction of sources appear to have excesses at longer wavelengths, 5.8-8 m, than at shorter wavelengths, 4.5 m. This result is consistent with an inside-out clearing of protoplanetary disks as proposed in standard theories of planet formation.
These results demonstrate that h Per are an excellent laboratory for studying the evolution of circumstellar disks at 10-15 Myr. With 5000 sources more massive than the Sun and a potentially significant halo population outside the main cluster boundaries, h & Per are at least as populous as the Orion Nebula Cluster (ONC; Hillenbrand 1997) and are the most populous nearby clusters in this age range within 2-3 kpc. Detailed comparisons of these clusters with the ONC and other young clusters provide robust tests of the universality of the IMF (S02) and the evolution of small scale structures within the clusters (Hillenbrand & Hartmann 1998, BK05).
Further progress on understanding the nature of the IR excess population requires deeper IR imaging surveys and comprehensive spectroscopic surveys. Current near-IR imagers on 4-10 m class telescopes can reach 0.5 stars (J 17.5) in a few nights. When combined with a deeper IRAC survey ([3.6, 4.5] , [5.8, 8] ), these data would yield measures of the IR excess for low mass stars where the predicted timescales and outcomes for disk evolution and planet formation are much different than at 1-3 (Plavchan et al. 2005; Laughlin et al. 2004). Modern multi-object optical spectrgraphs routinely acquire high S/N spectra of V = 19-20 stars in 30-45 min. With current spectroscopic samples complete only to V 15-16 (S02, BK05), a deep spectroscopic survey enables more reliable measures of cluster membership and deep searches for H emission for stars with masses of 0.5-2 .
References
- Al (2006) Alexander, R., et al., 2006, MNRAS, 369, 229
- Al (2005) Alibert, Y. et al., 2005, ApJL, 626, 57
- Al (2004) Allen, L., et al. 2004, ApJS, 154, 363
- Ba (1998) Baraffe, I., et al., 1998, A&A, 337, 403
- Br (1996) Bernasconi, P., 1996, A&AS, 120, 57
- Be (1996) Bertin, E. & Arnouts, S., 1996, A&AS, 117, 393
- Bi (1987) Binney, J & Tremaine, S., 1987, Galactic Dynamics (Princeton: Princeton Univ. Press)
- Bo (1964) Borgman, J. & Blaauw, A., 1964, BAN, 17, 358
- Br (2002) Bragg, A. & Kenyon, S., 2002, AJ, 124, 3289
- Br (2004) Bragg, A., 2004, Ph.D. thesis, Harvard University
- BK (2005) Bragg, A. & Kenyon, S., 2005, AJ, 130, 134
- Ca (2002) Capilla, G. & Fabregat, J., 2002, A& A, 394, 479
- Ca (2001) Carpenter, J., 2001, AJ, 121, 2851
- Ca (2006) Carpenter, J., et al., 2006, astro-ph/0609372
- Cl (2001) Clarke, C., et al., 2001, MNRAS, 328, 485
- Cr (1970) Crawford, D., et al.,1970, AJ, 75, 822
- Cu (2005) Currie, T., 2005, ApJ, 629, 549
- Cu (2007a) Currie, T., et al., 2007, in prep.
- Cu (2006b) Currie, T., et al., 2007, in prep.
- Do (1991) Dougherty, S., et al., 1991, AJ, 102, 1753
- Do (1994) Dougherty, S., et al., 1994, A&A, 290, 609
- Du (2005) Dullemond, C. & Dominik, C., 2005, A&A, 434, 971
- Fa (2004) Fazio, G. G., et al., 2004, ApJS, 154, 10
- Gu (2004) Gutermuth, R., et al., 2004, ApJS, 154, 374
- Ha (2001) Haisch, K., et al., 2001, ApJL, 553, 153
- Ha (2005) Hartmann, L., et al., 2005, ApJ, 629, 881
- Hi (1997) Hillenbrand, L., 1997, AJ, 113,1733
- Hi (1998) Hillenbrand, L., et al., 1998, ApJ, 116, 1816
- Hl (1998) Hillenbrand, L. & Hartmann, L., 1998, ApJ, 492, 540
- Hi (2005) Hillenbrand, L., 2005, astro-ph/0511083
- Ke (2001) Keller, S.C., et al., 2001, AJ, 122, 248
- Ke (1996) Kenyon, S., et al., 1996, ApJ, 462, 439
- KB (2004) Kenyon, S. & Bromley, B., 2004, ApJL, 602, 133
- KH (1995) Kenyon, S. & Hartmann, L., 1995, ApJS, 101, 117
- La (2004) Laughlin, G., et al., 2004, ApJL, 612, 72
- Ma (2004) Mamajek, E., et al., 2004, ApJ, 612, 496
- MB (2001) Marco, A. & Benabeau, 2001, A&A, 372, 477
- Massey (2003) Massey, P. 2003, ARA&A, 41, 15
- MC (2006) McCabe, C., et al., 2006, ApJ, 636, 932
- Oo (1937) Oosterhoff, P., 1937, Ann. Sternw. Leiden, 17, 1
- Pl (2005) Plavchan, P., et al., 2005, ApJ, 631, 1161
- Qu (2004) Quijada, M., et al., 2004, SPIE, 5487, 244
- Re (2005) Reach, W., et al., 2005, PASP, 117, 978
- Sc (1967) Schild, R., 1967, ApJ, 148, 449
- Si (2000) Siess, L., et al., 2000, A&A, 358, 593
- Sk (2006) Skrutskie, M. F., et al., 2006, AJ, 131, 1163
- Sl (2002) Slesnick, C., et al., 2002, ApJ, 576, 880
- St (1989) Strom, K., et al., 1989, AJ, 97, 1451
- Ta (1984) Tapia, M. et al., 1984, RMxAA, 9, 65
- Vo (1971) Vogt, N., et al. 1971, A&A, 11, 359
- Wi (1964) Wildey, R., 1964, ApJS, 8, 439
- YC (2004) Youdin, A. & Chiang, E., 2004, ApJ, 601, 1109
- YS (2002) Youdin, A. & Shu, F., 2002, ApJ, 580, 494
- Yo (2004) Young, E., et al., 2004, ApJS, 154, 428
| Field | Date (2005) | ||
|---|---|---|---|
| 1 | 2h18m56.4s | 57o8’35” | November 4-5 |
| 2 | 2h19m16.8s | 57o8’8’35” | December 5 |
| 3 | 2h19m37.3s | 57o8’35” | November 4-6 |
| 4 | 2h19m57.6s | 57o8’35” | November 6 |
| 5 | 2h19m16.8s | 57o5’35” | November 6 |
| 6 | 2h19m37.2s | 57o5’35” | November 6 |
| 7 | 2h19m57.6s | 57o5’35” | November 6 |
| 15 | 2h22m4.3s | 57o8’35” | November 30 |
| 16 | 2h21m43.2s | 57o8’35” | December 5 |
| 17 | 2h21m22.1s | 57o8’35” | December 1 |
| 19 | 2h20m39.7s | 57o8’35” | December 5 |
| 20 | 2h20m18.5s | 57o8’35” | December 5 |
| 22 | 2h22m4.3s | 57o5’35” | December 1 |
| 23 | 2h21m43.9s | 57o5’35” | December 1 |
| 24 | 2h21m23.5s | 57o5’35” | December 4 |
| 25 | 2h19m17.0s | 57o10’0” | December 5 |
| J | H | [3.6] | [4.5] | [5.8] | [8] | (J) | (H) | () | ([3.6]) | ([4.5]) | ([5.8]) | ([8]) | |||
|---|---|---|---|---|---|---|---|---|---|---|---|---|---|---|---|
| 34.9281 | 56.9391 | 14.394 | 13.875 | 13.691 | 13.613 | 13.619 | 13.451 | 13.583 | .034 | .038 | .049 | .003 | .428 | .07 | .118 |
| 35.0360 | 56.8215 | 14.229 | 13.654 | 13.656 | 13.517 | 13.562 | 13.883 | 99.0 | .035 | .042 | .048 | .039 | .056 | .098 | 99.0 |
| 35.0483 | 57.0313 | 14.516 | 13.983 | 13.857 | 13.752 | 13.781 | 13.771 | 13.563 | .034 | .037 | .057 | .006 | .017 | .104 | .124 |
| 35.0523 | 56.7621 | 12.421 | 12.001 | 11.922 | 11.816 | 11.844 | 11.920 | 11.903 | .024 | .030 | .023 | .057 | .005 | .022 | .030 |
| 35.1106 | 56.8819 | 8.795 | 8.049 | 7.836 | 8.324 | 7.9730 | 7.787 | 7.731 | .018 | .024 | .018 | .014 | .168 | .002 | .003 |
.
Note. — First five entries in our photometry catalogue from 2MASS and IRAC
| Model | Membership Determination | Membership Cutoff | J cutoff |
|---|---|---|---|
| 1 (more restrictive) | V/V-J colors1 | V-V(isochrone) | 14.5 |
| 2 (less restrictive) | J/J-H colors2 | J-J(isochrone) , | 15.0 |
Note. — Brief description of the two models for identifying IR excess sources. In the first model we require that sources have optical data from S02 and use the V/V-J diagram to constrain cluster membership. We analyze sources to J=14.5. In the second model we use the J/J-H diagram from 2MASS to constrain cluster membership. We analyze sources to J=15.. The membership cutoff refers to how far away a source can be from the 13 Myr isochrone and still be classified as an h & Persei member. The cutoff limits in the second model include the effect of binarity.