e-mail: miguelsg@iac.es; amr@iac.es 22institutetext: Isaac Newton Group of Telescopes, Ap. de Correos 321, 38700 Sta. Cruz de la Palma, Spain
e-mail: rcorradi@ing.iac.es 33institutetext: South African Astronomical Observatory, PO Box 9, 7935 Observatory, South Africa
e-mail: paw@saao.ac.za; fm@saao.ac.za 44institutetext: Department of Mathematics and Applied Mathematics and Department of Astronomy, University of Cape Town, South Africa 55institutetext: INAF Osservatorio Astronomico di Padova, via dell’Osservatorio 8, 36012 Asiago (VI), Italy
e-mail:munari@pd.astro.it 66institutetext: Space Telescope Science Institute (STScI), 3700 San Martin Drive, Baltimore, MD 21218, USA e-mail: boffi@stsci.edu, mlivio@stsci.edu
HST and VLT observations of the Symbiotic Star Hen 2–147††thanks: Based on observations with the NASA/ESA Hubble Space Telescope, obtained at the Space Telescope Science Institute, which is operated by the Association of Universities for Research in Astronomy, Inc. under NASA contract No. NAS5-26555; on observations obtained at the 8m VLT telescope of the European Southern Observatory in Chile; and on observations made at the South African Astronomical Observatory
Abstract
Aims. We investigate the dynamics of the nebula around the symbiotic star Hen 2–147, determine its expansion parallax, and compare it with the distance obtained via the Period-Luminosity relation for its Mira variable.
Methods. A combination of multi-epoch HST images and VLT integral field high-resolution spectroscopy is used to study the nebular dynamics both along the line of sight and in the plane of the sky. These observations allow us to build a 3-D spatio–kinematical model of the nebula, which together with the measurement of its apparent expansion in the plane of the sky over a period of 3 years, provides the expansion parallax for the nebula. Additionally, SAAO near-infrared photometry obtained over 25 years is used to determine the Mira pulsation period and derive an independent distance estimation via the Period-Luminosity relationship for Mira variables.
Results. The geometry of the nebula is found to be that of a knotty annulus of ionized gas inclined to the plane of sky and expanding with a velocity of km s-1. A straightforward application of the expansion parallax method provides a distance of 1.50.4 kpc, which is a factor of two lower than the distance of kpc obtained from the Period-Luminosity relationship for the Mira (which has a pulsation period of 373 days). The discrepancy is removed if, instead of expanding matter, we are observing the expansion of a shock front in the plane of the sky. This shock interpretation is further supported by the broadening of the nebular emission lines.
Key Words.:
symbiotic stars: Hen 2-147 – planetary nebulae – interstellar medium: kinematics and dynamics1 Introduction
The study of nebulae around symbiotic stars, and in particular those containing Mira variables, is key to understanding several aspects of their binary interactions, outburst properties and timescales. Such studies provide information about the geometry, dynamics, and history of mass loss from these systems over the last few thousand years. It is generally believed that in these binaries some percent of the Mira wind is accreted by the white dwarf companion (Kenyon & Webbink KW84 (1984)), resulting in stable nuclear H-burning at the surface of the white dwarf for some systems (e.g. Sokoloski So02 (2002)), and sometimes causing thermonuclear outbursts (e.g. Kenyon Ke86 (1986), Livio et al. Li89 (1989)) lasting for hundreds of years (e.g. Munari Mu97 (1997)). The ejecta and fast wind produced during and after such an outburst collide with the slowly expanding circum-binary gas resulting from the non-accreted Mira wind. This results in a complex circum-binary nebula whose ionization mechanism (radiation and/or shocks) is not well understood (Corradi & Schwarz Co97 (1997)).
Currently, about a dozen symbiotic nebulae have been optically resolved (Corradi Co03 (2003)). Some of them exhibit spectacular (mainly bipolar) morphologies, such as R Aqr (Solf & Ulrich So85 (1985), Paresce & Hack Pa94 (1994) and references therein), Hen 2-104 and BI Cru (Schwarz et al. Sw89 (1989), Corradi & Schwarz Co93 (1993)), HM Sge, V1016 Cyg and Hen 2–147 (Solf So83 (1983, 1984); Munari and Patat Mu93 (1993); Corradi et al. Co99 (1999)), as well as M2-9 (Smith et al. Sm05 (2005)) and Mz 3 (Guerrero et al. Gu04 (2004), Santander-García et al. Sa04 (2004)). The latter are sometimes classified as planetary nebulae, but possibly host a symbiotic nucleus (Schmeja & Kimeswenger Sc01 (2001)).
In general, the distances to these systems are not well known. About 19 known and possible symbiotic stars have been measured by the Hipparcos astrometric mission, and for only four of them the formal error of their parallax is less than 50% (Munari Mu03 (2003)). This uncertainty plagues the estimates of the total number of symbiotic stars in the Galaxy (Munari and Renzini MR92 (1992)), which scale with the adopted local density and partnership to galactic stellar populations (Whitelock and Munari WM92 (1992)). The uncertainty on distances also precludes the calculation of a number of physical properties, including the kinematical ages of the nebulae which in turn can provide the timescales of the mass-loss events which characterized their recent history (e.g. Corradi et al. Co01 (2001)). The advent of high spatial resolution instruments like the HST allows us to tackle the distance problem by attempting to measure the expansion parallax of the circumstellar resolved nebulae. This is done by measuring the growth of the nebula in the plane of the sky, via multi-epoch imaging, and then determining the distance once their 3-D geometry and kinematics are established using Doppler shift measurements. To date, such a method has not been used on any symbiotic nebula, although it has been applied to a number of relatively close planetary nebulae (NGC 6543, Reed et al. Re99 (1999); IC 2448, NGC 6578, NGC 6884, NGC 3242 and NGC 6891, Palen et al. Pa00 (2000)). Note, however, some recent criticisms of the expansion parallax method (Mellema Me04 (2004), Schönberner et al. Sc05 (2005)).
Henize 2-147 (Hen 2–147, also named as PN G327.9-04.3 or V347 Nor) is a symbiotic Mira with a pulsation period of 375 days (Whitelock Wh88 (1988)). Its extended nebula was discovered by Munari & Patat (Mu93 (1993)), and modeled as an expanding ring inclined on the plane of the sky by Corradi et al. (Co99 (1999)). In this paper, we present a high-resolution spatio-kinematical study of the ring nebula of Hen 2–147. HST images taken in 2001 and 2004 reveal its expansion in the plane of the sky. Integral-field high-resolution spectroscopy at the VLT provides us with Doppler shifts for all of the nebular structures, and together with the HST data enables us to discuss the dynamics of the nebula and to compute an expansion parallax. This is compared with an independent distance determined from near-IR photometry at SAAO using the Mira period-luminosity relationship. This combination of information provides insights into the dynamical properties of the nebula, as well as testing the validity of the derived expansion parallax for this object. Preliminary results were presented by Santander-García et al. (Sa05 (2005)).
2 Observations and Data reduction
2.1 Imaging
Two sets of [Nii] 658.3 nm images of Hen 2–147 were obtained using the Wide Field Planetary Camera 2 (WFPC2) on the Hubble Space Telescope (HST) on September 29, 2001 (programme GO9082) and September 25, 2004 (programme GO9965) respectively. The images were obtained through the F658N filter (central wavelength/bandpass = 659.0/2.2 nm), which transmits the [Nii] line with 78% efficiency and the H line with about 2% efficiency at the heliocentric systemic velocity of Hen 2–147 (Corradi et al. Co99 (1999)). The entire nebula falls inside the PC CCD, which has a spatial scale of pixel-1.
The HST images (one dataset per epoch) were obtained using a 4-point dithering pattern in order to properly sample the HST point spread function (PSF). They were then reduced using the “multidrizzle package” (Koekemoer et al. Ko02 (2002)), an automated dithered image combination and cleaning task in PyRAF (Python IRAF). This routine first creates a bad-pixel mask using calibration reference files, and performs the sky subtraction. Next, the software arranges the four WFPC2 CCDs into a mosaic, where geometric distortion effects are corrected, including time dependent distortions due to CCD rotations and flexure. Then it removes cosmic rays and creates, for each epoch, a combined and drizzled image with a sampling scale of 0′′.045 pix-1. Finally, the two epoch images are aligned with respect to the centre of expansion of the nebula around Hen 2–147. Charge transfer efficiency, which decreases with time, is the only effect which slightly degrades the generally good (0.25 pix) overall astrometric accuracy between images.
2.2 Integral Field Spectroscopy
Integral Field Spectroscopy was obtained at Kueyen, Telescope Unit 2 of the 8m VLT at ESO’s observatory on Paranal, on April 2, 2004. The entire nebula was covered by the ARGUS IFU at its highest spatial resolution (314 fibres each with a size of projected onto the sky, giving a total of 6′′.6 by 4′′.2 field of view). Two 240 s and one 50 s exposures were taken with the H651.5 grating, covering the region between 630 and 670 nm, and then co-added. The resolving power was R=25000 corresponding to a velocity resolution of 12.3 km s-1 around the H and [Nii] 654.8,658.3 emission lines. Seeing was 0′′.65. The VLT data were kindly reduced by Reinhard Hanuschik through the ESO pipeline, and then further analyzed using standard IRAF routines.
2.3 Near-infrared photometry
Hen 2–147 has been monitored at near-infrared wavelengths since 1981 from the South African Astronomical Observatory (SAAO) at Sutherland. The complete list of observations is presented in Table 2. All but one were made on the 0.75m telescope with the MkII Infrared Photometer; the other one (marked with an asterisk in Table 2) was made with the MkIII Infrared Photometer on the 1.9m telescope. The photometry is on the SAAO system, as defined by Carter (1990), and is good to better than at and better than at . There are 119 observations made over 24 years, one of which was published by Munari et al. (1992). The first five years worth of data were discussed by Whitelock (1987).

3 Morphology and spectra
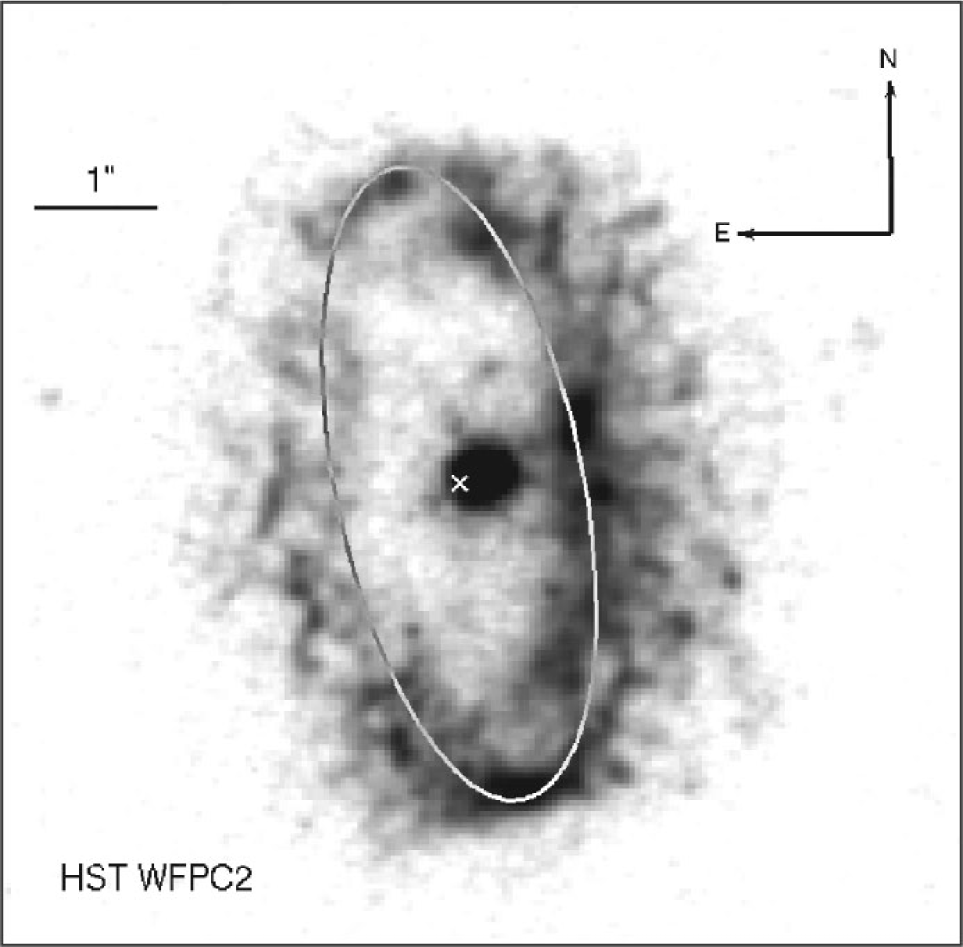
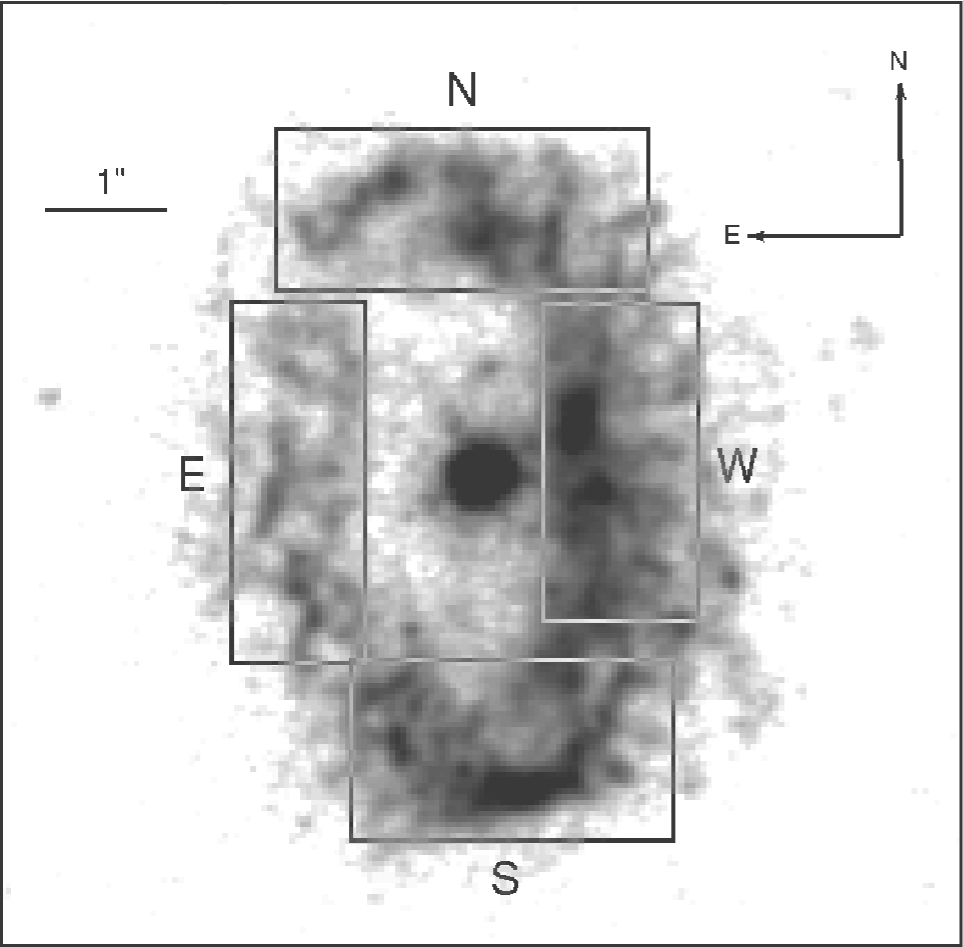
The 2001 image of Hen 2–147 is shown in Fig. 1. The overall morphology consists of an ellipse of emitting gas detached from an unresolved central source, confirming the conclusion of Corradi et al. (Co99 (1999)) from ground based images. The high spatial resolution of HST enables us to see that the ellipse is fragmented into a number of clumpy and filamentary structures; these will be referred to as “knots” hereafter. The overall size of the ellipse is 5′′.6 by 3′′.6 measured at 10% of the peak intensity of the nebular emission.
The surface brightness is not uniform, as the western and southern knots are significantly brighter than the eastern ones. Note also that the nucleus is slightly offset from the centre of the ellipse towards the western knots (see Fig. 6).
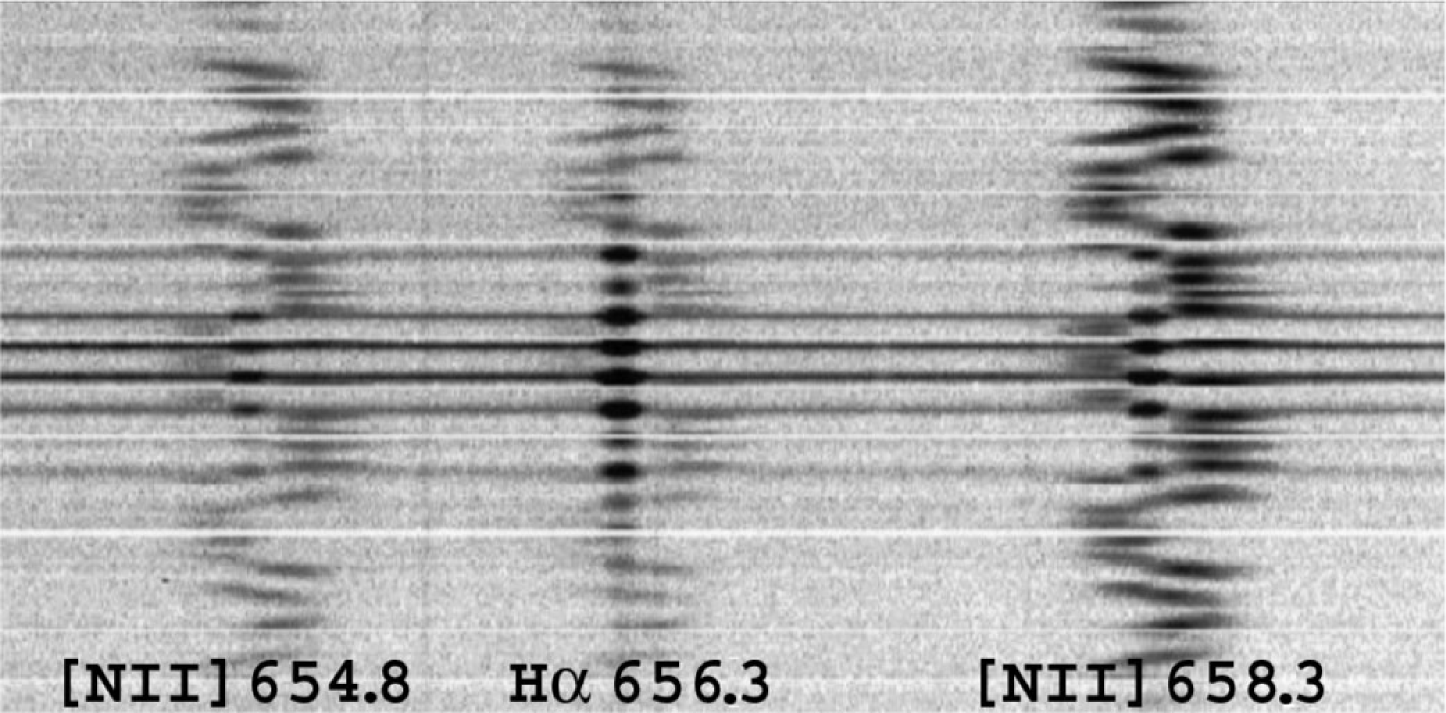
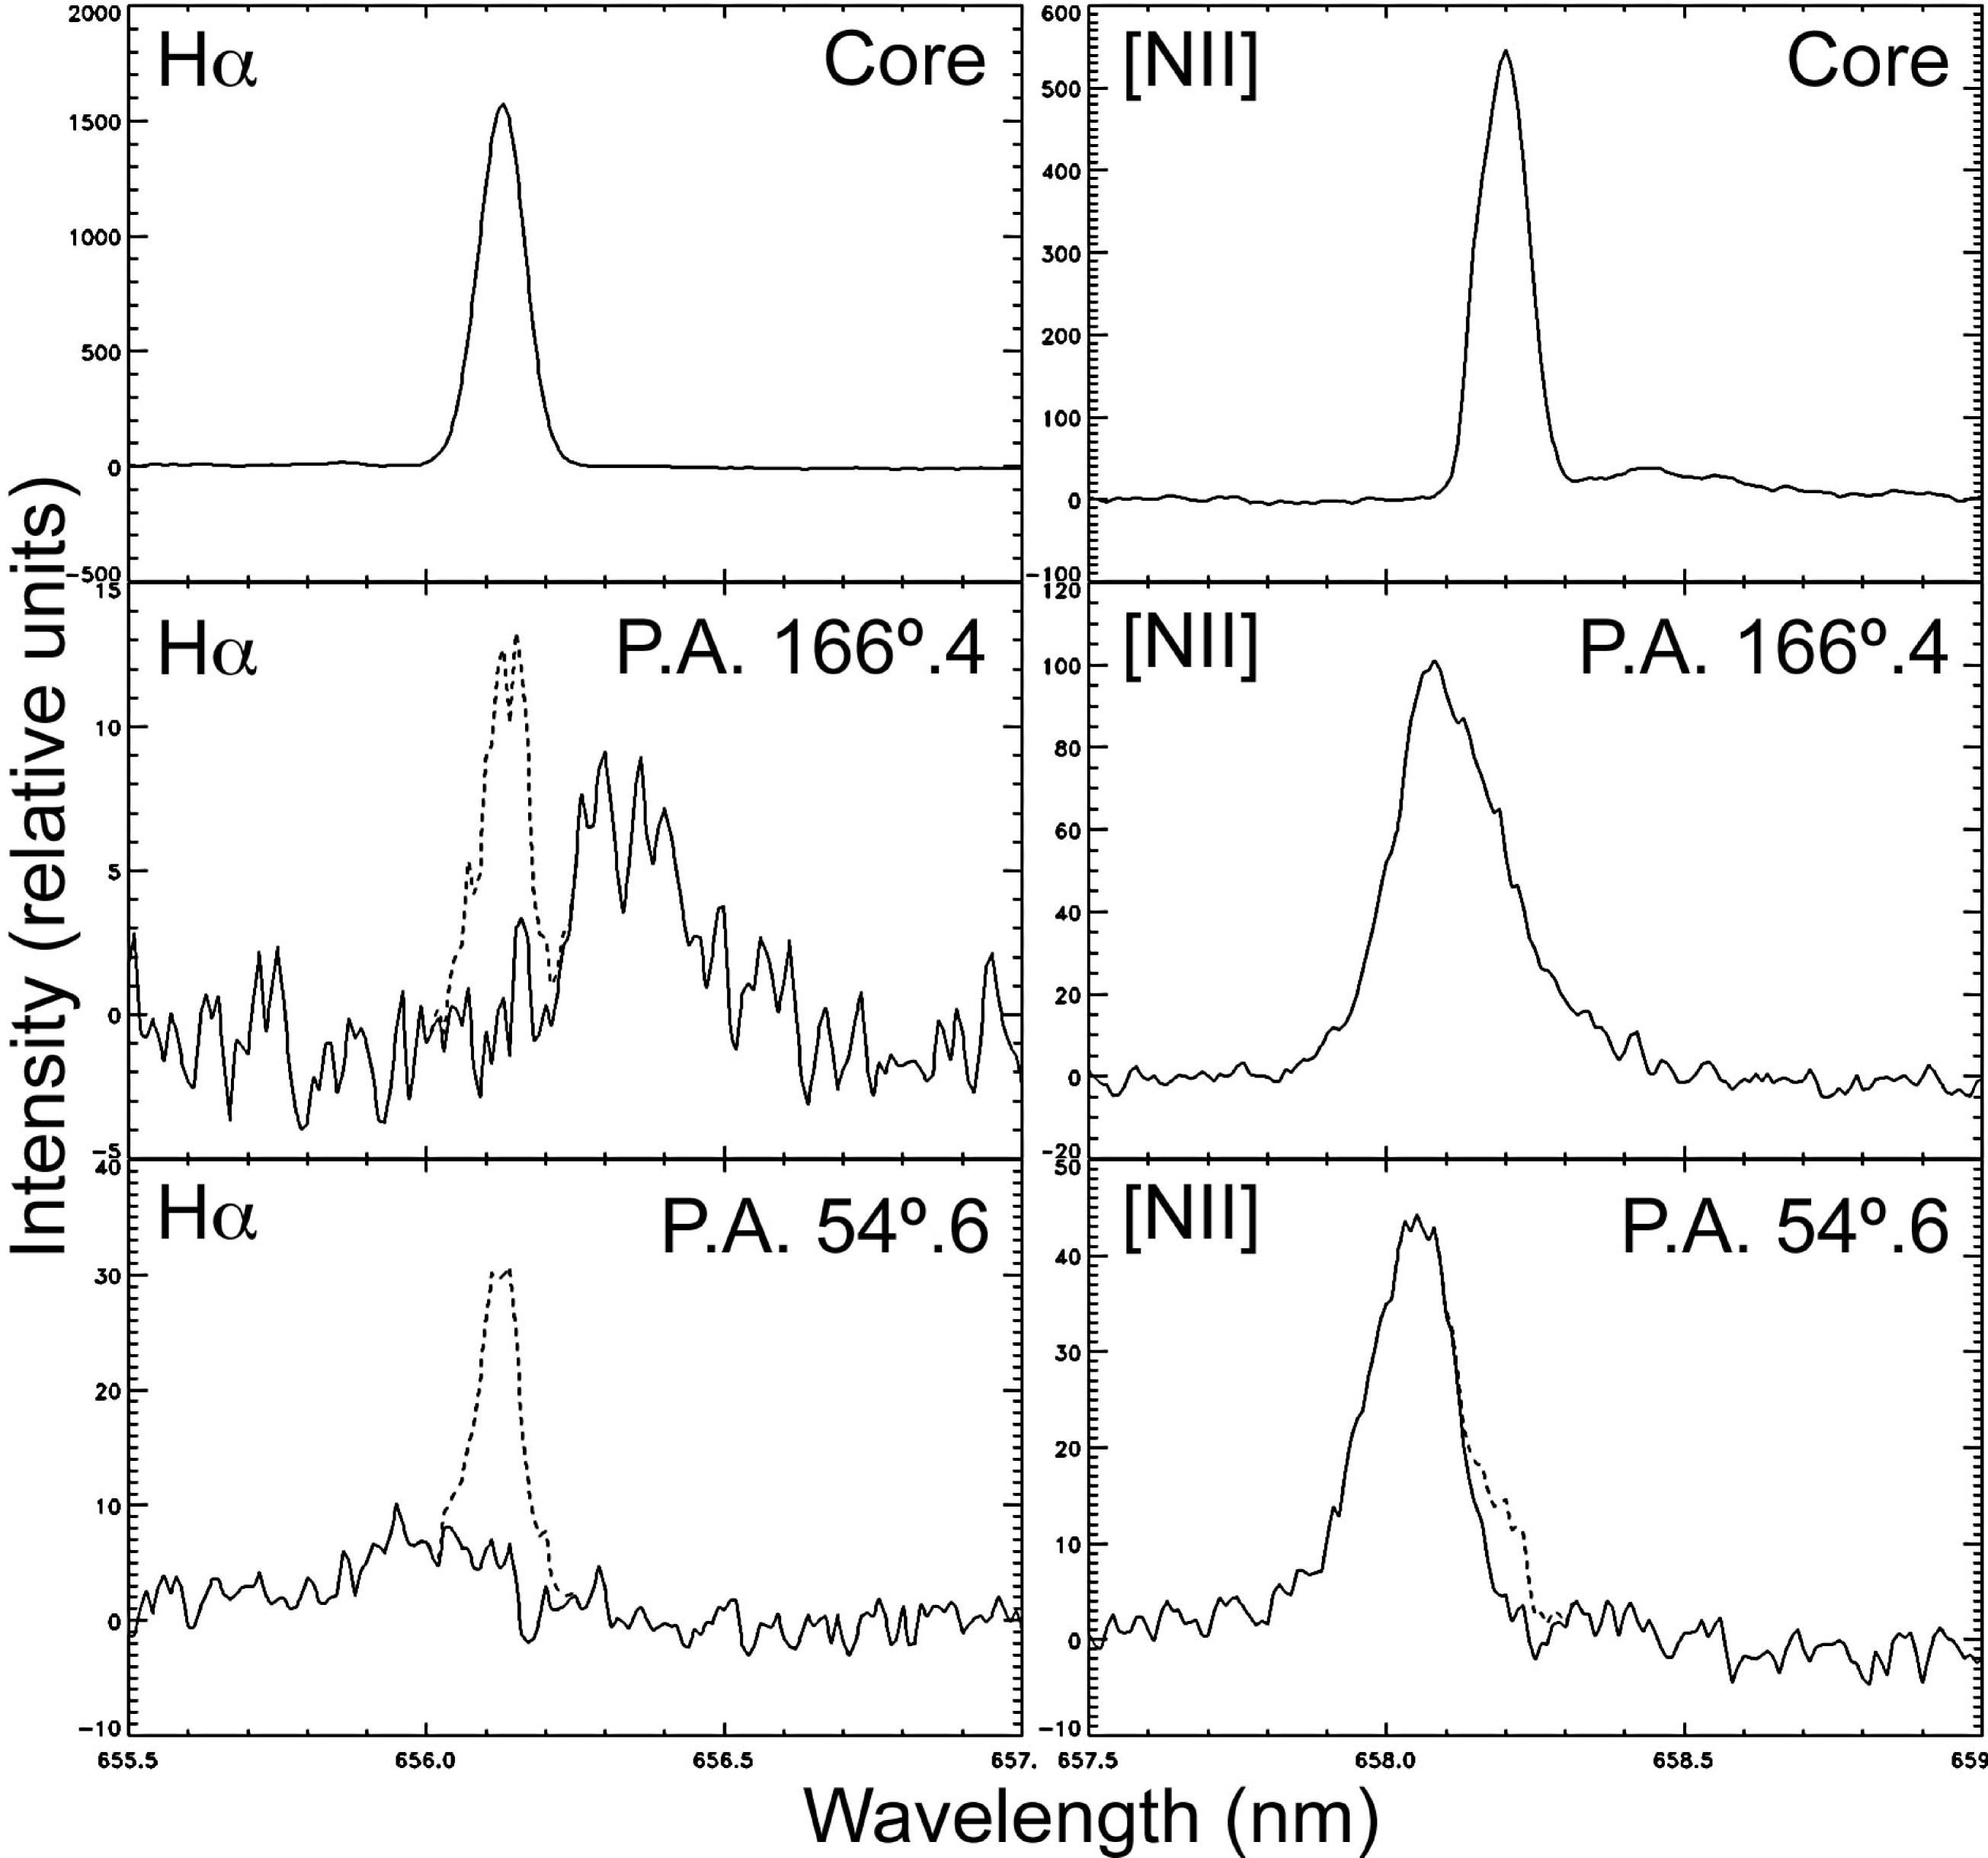
The good seeing and spatial sampling of the VLT spectra, presented in Fig. 2, allow us to separate the emission from the central source from that of the knots. The central source shows a faint continuum and relatively narrow H (brighter) and [Nii] 658.3 (fainter) emission. In contrast, in the knots [Nii] 658.3 is stronger than H, and all lines are significantly broadened.
4 Dynamical analysis
A spatio-kinematical model accounting for the observed morphology, motions in the plane of the sky, and Doppler shifts of the emission lines, is presented below.
4.1 On the plane of the sky
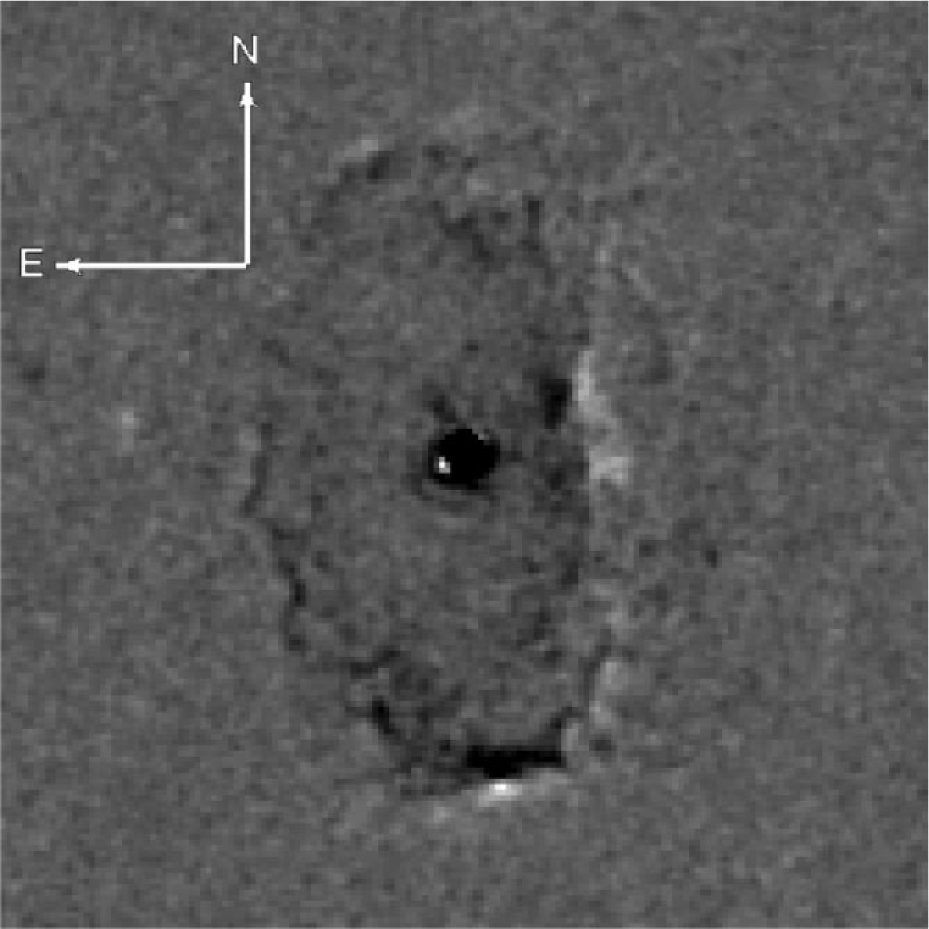
A simple blinking of the images obtained in 2001 and 2004 (Fig. 3, a gif animation available in the electronic version of the paper) reveals the expansion of the nebula. Fig. 4 shows the residual map resulting from the subtraction of the 2001 image from the 2004 one, after first aligning the two images with respect to the expansion centre of the nebula as defined below. At each radial direction from the centre, positive residuals (white in the figure) are located outwards while negative residuals (black) are located inwards. This indicates that the nebula has expanded significantly between the two epochs.
In order to quantify the amount of this expansion it is important to define the expansion centre, as the unresolved core seems not to be located at the centre of the elliptical nebula. In the hypothesis of purely radial expansion, the expansion centre can in principle be determined as the intersection of all the vectors describing the expansion of each knot. However, an attempt to determine the knots’ expansion vectors by measuring the displacement of their flux-weighted barycentre, or by cross-correlating their positions between the two epochs, yields uncertain results. Probably because the knots are diffuse, not well separated from each other, and they apparently change slightly in shape between the two epochs.
Therefore, the amount of expansion along a number of radial directions was determined by 1-D cross-correlation of the surface brightness radial profiles between the two epochs. In order to do this, we have considered three different possible expansion centres: i) the centre of the ellipse fitted to the nebula by eye, ii) the central unresolved emission-line core, and iii) the centre of the ellipse fitted to the nebula by an emission-weighted least-squares method. For each of these potential centres, radial surface brightness profiles were extracted at 60 different position angles (with 6 increment steps) in the 2001 and 2004 images, and cross-correlated to compute the proper motion for each direction.
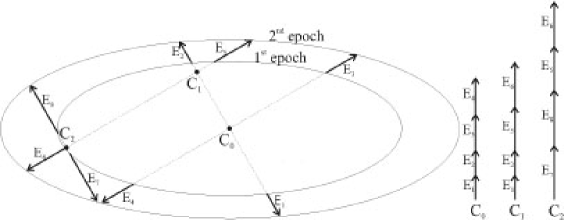
As illustrated in Fig. 5, the centre of a radially expanding ellipse can be defined as the point which minimizes the sum of the radial expansions of a number of individual features uniformly distributed along the ellipse. In the case of Hen 2–147, the sum is minimum (by a significant 4%) for the centre of the least-squares-fitted ellipse, which in the following is therefore assumed to be the centre of expansion of the nebula. This is located 0′′.2 0′′.05 from the central star toward P.A.=111∘, as indicated in Fig. 6. The orientation of the long axis of this ellipse is P.A. 11∘.5 0∘.5, and its size is 5′′.2 by 2′′.0 ( 0′′.1). Assuming that the intrinsic morphology is that of a circular ring, its polar axis would be inclined 68∘.6 0∘.5 to the line of sight.
Once the expansion centre was determined, the growth of the nebula was derived using the so-called “magnification method” (see Reed et al. Re99 (1999)). This consists of finding the magnification factor, , to be applied to the 2001 image, which minimizes the rms of the map obtained by subtracting the magnified image from the 2004 image. Provided that there are no changes in the brightness of each feature and that the motion is radial, a given feature will therefore disappear in the subtracted image.
The complex structure of the nebula and the evolution of the shape and brightness of knots prevents the analysis of each individual feature. For this reason, we have considered the regions of the nebula along the four cardinal directions as a whole (see Fig. 7). Magnification factors spanning the interval from 1.000 to 1.050 were applied. The factors giving the minimum rms in the subtracted image are 1.013, 1.015, 1.017 and 1.029, for the north, south, east and west region, respectively; with an uncertainty of 0.002 in each case. An illustrative sample of residual images for different factors is shown in Fig. 8.
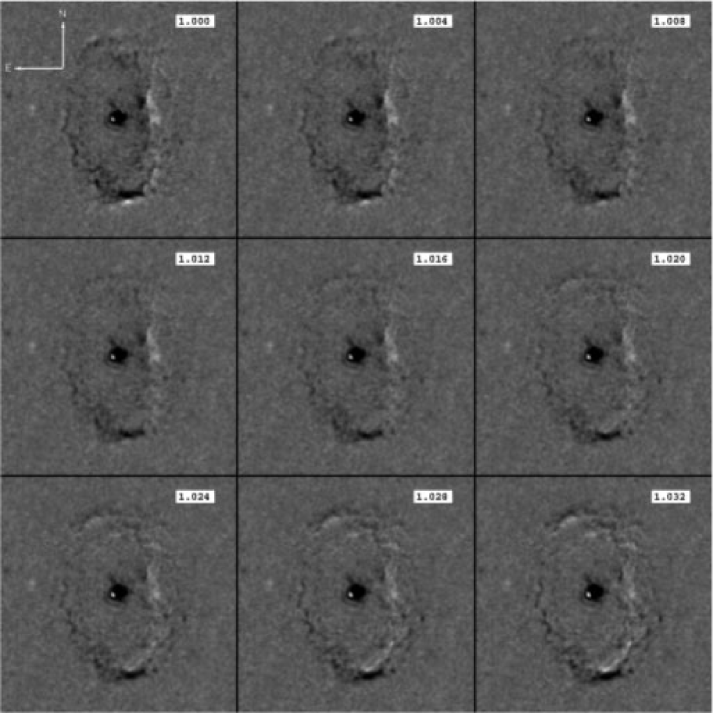
Thus, the growth of the nebula is uniform with an average value of 0.002 except in the western direction, corresponding to the brightest knots, where it has grown by about twice this amount. Note also that for any the residuals in the southern region are negative, due to a decrease of 10% in the surface brightness of the knots from 2001 to 2004. The rest of the nebula shows no significant changes in surface brightness between the two epochs.
4.2 Along the line of sight
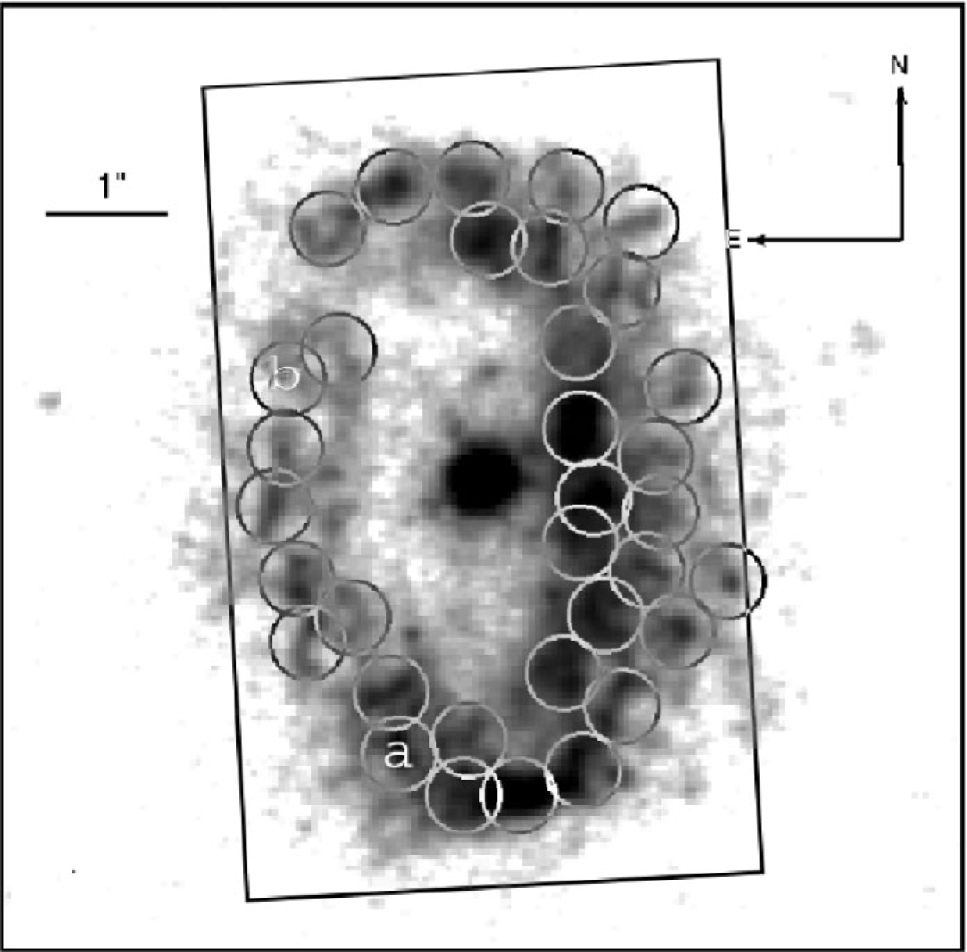
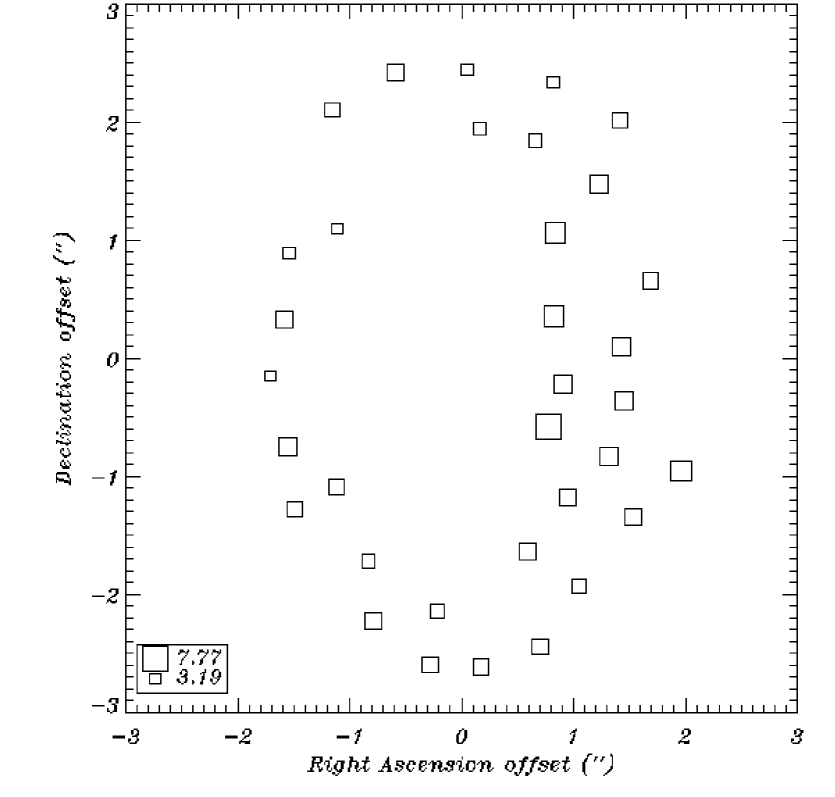
The HST image was matched to the IFU array of the VLT+FLAMES, and the spectra corresponding to 34 knots and the core of Hen 2–147 were extracted (Fig. 9). Depending on the position and size of each knot either the spectrum from a single fibre (0′′.3) was taken or the spectra of up to 4 fibres were summed to give sufficient signal to noise.
Both the H and [Nii]658.3 line profiles of the core and some illustrative knots are presented in Fig. 10.
In the knots close to the centre as well as in the faintest ones (owing to the small size of the nebula) the contamination from the core emission is non negligible. This contamination was removed by scaling the core spectrum and subtracting it from the spectra of the knots, so as to cancel the H component from the core, which is always clearly distinguishable given its specific redshift, line width, and the fact that H is much stronger than [Nii] in the core (while the opposite is true for the nebula). An example of the removal of the core emission is also illustrated in Fig. 10.
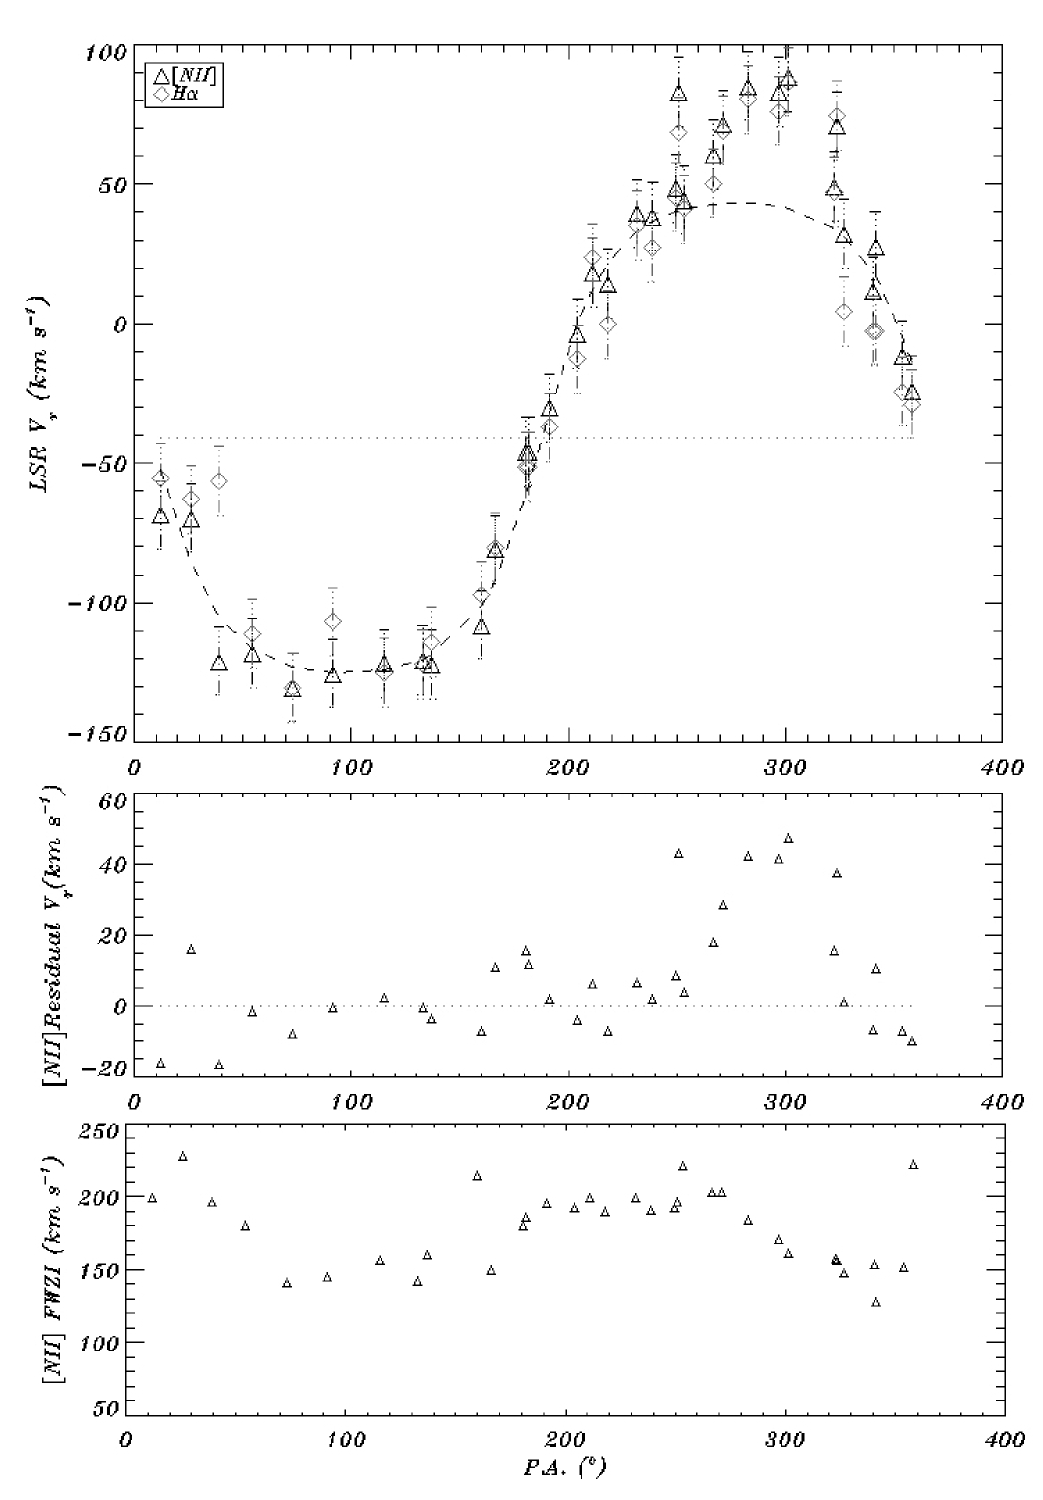
Doppler shifts were derived for the barycentre of each line profile in every knot, as well as for the core. The LSR radial velocity of the central source is v km s-1. In the nebula, the hydrogen and nitrogen ions are found to expand at the same pace within the observational uncertainties. The radial velocity pattern as a function of the position angle is presented in Fig. 11. This is modelled assuming an expanding circular ring of gas inclined at to the line of sight, corresponding to the fit of the ellipse in the image (see section 4.1). The best-fitting de-projected expansion velocity of the ring is 90 km s-1, with centre at km s-1 (and thus slightly offset from the systemic velocity of the nebular core). The residuals of the fitting are shown in the middle panel of Fig. 11. The points between P.A.=220 and 330 were excluded from the fitting, given their peculiar velocity pattern in the plane of the sky and considering that if they are included the quality of the fit decreases. Note that their excess radial velocity corresponds to an excess in their velocities in the plane of the sky; we will come back to this point in Sect. 5.2.
A remarkable property of the line profiles of the knots is their large width, which is discussed in detail in next section. Furthermore, the [Nii] to H flux ratio is always very large, especially in the western region (Fig. 12). Finally, most of the [Nii] profiles are slightly asymmetrical, presenting redward (more common) or blueward wings.
4.3 Profile broadening
Both the [Nii] and the H lines in all knots have a full width at zero intensity (FWZI) between 150 and 200 km s-1 (with a mean value of km s-1, see Fig. 11, bottom panel). Which is much larger than the instrumental or thermal broadening, as previously noted by Corradi et al. (Co99 (1999)). In this section we discuss several hypotheses that might account for this property.
The combination of the observed morphology and velocity field demonstrates that the nebula of Hen 2–147 is a “2-D” ring inclined on the plane of the sky. This excludes the possibility that the wide range of velocities forming the line profiles at each knot position come from regions of the nebula projected along the same line of sight, each with relatively small intrinsic velocity dispersion, but projecting at different angles (as, e.g., in the case of a projected ellipsoid). We can also exclude the possibility that the broadening is related to intrinsic gas emission mixed with dust scattering, which would result in additional components to the Doppler shifts.
Therefore the velocity dispersion is very likely to be intrinsic to each knot. One possibility is that during the nebular evolution the knots have expanded into a surrounding medium of lower density, temperature and pressure. The fast relative flow of the ambient medium along the sides of the knots would reduce the pressure, Rayleigh-Taylor instabilities would break the knots into smaller filaments and blobs, and Kelvin-Helmholtz instabilities mix the knot material with the ambient flow (Soker & Regev So98b (1998)).
Given the explosive nature of symbiotic novae like Hen 2–147, and the high velocities observed, another natural explanation for the large line widths would be the presence of shocks. They might originate as the result of interactions between the slow Mira wind and the fast ejecta produced in the outburst. The large [Nii] to H ratio throughout the nebula (Fig. 12) supports this possibility. According to Hartigan et al. (Ha87 (1987)), the velocity of a radiating bow shock is independent of its density, shape, ionisation state, abundances and temperature, and equal to the full width at zero intensity of the line profile. Although the knot geometry in the case of Hen 2–147 is far more complex and varied than that of the model analysed by Hartigan et al. (Ha87 (1987)), the predicted effects are qualitatively similar: the line profiles widen and present asymmetric shapes throughout the nebula. Several nebulae in the literature present similar broad and irregular [Nii] and [Sii] profiles which can be explained by shock excitation, as in the case of P Cygni (Barlow et al. Ba94 (1994)).
5 The distance
5.1 Period-Luminosity relationship for the Mira of Hen 2–147
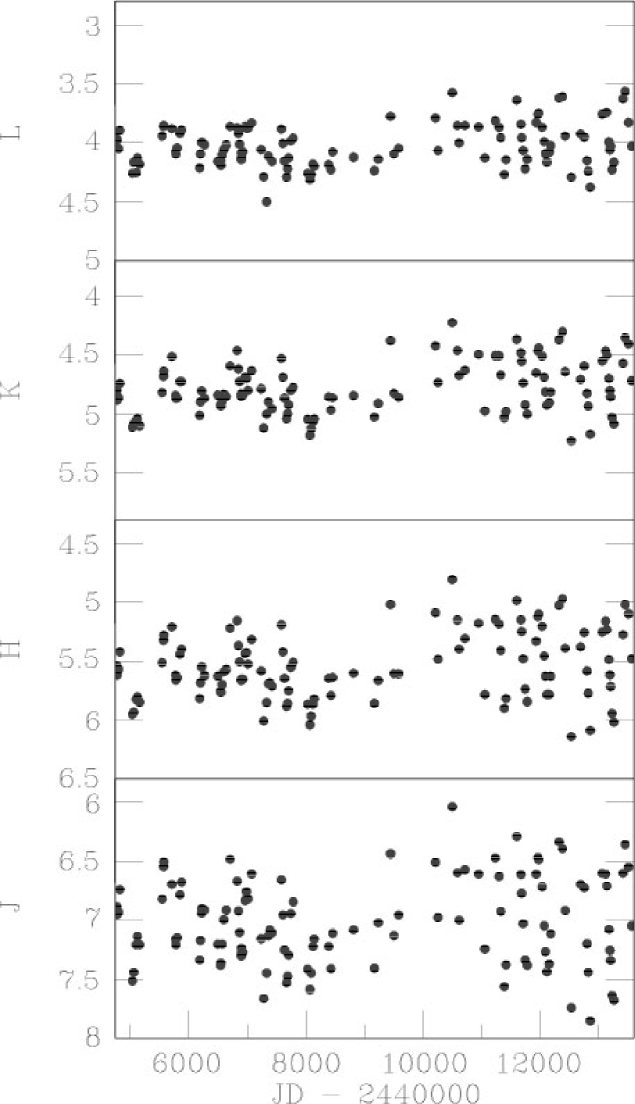
The light-curves of Hen 2–147 spanning the last 25 years are presented in Fig. 13. The mean light levels vary by a few tenths of a magnitude, as they typically do among non-symbiotic O-rich Miras (e.g. Whitelock et al. Wh00 (2000)). Note, however, that these light-curves show no evidence of obscuration events of the type very commonly observed in light-curves of symbiotic Miras (e.g. Whitelock Wh87 (1987)). A Fourier analysis of these data indicates a pulsation period of 373 days with maximum light at occurring on JD 2450476; Fig. 14 shows the light-curve phased at that period. The Fourier mean magnitudes and peak-to-peak amplitudes are given in Table 1. These amplitudes are within the range shown by non-symbiotic Miras with similar pulsation periods (Whitelock et al. Wh00 (2000)).
| mag | 6.85 | 5.43 | 4.71 | 3.95 |
|---|---|---|---|---|
| 0.89 | 0.70 | 0.52 | 0.40 |

If we assume that the Mira in Hen 2–147 has similar characteristics to its solitary counterparts then it is possible to derive a distance from the Mira period-luminosity (PL) relation (Feast et al. Fe89 (1989)), after correcting for extinction. Whitelock et al. (Wh00 (2000)) give period-colour relations for unreddened oxygen-rich Miras which can be used to estimate the intrinsic colours of the Hen 2–147 Mira. Then the extinction can be estimated from each colour, assuming the interstellar reddening law (Glass Gl99 (2000)) is applicable to both circumstellar and interstellar reddening.
The following values of are derived for the colours mentioned: and . The value from is larger than the others and we might reasonably assume that, in common with other symbiotic Miras, there is a slight excess at . We therefore assume that the combined interstellar and circumstellar extinction is mag. The interstellar extinction can be estimated following the procedure outlined by Drimmel et al. (Dr03 (2003)) to give mag (including their rescaling procedure) or mag (without rescaling). This indicates that a significant fraction of the observed extinction is circumstellar. Therefore our assumption that the circumstellar material obeys the same reddening law as the interstellar material could be important.
Correcting the observed mean from Table 1 for reddening we have . Using the PL from Feast et al. (Fe89 (1989)), with a distance modulus for the LMC of mag, we find for a 373 day variable. The distance is therefore kpc, where the error is statistical. It is difficult to quantify systematic errors due to possible differences in symbiotic and non-symbiotic Miras or between circumstellar and interstellar extinction, but these will increase the uncertainty.
The strength of the Ki resonant doublet at 7665, 7699 Å, offers an independent, direct measure of the amount of material along the line of sight toward Hen 2–147. We use the calibration by Munari & Zwitter (Mu97 (1997)) relating the reddening to the equivalent width of 7699 Å line (the 7665 Å being usually affected by telluric absorption lines). We have measured KI lines on a deep FEROS spectrum we obtained with the 2.2m telescope at ESO (La Silla) on February 2003. The interstellar lines show two components. The bluer one is located at heliocentric velocity 37(1) km/sec, and has an equivalent width of 0.178 Å corresponding to a reddening =0.69. The redder component is located at heliocentric velocity 21(2) km/sec, and has an equivalent width of 0.065 Å corresponding to a reddening =0.23. The total reddening affecting Hen 2–147 is therefore =0.92 or mag. With this determination of the total extinction between us and the Mira the distance refines to 3.00.4 kpc.
5.2 Expansion parallax
The expansion parallax of the nebula of Hen 2–147 can be determined in a straightforward way from the present data assuming 1) the circular ring model of Section 4.2, 2) that the knots of Hen 2–147 expanded radially and suffered no significant acceleration in the period between 2001 and 2004, and 3) that we are observing matter motions (and not a shock expansion) in the plane of the sky. Under these circumstances, a given knot at an angular distance in the plane of the sky in the 2001 image will have moved to in the 2004 one. The magnification factor can be defined as , so that the angular expansion in the plane of the sky is . Let be the angle of a given point of the ring, in the plane of the sky, measured from the minor axis of the ellipse (i.e. latitude of the ellipse in the plane of the sky). Considering the expanding inclined ring model, a given knot at an angle (measured from the minor axis of the ellipse, in the plane of the sky) which moves at a spatial velocity will therefore show an expansion in the plane of the sky, during an interval of time , given by
| (1) |
Thus, the distance from the observer to Hen 2–147 is simply
| (2) |
We then compute the distance for each of the four regions analysed in section 4.1, finding values of 1.840.34, 1.600.27, and 1.840.46 kpc for the north, south, and east regions respectively. As discussed in Sections 4.1 and 4.2, the western side of the nebula presents excess velocities both in the plane of the sky and along the line of sight. Adding these excess velocities to the spatio-kinematical model adopted, a distance, 1.210.53 kpc, similar to that found for the other regions is determined. This result supports the idea that the adopted geometry (and inclination) applies also to the western portion of the nebula, and that gas in different regions has not suffered significant or differential acceleration between 2001 and 2004. Averaging the determinations above, we obtain 1.5 0.4 kpc for the expansion parallax of Hen 2–147, a result which does not change if any of the other possible centres of the nebula is adopted (Sect. 4.1).
5.2.1 The effects of shocks on the expansion parallax
The Mira PL relation and the expansion parallax provide apparently inconsistent results. One way to reconcile them is to consider that shocks play a major role in the application of the expansion parallax method. In the case of a strong shock, the apparent expansion in the plane of the sky that we observe in the images would not represent the expansion of matter, but rather the (faster) expansion of the shock front through the material. On the other hand, along the line of sight (spectra) we would be measuring the Doppler shift of the gas motion. If shocks are important, the expansion parallax method would underestimate the distance (Mellema, Me04 (2004), Schönberner Sc05 (2005)).
According to the bow shock models of Hartigan et al. (1987), the shock velocity is given by the FWZI of the nebular emission lines. In the case of Hen 2–147, that implies 160 km s-1 (see Fig. 11, bottom panel). Under this hypothesis, in equation (1) the gas expansion velocity should be replaced by the shock velocity, and as a consequence the distance to Hen 2–147 derived from the expansion would increase to 2.70.5 kpc.
6 Discussion and conclusions
Previous studies of Hen 2–147 showed that this symbiotic system contains an oxygen-rich Mira and an extended ionized nebula, which appeared to be an inclined expanding ring of gas ejected from the system a few hundred years ago (Corradi et al. Co99 (1999)). In this work, we have gathered high quality multi-wavelength observations which allow us to investigate in more detail the structure and dynamics of the nebula. As often happens in science, this closer look reveals several puzzling properties which have to be explained as part of our endeavour to understand the nature of the object and to determine its basic properties, including its distance via the expansion parallax of the nebula.
The near-IR photometry has allowed us to study the light curve of the Mira within Hen 2–147. Its pulsation period is 373 days and it lacks the obscuration events typical of many other D-type symbiotic stars. The [Nii] HST images, of unprecedented spatial resolution, show the nebula surrounding Hen 2–147 as an ellipsoid which is fragmented into numerous diffuse knots and filaments of different surface brightness. The multi-epoch imaging clearly resolve the expansion of the nebula in the plane of the sky. Doppler-shift measurements from VLT integral-field spectroscopy, in combination with the HST images, demonstrate that the intrinsic geometry of the nebula is indeed that of a circular, knotty ring of ionized gas with a 5′′.202 diameter, inclined 682 to the line of sight, and expanding at 90 km s-1.
Whatever the details of the dynamics of the nebula are, it is clear that the circumstellar gas distribution within Hen 2–147 is highly aspherical. It seems possible that the plane within which the nebula is concentrated actually coincides with the orbital plane of the system, although there is no direct evidence for this. Some models predict gravitational focusing of the Mira mass-loss toward the orbital plane (Mastrodemos & Morris Ma99 (1999); Gawryszczak et al. Ga03 (2003)), while others suggest that equatorially compressed AGB winds can form if rotation of the star is near its critical break-up rate (García-Segura et al. Ga99 (1999)). In such a case, any fast wind or ejecta from the outbursting white dwarf companion would produce strong shocks in the orbital or rotational plane, these could manifest themselves in the type of nebula observed around Hen 2–147. It is, however, remarkable that there is no evidence at all for ionized gas at moderate and high latitudes above/below the plane of the ring. It thus appears that, even in widely spaced binary systems with orbital periods of tens or perhaps even hundreds of years like symbiotic Miras, binary interactions have a strong influence on the mass-loss geometry of the system. Note that several planetary nebulae, such as K 1–9 and ScWe 3 (Schwarz et al. Sc92 (1992)), also appear as thin rings whose formation mechanisms might be similar to that of Hen 2–147. The alternative, that the equatorially collimated outflows are actually ejecta from the white dwarf companion, interacting with a much less dense (and less collimated) circum-binary AGB wind, is less likely.
The new and rather puzzling information revealed by the observations discussed here is described below.
First, the core is offset from the centre of the expansion of the nebula, both spatially and in terms of its radial velocity. This effect has been found in other objects, possibly because all of them are binary systems. In addition to Hen 2–147, other examples may be GG Tau, a young multiple-star system (Krist et al. Kr02 (2002)), MyCn 18, a planetary nebula which is suspected of containing a binary nucleus (Bryce et al. Br04 (2004)), and several other planetary nebulae studied by McLean et al. (Mc03 (2003)). One can try to explain the offset considering momentum conservation and an inhomogeneous circular nebula. The nucleus would recoil back after the ejection, receding from the denser, more massive knots. Even if ionisation is mainly due to shocks and the western knots are not the more massive ones, at the distance discussed earlier and with a typical symbiotic system mass of 2 M⊙, the nucleus would need to recoil back at 10 km s-1 after ejecting M 0.2 M⊙ towards the east. This is at least one order of magnitude larger than the total mass lost by the Mira since the nova outburst. Instead, the property can be satisfactorily accounted for by orbital interaction in an eccentric binary system (Soker et al. So98a (1998)). The difference in the Mira orbital velocities in apastron and periastron could give rise to an asymmetry in mass loss, averaged over an entire orbit. This, after the reshaping of the Mira winds by the white dwarf during an outburst, would eventually lead to a significant offset of the nucleus from the centre of the nebula. A similar scenario has been suggested for MyCn 18 by Soker et al. (So98a (1998)) and leads to a very speculative orbital period of a few hundreds of years, which is typical of symbiotic systems containing a Mira.
Secondly, a most notable property of the outflow of Hen 2–147 is the extreme broadening of the emission lines in the spectra of the knots all over the nebula (FWZI 160 km s-1). The broadening is significantly larger than the “average” (intensity-weighted) expansion velocity itself. This has important implications for the understanding of the dynamics of the outflows, and in the determination of the distance. Two possible explanations for the line broadening are outlined below. (): the expansion of the outflow in a high density medium which undergoes strong cooling might develop a thin front layer which is fragmented into clumps of different density. The flow velocity along the walls of these structures could be of the same order of the expansion velocities themselves (Icke, private communication); (): the presence of a strong shock, traveling outwards through the nebula, as a result of the interaction between the slow Mira wind and the fast white dwarf ejecta produced during the nova explosion. In fact, although the high [Nii]/H flux ratio does not imply unequivocally the presence of shocks, nor is it the highest found among planetary nebulae (Perinotto & Corradi Pe98 (1998)), it nevertheless supports such an interpretation.
Thirdly, significant deviations from the overall expansion pattern are found in the kinematics of some knots, especially those located to the west of the core and close to it. In that region, both the radial and the tangential velocities are larger than in the rest of the nebula, and the surface brightness is enhanced.
Finally, the determination of the distance deserves a special mention. The main original aim of our multi-epoch imaging of Hen 2–147 was to compute the expansion parallax of the nebula and derive its distance, a crucial parameter (and often one of the most uncertain) in discussions of the physics of any astrophysical object. The expansion parallax is traditionally considered as a robust, purely geometrical method to compute distances, in which no assumptions need to be made about the physics of the object. Hen 2–147 shows that the situation is far from simple; there are clear indications (broadening of the emission lines, discrepancy with the distance obtained via the Mira Period-Luminosity relation) that what we measure in the plane of the sky is not the expansion of matter, but rather the expansion of a shock front. If we do not take this into account, a straightforward application of the expansion parallax method results in a distance of Hen 2–147 of 1.50.4 kpc. If instead we include the effects of shocks (see section 5.2.1), the distance to Hen 2–147 scales up to 2.70.5 kpc, in agreement with the distance of 3.00.4 kpc obtained using the period-luminosity relation for the Mira.
A detailed spectroscopic analysis is essential to determine if shock excitation is actually important in this nebula. Nevertheless, the large difference in the distance determination, in the presence or absence of shocks, shows that one must be extremely careful when estimating distances via the expansion parallax method. This has been demonstrated, theoretically, by Mellema (Me04 (2004)) and Schönberner et al. (Sc05 (2005)) in the case of planetary nebulae. The method is also widely used to estimate distances for supernovae (Panagia Pa98 (1998)) and classical novae (e.g. Chochol et al. Ch97 (1997), Esenoglu et al. Es00 (2000), Krautter et al. Kr02 (2002), Lyke et al. Ly03 (2003)), and the same caution should be exercised in these studies. We should also emphasize that for a spatially resolved nebula, simultaneous study of the structure and kinematics are essential to correctly determine the geometrical, kinematical and projection parameters.
In the case of Hen 2–147, it is indeed the combination of a thorough study of the nebular geometry and kinematics along the line of sight and in the plane of the sky, together with the fact that an independent distance estimation can be obtained from the near-IR data, that makes our conclusion a robust one: the two distance methods agree if the expansion in the plane of the sky corresponds to the expansion of a strong shock front. One possible test for the presence of shocks would be to examine emission lines sensitive to shocks (e.g. the vs. diagnostic diagram, see Hollis et al. Ho92 (1992)). Note also that the distance obtained using the Mira PL relation could be scaled down to the value of 1.7 kpc from the expansion parallax result, in the absence of shocks, only if the (presumably circumstellar) extinction in -band is 1.13 magnitudes larger than estimated in section 5.1 (corresponding to an extinction larger by 10 magnitudes in ). This seems highly unlikely, although we cannot completely rule out this possibility.
For these reasons, we adopt a distance to Hen 2–147 of 2.90.4 kpc. At this distance, the physical radius of the ring nebula is 0.04 pc. In addition, the apparent expansion indicates that the nebula was ejected some 200 years ago. This is likely to be the epoch at which the white dwarf companion of the Mira experienced a nova outburst, from which the system has almost completely recovered (Munari Muna97 (1997)); the currently observed spectrum of the core is characteristic of the quiescent phase of symbiotic novae (Munari & Zwitter 2002 ).
Acknowledgements.
The authors wish to thank Vera Khozurina-Platais, Warren Hack, Anton Koekemoer, and Richard Hook from the STScI for their kind help in multidrizzle usage; Reinhard Hanuschik for the FLAMES data pipeline processing; Mariano Santander, Corrado Giammanco, Bruce Balick and Vincent Icke for ideas and comments; the following observers from SAAO who contributed to the near-infrared photometry: Brian Carter, Greg Roberts, Johnathan Spencer Jones, Robin Catchpole and Michael Feast; and the anonymous referee for pointing out an error in equation (1) in the first version of this paper.References
- (1) Bond, H. E., Ciardullo, R., & Webbink, R., 1996, Amer. Astron. Soc. Meet, 189, 9704
- (2) Barlow, M. J., Drew, J. E., Meaburn, J., & Massey, R. M., 1994, MNRAS, 268, L29
- (3) Bryce, M., Bains, I., López, J. A., & Redman, M. P., 2004, ASPC, 313, 104
- (4) Carter, B. S., 1990, MNRAS, 242, 1
- (5) Chevalier, R. A., Luo, D., 1994, ApJ, 421, 225
- (6) Chochol, D., Grygar, J., Pribulla, T., Komžík, R., Hric, L., & Elkin, V., 1997, A&A, 318, 908
- (7) Corradi, R. L. M., & Schwarz, H., 1993, A&A, 268, 714
- (8) Corradi R. L. M., & Schwarz H. E., 1997, in: Mikolajewska J. (ed.) Physical processes in Symbiotic binaries and related systems. Copernicus Foundation for Polish Astronomy, Warsaw, p. 147
- (9) Corradi, R. L. M., Ferrer, O. E., Schwarz, H. E., Brandi, E., & García, L., 1999, A&A, 348, 978
- (10) Corradi, R. L. M., Livio, M., Balick, B., Munari, U., Schwarz, H. E., 2001, ApJ 553, 211
- (11) Corradi, R.L.M., 2003, in ‘Symbiotic stars probing stellar evolution’, Corradi R.L.M., Mikolajewska J. & Mahoney T.J. eds., ASP Conf. Ser., Vol. 303, p. 393
- (12) Drimmel, R., Cabrera-Lavers, A. & López-Corredoira, M., 2003, A&A, 409,205
- (13) Esenoglu, H. H., Saygac, A. T., Bianchini, A., Retter, A., özkan, M. T., Altan, M., 2000, A&A, 364, 191
- (14) Feast, M. W., Glass, I. S., Whitelock, P. A. & Catchpole, R. M., 1989, MNRAS, 241, 375
- (15) García-Segura, G., Langer, N., Różyczka, M., & Franco, J., 1999, ApJ, 517, 767
- (16) Gawryszczak, A. J., Mikolajewska, J., & Różyczka, M., 2003, A&A, 398, 159
- (17) Gill, C. D., & O’Brien, T. J., 2000, MNRAS, 314, 175
- (18) Glass, I.S., 1999, Handbook of infrared astronomy, CUP
- (19) Guerrero, M., You-Hua, C., & Miranda, L. F., 2004, AJ, 128, 1694
- (20) Koekemoer, A., Fruchter, A., Hook, R., & Hack, W., 2002, HST Calibration Workshop, p. 337
- (21) Kenyon, S.J., 1986, The Symbiotic Stars, Cambridge University Press
- (22) Kenyon, S.J., & Webbink, R.F. 1984, ApJ 279, 252
- (23) Krautter, J., Woodward, C. E., Schuster, M. T., Gehrz, R. D., Jones, T. J., Belle, K., Evans, A., Leyers, S. P. S., Starrfield, S., Truran, J., Greenhouse, M. A., 2002, AJ, 124, 2888
- (24) Harman, D. J., & O’Brien, T. J., 2003, MNRAS, 344, 1219
- (25) Hartigan, P., Raymond, D., & Hartmann, L., 1987, ApJ, 316, 323
- (26) Hollis, J. M., Oliversen, R. J., Wagner, R. M., & Feibelman, W. A., 1992, ApJ, 393, 217
- (27) Krist, J. E., Stapelfeldt, K. R., & Watson, A. M., 2002, ApJ, 570, 785
- (28) Livio, M., Prialnik, D., & Regev, O., 1989, ApJ, 341, 299
- (29) Lyke, James E., Koenig, X. P., Barlow, M. J., Gehrz, R. D., Woodward, C. E., Starrfield, S., Péquignot, D., Evans, A., Salama, A., González-Riestra, R., and 8 coauthors, 2003,AJ, 126, 993L
- (30) Mastrodemos, N., & Morris, M., 1999, ApJ, 523, 357
- (31) McLean, A., Guerrero, M. A., Gruendl, R. A.& Chu, Y. H.,2003, in: Kwok S., Dopita S. and Sutherland, R. (eds.) Planetary Nebulae: Their Evolution and Role in the Universe. Astronomical Society of the Pacific, p. 541
- (32) Mikolajweska, J., 2003, ASPC, 303, 9
- (33) Mellema, G., A&A, 2004, 416, 623
- (34) Munari U., & Patat F., 1993, A&A 277, 195
- (35) Munari, U., 2003, in Symbiotic Stars Probing Stellar Evolution, R.L.M. Corradi et al. eds., ASP Conf. Ser. 303, 518
- (36) Munari, U., Yudin, B. F., Taranova, O. G., Massone, G., Marang, F., Roberts, G., Winkler, H. & Whitelock, P. A., 1992, A&AS, 93, 383
- (37) Munari, U. & Renzini, A.1992, ApJ 397, L87
- (38) Munari U., 1997, in: Mikolajewska J. (ed.) Physical processes in Symbiotic binaries and related systems. Copernicus Foundation for Polish Astronomy, Warsaw, p. 37
- (39) Munari, U. & Zwitter, T., 1997, A&A, 318, 269
- (40) Munari, U. & Zwitter, T., 2002, A&A, 383, 188
- (41) Reed, D. S.,Balick, B., Hajian, A. R., Klayton, T. L., Giovanardi, S., Casertano, S., & Panagia, N., 1999, AJ, 118, 2430
- (42) Palen, S. E., Hajian, A. R., & Balick, B., 2000, AAS, 196, 6101
- (43) Panagia, N., 1998, MmSAI, 69, 225
- (44) Paresce, F., & Hack, W., 1994, A&A, 287, 154
- (45) Perinotto, M., & Corradi, R. L. M., 1998, A& A, 332, 721
- (46) Santander-García, M., Corradi, R. L. M., Balick, B., & Mampaso, A., 2004, A&A, 426, 185
- (47) Santander-García, M., Corradi, R. L. M., & Mampaso, A., 2005, Szczerba R., Stasińska G. and Górny S. K. (eds.) Planetary Nebulae as astronomical tools. AIP Conference Proceedings, p. 179
- (48) Schmeja, S., & Kimeswenger, S., 2001, A &A, 377, 18
- (49) Schönberner, D., Jacob, R., & Steffen, M., 2005, A &A, 441, 573
- (50) Schwarz, H. E., Aspin, C., Lutz, J.H., 1989, ApJ 344, L29
- (51) Schwarz, H. E., Corradi, R. L. M., & Melnick, J., 1992, A&A, 96, 23
- (52) Schwarz, H. E., Aspin, C., Corradi, R. L. M., & Reipurth, B., 1995,AnIPS, 11, 292
- (53) Slavin, A., J., O’Brien, T. J., & Dunlop, J. S., 1995, MNRAS, 276, 353
- (54) Smith, N., Balick, B., & Gehrz, R. D.,
- (55) Solf, J., 1983, ApJ266, L113
- (56) Solf, J., 1984, A&A, 139, 296
- (57) Solf, J., & Ulrich, H., 1985, A&A, 148, 274
- (58) Soker, N., Rappaport, S., & Harpaz, A., 1998, ApJ, 496, 842
- (59) Soker, N., & Regev, O., 1998, AJ, 116, 2462
- (60) Sokoloski, J.L. 2002, in Symbiotic Stars Probing Stellar Evolution, R.L.M. Corradi et al. eds., ASP Conf. Ser. 303, 202
- (61) Van Winckel, H., Schwarz, H. E., Duerbeck, H. W., & Fuhrmann, B., 1994, A&A, 285, 241
- (62) Whitelock, P. A., 1988, in: Mikolajewska J., Friedjung Kenyon S.J., Viotti R. (eds.) The Symbiotic Phenomenon. Kluwer Academic Publisher, Dordrecht, p. 47
- (63) Whitelock, P. A., 1987, PASP, 99, 573
- (64) Whitelock, P.A., & Munari, U., 1992, A&A 255, 171
- (65) Whitelock, P., Marang, F. & Feast, M., 2000, MNRAS, 319, 728
| JD | ||||
|---|---|---|---|---|
| –2440000 | (mag) | |||
| 4769.3 | 6.88 | 5.54 | 4.80 | 3.90 |
| 4777.3 | 6.94 | 5.58 | 4.85 | 3.97 |
| 4779.4 | 6.95 | 5.61 | 4.88 | 4.04 |
| 4802.3 | 6.93 | 5.57 | 4.86 | 4.05 |
| 4823.2 | 6.74 | 5.42 | 4.74 | 3.89 |
| 5036.5 | 7.51 | 5.95 | 5.11 | 4.26 |
| 5060.6 | 7.44 | 5.93 | 5.09 | 4.16 |
| 5100.5 | 7.20 | 5.82 | 5.05 | 4.25 |
| 5121.4 | 7.14 | 5.80 | 5.04 | 4.13 |
| 5159.3 | 7.20 | 5.84 | 5.10 | 4.18 |
| 5544.3 | 6.82 | 5.51 | 4.82 | 3.94 |
| 5569.2 | 6.54 | 5.32 | 4.68 | 3.86 |
| 5573.2 | 6.50 | 5.28 | 4.64 | 3.85 |
| 5710.6 | 6.69 | 5.21 | 4.51 | 3.88 |
| 5773.6 | 7.16 | 5.62 | 4.84 | 4.08 |
| 5779.6 | 7.20 | 5.66 | 4.87 | 4.09 |
| 5801.6 | 7.14 | 5.64 | 4.86 | 4.04 |
| 5846.4 | 6.78 | 5.44 | 4.73 | 3.92 |
| 5876.3 | 6.67 | 5.40 | 4.73 | 3.89 |
| 6186.4* | 7.33 | 5.82 | 5.01 | 4.21 |
| 6199.4 | 7.17 | 5.68 | 4.90 | 4.09 |
| 6219.5 | 6.94 | 5.55 | 4.80 | 3.99 |
| 6225.4 | 6.90 | 5.55 | 4.81 | 3.99 |
| 6266.3 | 6.91 | 5.62 | 4.87 | 4.01 |
| 6493.6 | 7.20 | 5.63 | 4.84 | 4.16 |
| 6541.5 | 7.38 | 5.76 | 4.93 | 4.15 |
| 6548.5 | 7.36 | 5.76 | 4.93 | 4.19 |
| 6569.5 | 7.20 | 5.70 | 4.89 | 4.10 |
| 6596.4 | 6.99 | 5.59 | 4.83 | 4.05 |
| 6640.3 | 6.91 | 5.57 | 4.85 | 4.02 |
| 6704.2 | 6.48 | 5.22 | 4.59 | 3.86 |
| 6825.6 | 6.66 | 5.16 | 4.46 | 3.87 |
| 6848.6 | 6.92 | 5.37 | 4.62 | 3.92 |
| 6867.5 | 7.10 | 5.51 | 4.73 | 4.01 |
| 6895.6 | 7.30 | 5.66 | 4.85 | 4.14 |
| 6897.6 | 7.24 | 5.66 | 4.83 | 4.12 |
| 6897.6 | 7.27 | 5.65 | 4.83 | 4.09 |
| 6923.5 | 7.27 | 5.65 | 4.84 | 4.07 |
| 6961.4 | 6.83 | 5.43 | 4.69 | 3.86 |
| 6985.3 | 6.76 | 5.43 | 4.70 | 3.87 |
| 7010.3 | 6.82 | 5.52 | 4.80 | 3.88 |
| 7073.2 | 6.61 | 5.31 | 4.63 | 3.83 |
| 7235.6 | 7.16 | 5.58 | 4.79 | 4.06 |
| 7280.5 | 7.66 | 6.01 | 5.12 | 4.29 |
| 7328.4 | 7.45 | 5.85 | 5.00 | 4.50 |
| 7358.3 | 7.13 | 5.69 | 4.90 | 4.11 |
| 7384.3 | 7.08 | 5.68 | ||
| 7581.6 | 6.66 | 5.19 | 4.53 | 3.88 |
| 7609.5 | 6.95 | 5.42 | 4.69 | 4.00 |
| 7634.6 | 7.25 | 5.65 | 4.86 | 4.15 |
| 7669.5 | 7.53 | 5.88 | 5.04 | 4.29 |
| 7688.5 | 7.47 | 5.86 | 5.00 | 4.22 |
| 7705.4 | 7.29 | 5.75 | 4.92 | 4.13 |
| 7742.4 | 6.94 | 5.55 | 4.80 | 3.98 |
| 7782.3 | 6.84 | 5.51 | 4.77 | 3.96 |
| 8030.5 | 7.41 | 5.86 | 5.05 | 4.26 |
| 8067.4 | 7.59 | 6.04 | 5.18 | 4.31 |
| 8089.3 | 7.45 | 5.96 | 5.12 | 4.27 |
| 8121.2 | 7.22 | 5.87 | 5.07 | 4.18 |
| 8142.3 | 7.16 | 5.82 | 5.04 | 4.20 |
| 8388.5 | 7.22 | 5.64 | 4.86 | 4.18 |
| 8427.4 | 7.41 | 5.79 | 4.97 | 4.23 |
| 8457.3 | 7.11 | 5.64 | 4.86 | 4.07 |
| 8813.4 | 7.08 | 5.60 | 4.84 | 4.12 |
| 9168.3 | 7.41 | 5.86 | 5.03 | 4.24 |
| 9236.3 | 7.02 | 5.66 | 4.91 | 4.14 |
| 9445.6 | 6.43 | 5.02 | 4.38 | 3.78 |
| 9503.5 | 7.13 | 5.61 | 4.83 | 4.09 |
| 9583.3 | 6.95 | 5.61 | 4.86 | 4.05 |
| 10212.6 | 6.51 | 5.09 | 4.42 | 3.79 |
| 10256.4 | 6.97 | 5.48 | 4.73 | 4.06 |
| 10500.6 | 6.03 | 4.81 | 4.22 | 3.57 |
| 10589.5 | 6.60 | 5.15 | 4.46 | 3.85 |
| 10618.4 | 7.00 | 5.39 | 4.67 | 4.00 |
| 10717.2 | 6.57 | 5.31 | 4.63 | 3.85 |
| 10949.6 | 6.61 | 5.18 | 4.50 | 3.86 |
| 11056.6 | 7.24 | 5.78 | 4.97 | 4.12 |
| 11234.6 | 6.47 | 5.14 | 4.51 | 3.81 |
| 11298.5 | 6.63 | 5.18 | 4.51 | 3.87 |
| 11329.4 | 6.92 | 5.41 | 4.67 | 3.96 |
| 11388.3 | 7.56 | 5.90 | 5.03 | 4.27 |
| 11417.3 | 7.38 | 5.82 | 4.98 | 4.14 |
| 11599.7 | 6.29 | 4.98 | 4.36 | 3.63 |
| 11674.5 | 6.61 | 5.15 | 4.48 | 3.84 |
| 11685.5 | 6.77 | 5.25 | 4.55 | 3.95 |
| 11709.5 | 7.03 | 5.48 | 4.74 | 4.06 |
| 11743.4 | 7.33 | 5.73 | 4.92 | 4.22 |
| 11781.3 | 7.38 | 5.84 | 5.00 | 4.14 |
| 11931.6 | 6.61 | 5.33 | 4.65 | 3.83 |
| 11963.6 | 6.47 | 5.12 | 4.47 | 3.76 |
| 11976.6 | 6.49 | 5.10 | 4.44 | 3.75 |
| 12033.5 | 6.71 | 5.20 | 4.51 | 3.87 |
| 12070.4 | 7.05 | 5.46 | 4.69 | 3.99 |
| 12091.5 | 7.26 | 5.62 | 4.81 | 4.09 |
| 12116.4 | 7.43 | 5.78 | 4.93 | 4.16 |
| 12154.3 | 7.37 | 5.78 | 4.90 | 4.08 |
| 12181.2 | 7.11 | 5.63 | 4.81 | 4.02 |
| 12324.6 | 6.33 | 5.02 | 4.37 | 3.62 |
| 12383.5 | 6.39 | 4.97 | 4.30 | 3.61 |
| 12429.4 | 6.91 | 5.39 | 4.64 | 3.94 |
| 12534.3 | 7.74 | 6.14 | 5.23 | 4.29 |
| 12691.6 | 6.69 | 5.38 | 4.71 | 3.92 |
| 12753.6 | 6.72 | 5.26 | 4.59 | 3.95 |
| 12801.5 | 7.20 | 5.58 | 4.83 | 4.15 |
| 12823.4 | 7.44 | 5.77 | 4.93 | 4.24 |
| 12857.3 | 7.85 | 6.09 | 5.17 | 4.37 |
| 13062.6 | 6.60 | 5.25 | 4.55 | 3.75 |
| 13118.6 | 6.61 | 5.16 | 4.47 | 3.74 |
| 13140.5 | 6.71 | 5.23 | 4.50 | 3.74 |
| 13177.4 | 7.08 | 5.48 | 4.70 | 3.99 |
| 13193.4 | 7.25 | 5.61 | 4.80 | 4.06 |
| 13203.4 | 7.34 | 5.71 | 4.86 | 4.03 |
| 13228.3 | 7.64 | 5.94 | 5.03 | 4.23 |
| 13262.2 | 7.68 | 6.02 | 5.09 | 4.16 |
| 13415.6 | 6.60 | 5.28 | 4.57 | 3.62 |
| 13452.7 | 6.36 | 5.02 | 4.35 | 3.56 |
| 13511.5 | 6.55 | 5.10 | 4.41 | 3.82 |
| 13562.3 | 7.05 | 5.48 | 4.72 | 4.03 |