COSMOLOGICAL EFFECTS OF POWERFUL AGN OUTBURSTS IN GALAXY CLUSTERS:
INSIGHTS FROM AN XMM-NEWTON OBSERVATION OF MS0735+7421
Abstract
We report on the results of an analysis of XMM-Newton observations of MS0735+7421, the galaxy cluster which hosts the most energetic AGN outburst currently known. The previous Chandra image shows twin giant X-ray cavities ( 200 kpc diameter) filled with radio emission and surrounded by a weak shock front. XMM data are consistent with these findings. The total energy in cavities and shock ( erg) is enough to quench the cooling flow and, since most of the energy is deposited outside the cooling region ( 100 kpc), to heat the gas within 1 Mpc by 1/4 keV per particle. The cluster exhibits an upward departure (factor 2) from the mean - relation. The boost in emissivity produced by the ICM compression in the bright shells due to the cavity expansion may contribute to explain the high luminosity and high central gas mass fraction that we measure. The scaled temperature and metallicity profiles are in general agreement with those observed in relaxed clusters. Also, the quantities we measure are consistent with the observed - relation. We conclude that violent outbursts such as the one in MS0735+7421 do not cause dramatic instantaneous departures from cluster scaling relations (other than the - relation). However, if they are relatively common they may play a role in creating the global cluster properties.
1 Introduction
The current generation of X-ray satellites, Chandra and XMM-Newton, has shown that the physics of the intra-cluster medium (ICM) is complex and needs to be regulated by additional, non-gravitational processes beyond simple gravity and gas dynamics considered in the standard Cold Dark Matter cosmological scenario (White & Rees 1978). In particular, our understanding of cooling flow systems has radically changed. Albeit confirming the existence of short cooling times, high densities and low temperatures in the cluster cores, the arrival of new high-resolution X-ray data has shown the lack of the emission lines expected from gas cooling below 1-2 keV and has reduced by about one order of magnitude the new spectroscopically–derived mass deposition rates (e.g. David et al. 2001, Johnstone et al. 2002, Peterson et al. 2003 and references therein). The most plausible solution to this so-called “cooling flow problem” is that some form of additional heating which balances the cooling must be acting in the ICM. Among the many proposed heating mechanisms111 Proposed heating mechanisms include electron thermal conduction from the outer regions of clusters (Tucker & Rosner 1983; Voigt et al. 2002; Fabian et al. 2002; Zakamska & Narayan 2003), continuous subcluster merging (Markevitch et al. 2001), contribution of the gravitational potential of the cluster core (Fabian 2003), feedback from intra-cluster supernovae (Domainko et al. 2004), etc. , one of the best candidates for supplying the energy is feedback from the Active Galactic Nucleus (AGN) hosted by the central galaxy of the cluster (e.g., Rosner & Tucker 1989; Tabor & Binney 1993; Churazov et al. 2001; Brüggen & Kaiser 2001; Kaiser & Binney 2003; Ruszkowski & Begelman 2002; Brighenti & Mathews 2003, Omma et al. 2004).
The possibility of AGN heating has recently become the leading idea to solve the cooling flow problem thanks to the discovery of X-ray cavities in the ICM on scales often approximately coincident with the lobes of extended radio emission (e.g., Hydra A: McNamara et al. 2000, David et al. 2001; Perseus: Böhringer et al. 1993, Churazov et al. 2000, Fabian et al. 2000; A2052: Blanton et al. 2001, 2003; A2597: McNamara et al. 2001, Pollack et al. 2005, Clarke et al. 2005; RBS797: Schindler et al. 2001, Gitti et al. 2006; A4059: Heinz et al. 2002). This indicates that the radio lobes fed by AGNs have displaced the X-ray emitting gas, creating cavities in the ICM. These outbursts can be recurrent, as it has been observed in some cases. For example, RBS797 shows evidence of a restarted AGN activity with precessing jets pointing to a different direction with respect to the one of the outer radio lobes filling the cavities (Gitti et al. 2006). The heating by AGN is thought to occur through the dissipation of the cavity enthalpy and through shocks driven by the bubbles inflated by the AGN. Systematic studies of a sample of X-ray cavities show that their enthalpies222 The enthalpy (free energy) of the cavities is estimated from the total AGN power as , where the work done by the jet as it inflates the cavity is determined by measuring the cavity size and its surrounding pressure, and the adiabatic index is related to the internal composition of the cavities, still unknown. In the case of a relativistic plasma = 4/3 and . lie between erg and scales in proportion to the cooling X-ray luminosity and the radio power of the host system. In more than a half of the sample the energy input from the central radio source is currently sufficient to balance cooling (Bîrzan et al. 2004, Rafferty et al. 2006). The trend between X-ray luminosity and bubble mechanical luminosity, together with the existence of short central cooling time, suggests that the AGN is fueled by a cooling flow that is itself regulated by feedback from the AGN. The basic idea of this AGN-cooling flow scenario is that a self-regulated equilibrium may be achieved, in which the energy input from the AGN balances the radiative losses of the ICM over the lifetime of the cluster.
The recent discovery of giant cavities and associated large-scale shocks in three system (MS0735+7241: McNamara et al. 2005, Hercules A: Nulsen et al. 2005a, Hydra A: Nulsen et al. 2005b) has shown that AGN outbursts can not only affect the central regions, but also have an impact on cluster-wide scales. In particular, the supercavities discovered in MS0735+7421 have a diameter of about 200 kpc each and a weak cocoon shock surrounding them has been detected. This large-scale outburst is the most powerful known so far: it releases upward of erg into the ICM, heating the gas beyond the cooling region (McNamara et al. 2005). In this paper we want to investigate the significant consequences that this new development has for several fundamental problems in astrophysics. One important problem addressed by giant cavities is the so-called cluster ”pre-heating”, which is manifested in the steepening of the observed luminosity vs. temperature relation for clusters with respect to theoretical predictions that include gravity alone (e.g., Markevitch 1998). Some extra non-gravitational energy is required to explain such a steepening (e.g., Wu et al. 2000, Voit 2005), and one possibility is that it is supplied by AGN outburst. The additional non-gravitational heating supplied by AGN could also induce the suppression of the gas cooling in massive galaxies required to explain the exponential turnover at the bright end of the luminosity function of galaxies (Benson et al. 2003). This would indicate a common solution for the two major heating problems associated with the ICM: those of cooling flow and galaxy formation. Some cavities live longer than the time it takes to cross their own diameters, suggesting they are in pressure balance with the surrounding medium. Since the work required to inflate the radio lobes generally exceeds the nonthermal minimum energy of the radio emission (e.g., De Young 2006 and references therein), in the hypothesis that the assumptions adopted into the equipartition calculation are correct, some additional component besides the relativistic plasma may fill the cavity and contribute to support them internally. We want to investigate what is currently providing the necessary pressure support to sustain the cavities. Finally, in a more general view, we want to investigate what is the potential impact that such powerful outbursts have on the global properties of the ICM. Understanding well the ICM physics is essential to use galaxy clusters as high-precision cosmological tools.
We address these problems by studying the X-ray properties of the most energetic outburst known in a galaxy cluster. MS07357421 (hereafter MS0735) is at a redshift of 0.216. With a Hubble constant of , and , the luminosity distance is 1069 Mpc and the angular scale is 3.5 kpc per arcsec.
2 Observation and data preparation
MS0735 was observed by XMM–Newton in April 2005 during revolution 0973. In this paper only data from the European Photon Imaging Camera (EPIC) are analyzed and discussed, while those from the Reflection Grating Spectrometer (RGS) will be presented in a subsequent paper. The MOS and pn detectors were both operated in Full Frame Mode with the THIN filter, for an exposure time of 70.6 ks for MOS and 60.7 ks for pn. We use the SASv6.5.0 processing tasks emchain and epchain to generate calibrated event files from raw data. Throughout this analysis single pixel events for the pn data (PATTERN 0) are selected, while for the MOS data sets the PATTERNs 0-12 are used. The removal of bright pixels and hot columns is done in a conservative way applying the expression (FLAG==0). To reject the soft proton flares we accumulate the light curve in the [10-12] keV band for MOS and [12-14] keV band for pn, where the emission is dominated by the particle–induced background, and exclude all the intervals of exposure time having a count rate higher than a certain threshold value (the chosen threshold values are 0.4 cps for MOS and 0.7 cps for pn). The remaining exposure times after cleaning are 50.4 ks for MOS1, 49.5 ks for MOS2 and 42.0 ks for pn. Starting from the output of the SAS detection source task, we make a visual selection on a wide energy band MOS & pn image of point sources in the field of view. Events from these regions are excluded directly from each event list. The source and background events are corrected for vignetting using the weighted method described in Arnaud et al. (2001), the weight coefficients being tabulated in the event list with the SAS task evigweight. This allows us to use the on-axis response matrices and effective areas.
Unless otherwise stated, the reported errors are at 90% confidence level.
2.1 Background treatment
The background estimates are obtained using a blank-sky observation consisting of several high-latitude pointings with sources removed (Lumb et al. 2002). The blank-sky background events are selected using the same selection criteria (such as PATTERN, FLAG, etc.), intensity filter (for flare rejection) and point source removal used for the observation events. This yields final exposure times for the blank fields of 365 ks for MOS1, 350 ks for MOS2 and 294 ks for pn. Since the cosmic ray induced background might change slightly with time, we compute the ratio of the total count rates in the high energy band ([10-12] keV for MOS and [12-14] keV for pn). The obtained normalization factors (1.266, 1.303, 1.283 for MOS1, MOS2 and pn, respectively) are then used to renormalize the blank field data. The blank-sky background files are recast in order to have the same sky coordinates as MS0735.
The usual approach to perform the background subtraction is described in full detail in Arnaud et al. (2002). This procedure consists of two steps. In a first step, for each product extracted from the observation event list an equivalent product is extracted from the corresponding blank-field file and then subtracted from it. This allows us to remove the particle background. However, if the background in the observation region is different from the average background in blank field data, this step could leave a residual background component. The residual background component is estimated by using blank-field-subtracted data in a region free of cluster emission (in particular we consider an annulus lying between 8 and 10 arcmin) and then subtracted in a second step from each MOS and pn product. In our case the residual is negative in the energy band adopted for the spatial analysis ([0.4-2] keV, see Sect. 3.1). The residual count rate summed over the three detectors is counts/s, which represents of the total background count rate in this energy band.
The fluorescent emission lines333 Al and Si lines at 1.5 and 1.7 keV, respectively, in the MOS data, and Ni, Cu and Zn lines around 8 keV in the pn data. excited by the energetic charged particles that pass through the detector exhibit spatial variation over the detector. This effect would compromise the reliability of the second step of the background subtraction for spectra, as the resulting total background spectrum (sum of the particle background spectrum, estimated in the blank-field-subtracted cluster region, and the residual background component, estimated in the blank-field-subtracted outer annular region) shows fluorescence lines which are shifted by a few energy channels with respect to the MS0735 spectrum. Therefore the residual background component is neglected for the purpose of the spectral analysis.
3 Morphological analysis
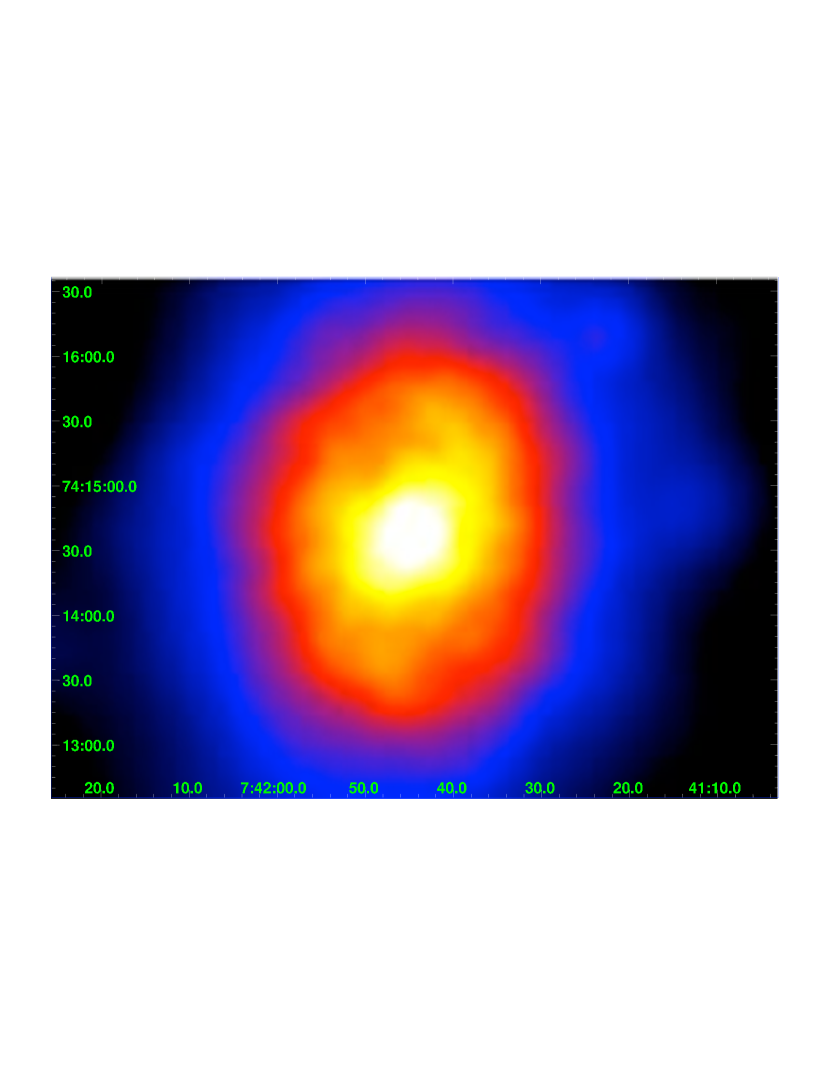
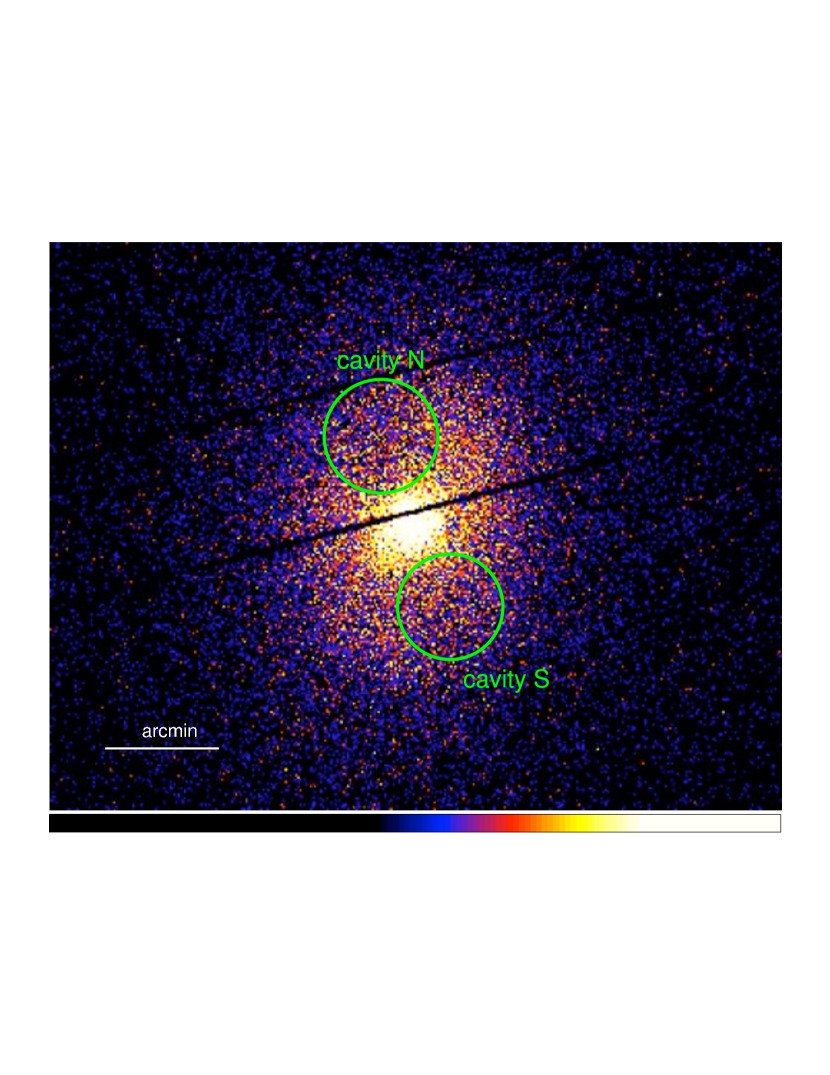
The adaptively smoothed, exposure corrected MOS1 count rate image in the [0.3-10] keV energy band is presented in Fig. 1. The smoothed image is obtained from the raw image corrected for the exposure map (that accounts for spatial quantum efficiency, mirror vignetting and field of view) by running the task asmooth set to a desired signal-to-noise ratio of 20. Regions exposed with less than 10% of the total exposure are not considered.
The inner part of the cluster shows the high surface brightness characteristic of a cooling flow. We notice a sharp central surface brightness peak at a position (J2000). At small radii, two strong depressions having a diameter of about 150 kpc (see Sect. 3.1) are visible on opposite side of the cluster center in the NE-SW direction. The cavities are surrounded by a bright X-ray emission of elliptical shape, in the form expected by a radio cocoon. The elliptical discontinuity in the X-ray surface brightness appears more evident in the Chandra data and has been interpreted as a weak shock (McNamara et al. 2005). Beyond the cavity region the cluster maintains a slightly elliptical morphology up to large radii, showing hints of structures that could be the results of past radio activity that created older cavities.
3.1 Surface brightness profile
We consider different sectors to the north and south (N sector: between 10∘ west and 60∘ east of north; S sector: between 15∘ east and 60∘ west of south) and to the east and west (E sector: between 30∘ north and 75∘ south of east; W sector: between 30∘ south and 80∘ north of west) in order to include and exclude the cavity regions, respectively. We also consider a full sector in which we mask the cavities (hereafter undisturbed cluster). For each sector, we compute a background-subtracted, vignetting-corrected, radial surface brightness profile in the [0.4-2] keV energy band for each camera separately. For the pn data, we generate a list of out-of-time events444Out-of-time events are caused by photons which arrive while the CCD is being read out, and are visible in an uncorrected image as a bright streak smeared out in RAWY. (hereafter OoT) to be treated as an additional background component. The effect of OoT in the current observing mode (Full Frame) is 6.3%. The OoT event list is processed in a similar way as done for the pn observation event file. The profiles for the three detectors are then added into a single profile, binned such that at least a signal-to-noise ratio of 3 is reached.
The cluster emission is detected up to 1.3 Mpc ( arcmin). In Fig. 2 we show the X-ray surface brightness profile for the sector containing the northern cavity compared from that of the undisturbed cluster. We note that the data of the undisturbed cluster appear regular, while those for the N sector show a clear deficit of emission between radii and 200 kpc relative to the other directions. The S sector profile shows a behavior similar to the N one, although the depression is less pronounced, whereas the E and W sectors appear regular.
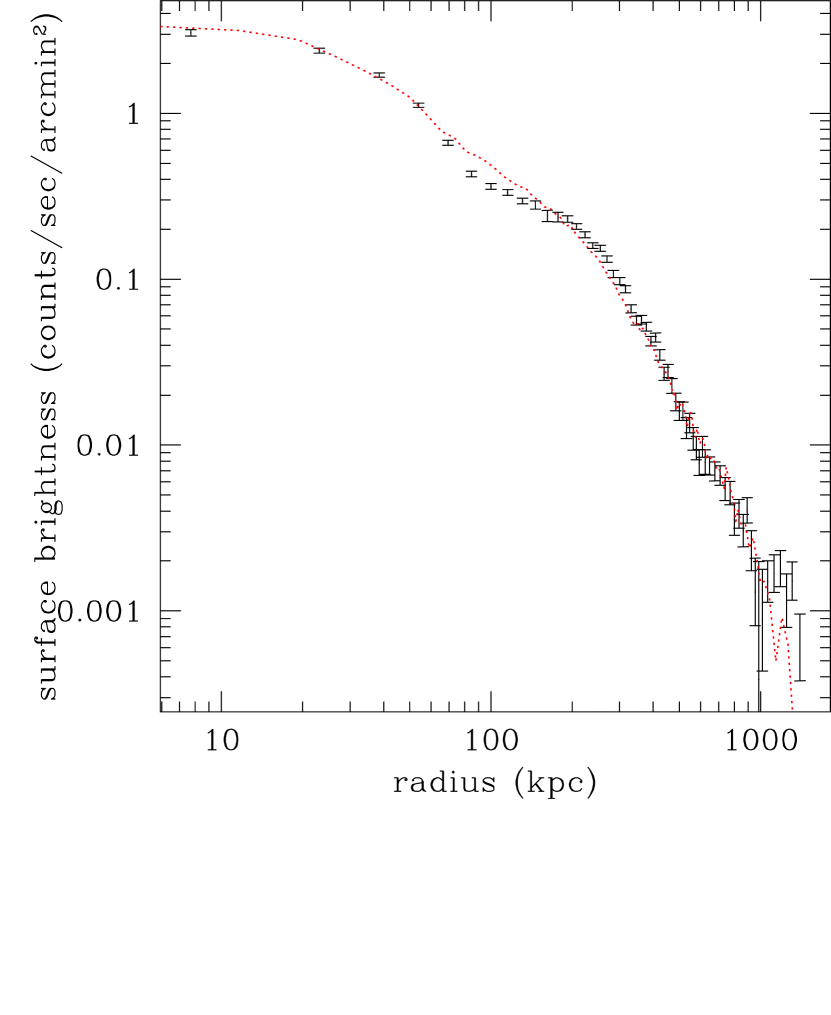
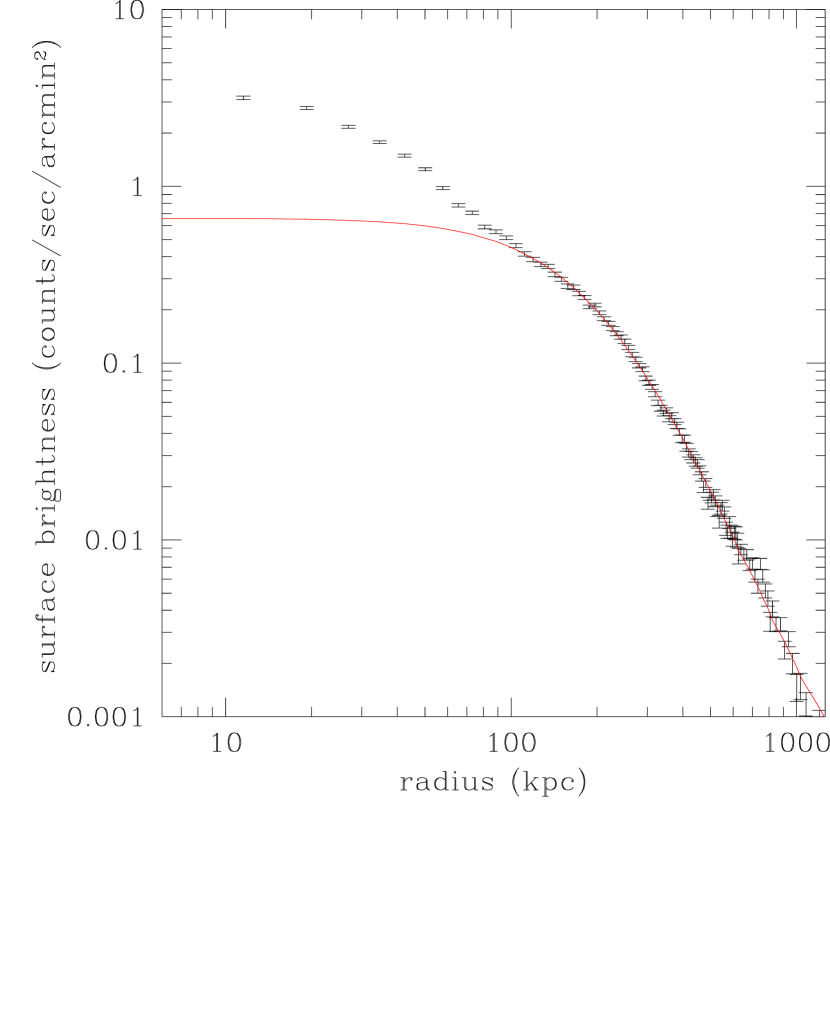
The surface brightness profile of the undisturbed cluster is fitted in the CIAO tool Sherpa with various parametric models, which are convolved with the XMM point spread function (PSF). The overall PSF is obtained by adding the PSF of each camera (Ghizzardi 2001), estimated at an energy of 1.5 keV and weighted by the respective cluster count rate in the [0.4-2] keV energy band. A single -model (Cavaliere & Fusco Femiano 1976) is not a good description of the entire profile: a fit to the outer regions shows a strong excess in the center as compared to the model (see Fig. 3). The centrally peaked emission is a strong indication of a cooling flow in this cluster. We find that for 100 kpc r 1150 kpc the data can be described ( for 87 d.o.f.) by a -model with a core radius kpc and a slope parameter (3 confidence level). The single -model functional form is a convenient representation of the gas density profile in the outer regions, which is used as a tracer for the potential. This best fit model is thus used in the following to estimate the cluster gas and total mass profiles (see Sect. 6).
We also consider a double isothermal -model and find that it can account for the entire profile, when the very inner and outer regions are excluded: for 10 kpc r 1150 kpc the best fit parameters are kpc, , kpc, ; for 96 d.o.f. By assuming a common value we find: kpc, kpc, ; for 97 d.o.f.
4 Temperature map
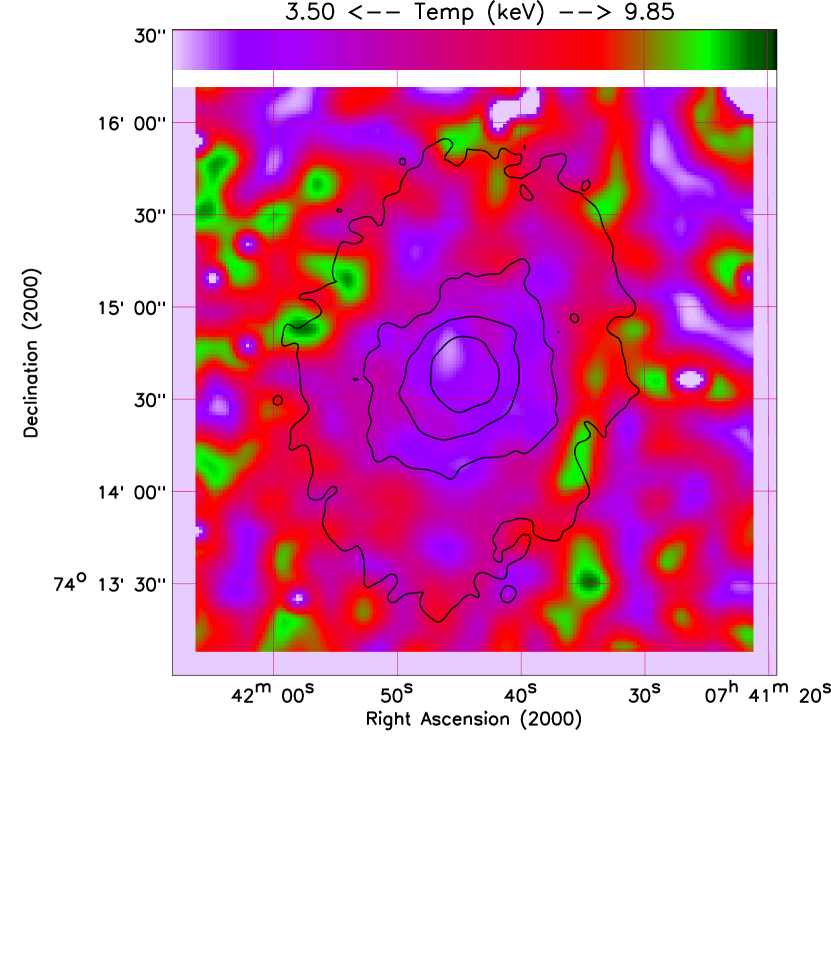
The temperature image of the cluster central region shown in Fig. 4 is built from X-ray colors. Specifically, we extract mosaiced MOS images in four different energy bands ([0.3-1.0] keV, [1.0-2.0] keV, [2.0-4.5] keV and [4.5-8.0] keV), subtract the background and divide the resulting images by the exposure maps. A temperature in each pixel of the map is obtained by fitting values in each pixel of these images with a thermal plasma, fixing to the Galactic value (Dickey & Lockman 1990) and the element abundance to 0.4 solar (see Sect. 5.1). Besides the evidence that the very central region is cooler than the surrounding medium, we do not notice any particular structure in the temperature distribution.
The regularity of the temperature distribution points to a relaxed dynamical state of the cluster, thus excluding the presence of an ongoing merger. Since cluster merging can cause strong deviations from the assumption of an equilibrium configuration, this allows us to derive a good estimate of the cluster mass (see Sect. 6).
5 Spectral analysis
Throughout the analysis, a single spectrum is extracted for each region of
interest and is then regrouped to give at least 25 counts in each bin.
The data are modeled using the XSPEC code, version 11.3.0.
Unless otherwise stated, the relative normalizations
of the MOS and pn spectra are left free when fitted simultaneously.
We use the following response matrices:
m1_534_im_pall_v1.2.rmf (MOS1),
m2_534_im_pall_v1.2.rmf (MOS2),
epn_ff20_sY9_v6.7.rmf (pn).
5.1 Global spectrum
For each instrument, a global spectrum is extracted from all events lying within 6 arcmin from the cluster emission peak, which corresponds to the outermost radius determined from the morphological analysis (Sect. 3.1). We test in detail the consistency between the three cameras by fitting separately these spectra with an absorbed mekal model with the redshift fixed at z=0.216 and the absorbing column fixed at the galactic value (, Dickey & Lockman 1990) and studying the effect of imposing various high and low-energy cutoffs. We find good agreement between the three cameras in the [0.4-10.0] keV energy range ( keV for MOS1, keV for MOS2, keV for pn).
The combined MOS+pn global temperature (in keV) and metallicity (as a fraction of the solar value, Anders & Grevesse 1989) derived from the best fit ( for 1947 d.o.f.) are respectively: keV, . The unabsorbed luminosities in this model (estimated from the average of the fluxes measured by the three cameras after fixing ) in the X-ray ([2.0-10.0] keV) and bolometric band are respectively: , , where the errors are given as half the difference between the maximum and the minimum value.
5.2 Projected radial profiles: temperature and metallicity
We produce projected radial temperature and metallicity profiles by extracting spectra in circular annuli centered on the peak of the X–ray emission. The annular regions are detailed in Table 1. The data from the three cameras are modelled simultaneously using a simple, single-temperature model (mekal plasma emission code in XSPEC) with the absorbing column density fixed at the nominal Galactic value. The free parameters in this model are the temperature , metallicity (measured relative to the solar values, with the various elements assumed to be present in their solar ratios, Anders & Grevesse 1989) and normalization (emission measure). The best-fitting parameter values and 90% confidence levels derived from the fits to the annular spectra are summarized in Table 1.
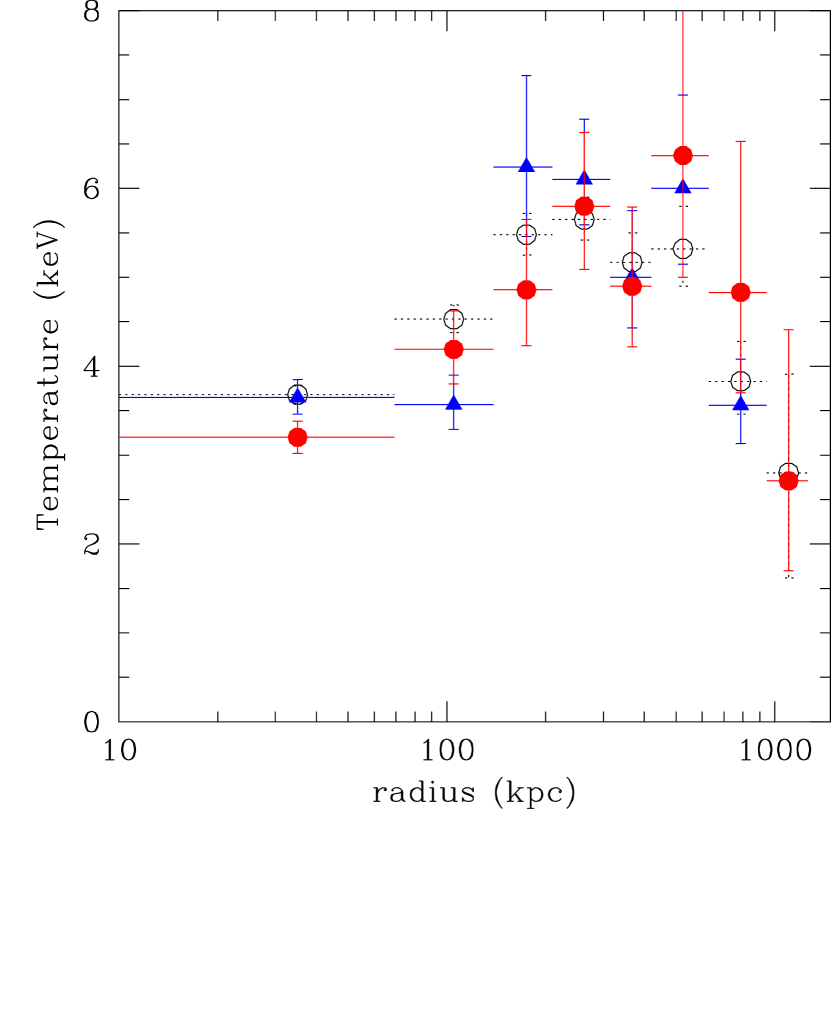
The projected temperature profile determined with this model is shown in Fig. 5. It shows a rise from a mean value of keV within 70 kpc to keV over the 150-630 kpc region, then it declines to a value keV in the outskirts of the cluster (up to 1.3 Mpc).
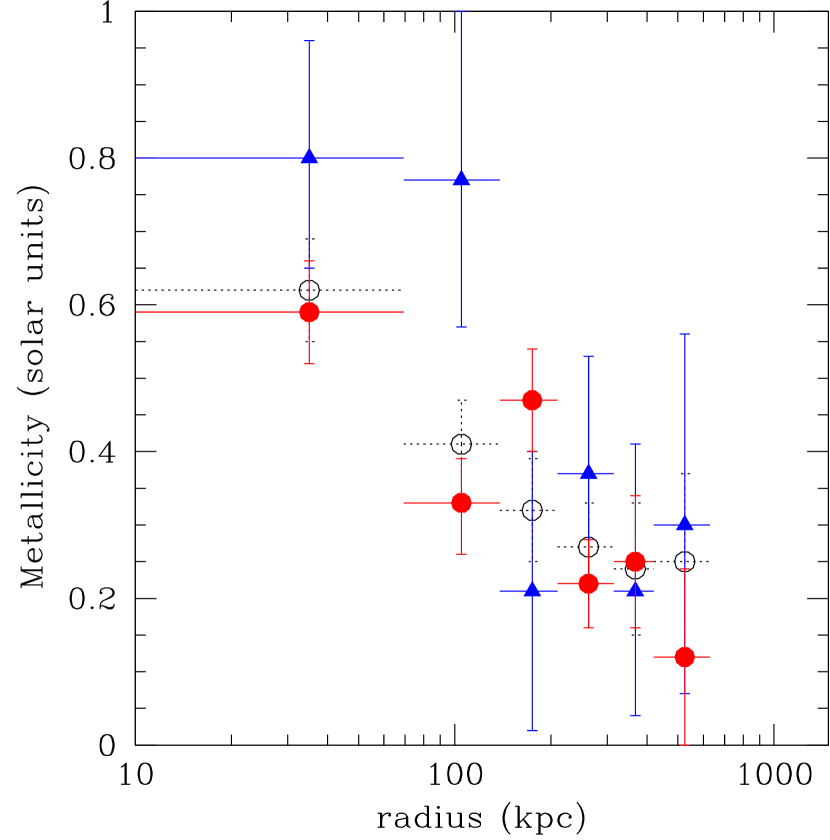
The metallicity profile is shown in Fig. 6: a gradient is visible towards the central region, the metallicity increasing from over the 150-630 kpc region to inside the central 70 kpc. Due to the poor photon statistics that does not allow us to derive accurate measurements, we exclude the last two bins.
We also perform the spectral fitting by leaving the absorbing column density as a free parameter and find little variation in the results.


5.3 Deprojection analysis: temperature, density, pressure and entropy profiles
Because of projection effects, the spectral properties at any point in the cluster are the emission-weighted superposition of radiation originating at all points along the line of sight through the cluster. To correct for the effect of this projection, we perform a deprojection analysis on the same annular spectra used in Sect. 5.2 by adopting the XSPEC projct model. Under the assumption of ellipsoidal (in our specific case, spherical) shells of emission, this model calculates the geometric weighting factor according to which the emission is redistributed amongst the projected annuli.
The deprojection analysis is performed separately for the MOS1+MOS2 and pn spectra. The results are reported in Table 2 and the corresponding deprojected temperature and metallicity profiles are shown in Figs. 7 and 8, respectively. We also perform the deprojection analysis by fitting simultaneously the spectra of the three cameras. In general, the results obtained from pn spectra appear more reliable, as the deprojected MOS and combined MOS+pn temperature profiles show some signs of instability and we do not manage to derive a temperature estimate in the last annulus. In the following general discussion and in the estimate of the cluster mass derived from the density and temperature profiles (see Sect. 6) we therefore adopt the pn deprojection results. As expected, the deprojected central temperature is lower than the projected one, since in the projected fits the spectrum of the central annulus is contaminated by hotter emission along the line of sight.
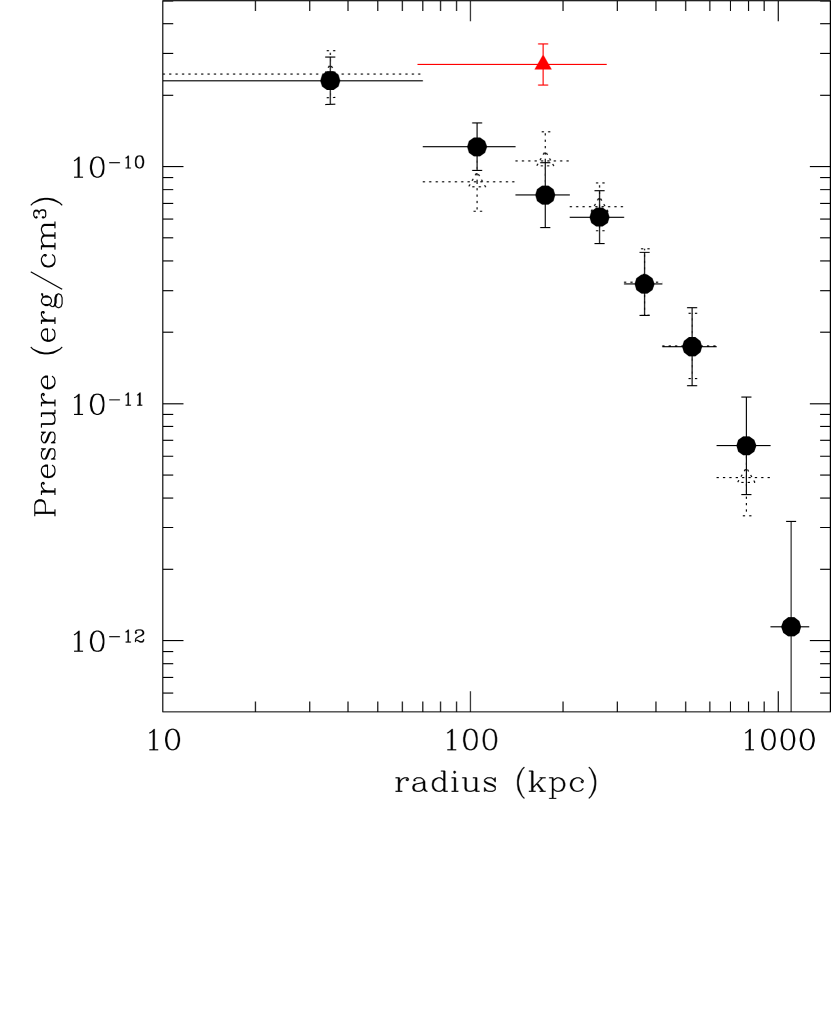
In Figs. 9-11 we show various quantities derived from the deprojected spectral fits. The electron density (Fig. 9) is obtained from the estimate of the Emission Integral given by the mekal normalization: . We assume in the ionized intra-cluster plasma. By starting from the density and temperature information derived from the deprojection analysis, we can calculate the pressure profile (Fig. 10) as , where we assume . The average pressure surrounding the cavities is erg cm-3. Similarly, the entropy profile (Fig. 11) is calculated from the temperature and density profiles by using the commonly adopted definition . Allowing for the different resolutions of Chandra and XMM, the high central entropy level of about 40 keV cm2 that we measure is in agreement with the value of about 30 keV cm2 measured with Chandra (McNamara et al. 2005). As pointed out by Voit et al. (2005), this is consistent with being the result of the accumulation of the very energetic kinetic power outburst at the cluster center.
We investigate the effect of changing the radial binning by performing a similar spectral analysis (projected and deprojected) on different annular regions. We find results consistent with those presented in Sections 5.2 and 5.3. We also note that the results presented here are in agreement with those derived from the analysis of Chandra data (McNamara et al. 2005).


5.4 Cooling Flow
MS0735 was identified as a candidate “cooling flow” cluster because of extended emission from its central galaxy (Donahue, Stocke, & Gioia 1992) and ROSAT HRI detection of a central high surface brightness peak (Donahue & Stocke 1995). However, this identification still has to be confirmed by a detailed X-ray spectral analysis.
The surface brightness profile, temperature map and temperature profile derived from our XMM data analysis give indications of the presence of a cooling core. Here we further investigate the physical properties of the ICM in the central region. The cooling time is calculated as the time taken for the gas to radiate its enthalpy per unit volume using the instantaneous cooling rate at any temperature:
| (1) |
where: is the adiabatic index; (for a fully-ionized plasma) is the molecular weight; is the hydrogen mass fraction; and is the cooling function. We calculate the electron density by following the procedure described in Sect. 6.2, using the -parameters derived by fitting the surface brightness profile over the 50 - 1000 kpc region555 The best fit obtained in Sect. 3.1 cannot be extrapolated to the central region ( 100 kpc) therefore cannot be used here for the purpose of calculating the central cooling time. (data in this region can be approximated by a model with kpc and a slope parameter ). We note that in the radial range where the model is a good representation of the observed surface brightness profile, the density profile derived from this method agrees with that derived from the deprojection analysis of spectra extracted in concentric annuli (see Fig. 9).
Following Bîrzan et al. (2004), we define the cooling radius as the radius within which the gas has a cooling time less than yr, the look-back time to for our adopted cosmology. With this definition, we find kpc which corresponds to the central 30 arcsec. The accumulated spectrum within this radius is extracted and compared to three different spectral models. Model A is the mekal model already used in Sect. 5.1. Model B includes a single temperature component plus an isobaric multi-phase component (mekal + mkcflow in XSPEC), where the minimum temperature, , and the normalization of the multi-phase component, Norm, are additional free parameters. This model differs from the standard cooling flow model as the minimum temperature is not set to zero. Finally, in model C the constant pressure cooling flow is replaced by a second isothermal emission component (mekal + mekal in XSPEC). As for model B, this model has 2 additional free parameters with respect to model A: the temperature, , and the normalization, Normlow, of the second component.
The results, summarized in Table 3, show that the statistical improvements obtained by introducing an additional emission component (models B or C) compared to the single-temperature model (model A) are significant at more than the 99% level according to the F-test. With our data, however, we cannot distinguish between the two multi-phase models. This means that the extra emission component can be equally well modelled either as a cooling flow or a second isothermal emission component. We note that the fit with the modified cooling flow model sets tight constraints on the existence of a “pedestal” minimum temperature ( 1.5 keV). The nominal mass deposition rate in this empirical model is . We also attempt the fit with a classical cooling flow model (model D), by imposing keV, and find a mass deposition rate .
5.5 Cavity regions
Several states of matter have been proposed to fill the cavities (Pfrommer et al. 2005), including a population of relativistic electrons radiating at low radio frequencies and a dilute, shock-heated thermal gas. The synchrotron emission from radio-filled cavities provides evidence of the existence of relativistic electrons and magnetic fields. The cavities may also be filled with a shock-heated thermal gas that can contribute to their internal pressure. This possibility is strengthened if the assumption of equipartition holds. Indeed, since the equipartition estimates of the nonthermal pressure in the radio bubbles give values which are typically a factor of ten smaller than the thermal pressures of the surrounding X-ray gas (e.g., Blanton et al. 2001, De Young 2006), the fact that the cavities are long-lived indicates that the necessary pressure support might be supplied by an additional thermal component. Observationally, besides the detection of hot X-ray emitting gas claimed by Mazzotta et al. (2002) within the ghost cavity of the MKW3s cluster, there has been no detection of hot gas over the cavities even in the clusters with better data available.
In the case of MS0735, the existence of a relativistic plasma filling the cavities is clearly indicated by the presence of the radio source at the position coincident with the holes in the X-ray emission (McNamara et al. 2005). In order to investigate the possibility of an additional thermal gas component in the cavities, we perform a detailed analysis by modeling the spectra extracted in the cavity regions as the sum of ambient cluster emission and a hot thermal plasma, each with a characteristic temperature. The northern and southern cavity regions, detailed in Fig. 12, contain and source counts with a count rate of 0.23 and 0.20 counts/s (MOS+pn), respectively. The results of the spectral analysis are reported in Table 4.
In the northern cavity, which shows a higher brightness contrast than the southern one in the XMM image, we find indications of the presence of a keV plasma. By assuming that the emission of this hottest component comes entirely from the cavity region whereas that of the coolest component is due to the projected foreground and background cluster emission666 This assumption is justified by the fact that a component as hot as 13 keV is detected nowhere else in the cluster and therefore is plausibly located only in the cavity region., we can estimate the density of the thermal plasma in the cavity to be cm-3. This leads to an estimate of its pressure of erg cm-3, which is a factor 3-4 higher than the pressure of the surrounding medium (see Fig. 10). However, we note that the improvement in the fit due to the extra thermal component is only marginally significant777/dof = 385/311 compared to /dof = 394/313, with F-test probability=0.028.. We therefore cannot place strong constraints on the existence of a hot thermal component filling the cavities and the estimate presented above has to be considered with caution.
5.6 Shock front
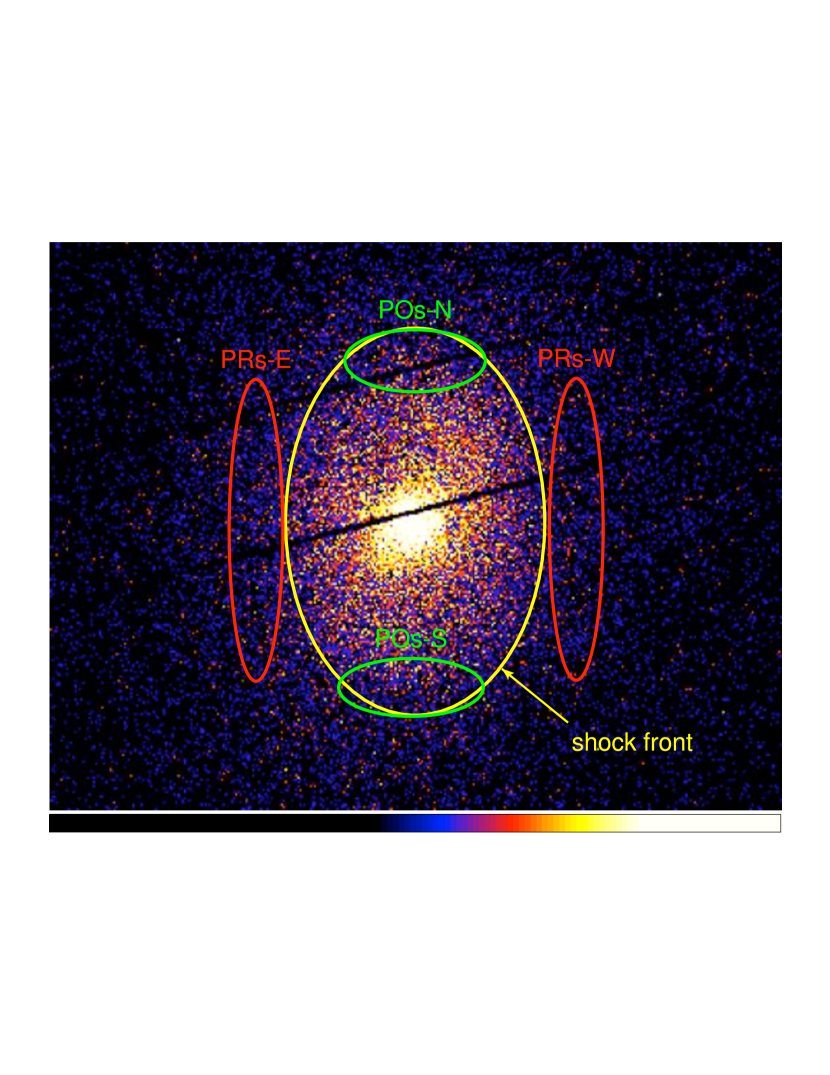
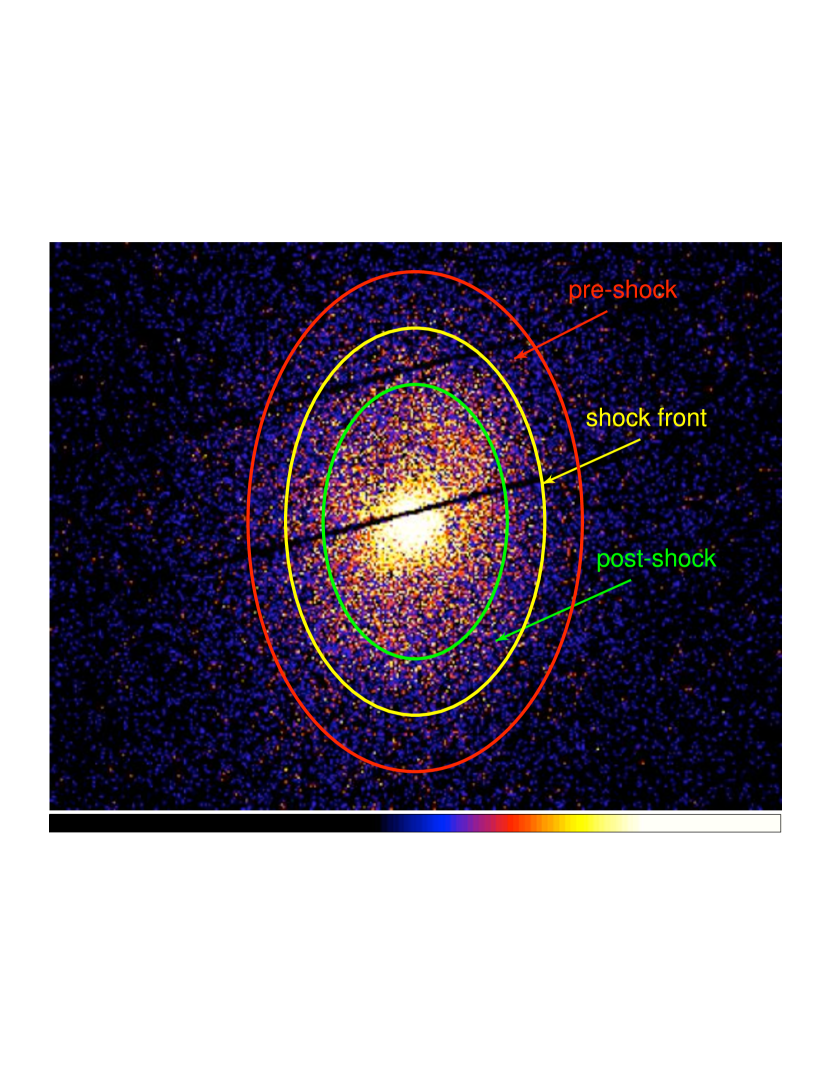
Chandra observation of MS0735 reveals a discontinuity in the X-ray surface brightness that has been interpreted as a weak cocoon shock driven by the expansion of the radio lobes that inflate the cavities. The shock front has an elliptical shape, being located kpc and kpc from the cluster center in east-west and north-south directions, respectively (McNamara et al. 2005). We find indications of a surface brightness feature at a position consistent with that seen in the Chandra data, however we cannot clearly distinguish a break in surface brightness that would be a signature of the shock front. By considering the elliptical shock front position derived from Chandra data, we perform a spectral analysis on the regions detailed in Figs. 13 and 14 in order to derive the temperature of the pre-shock and post-shock gas. The results are reported in Table 5.
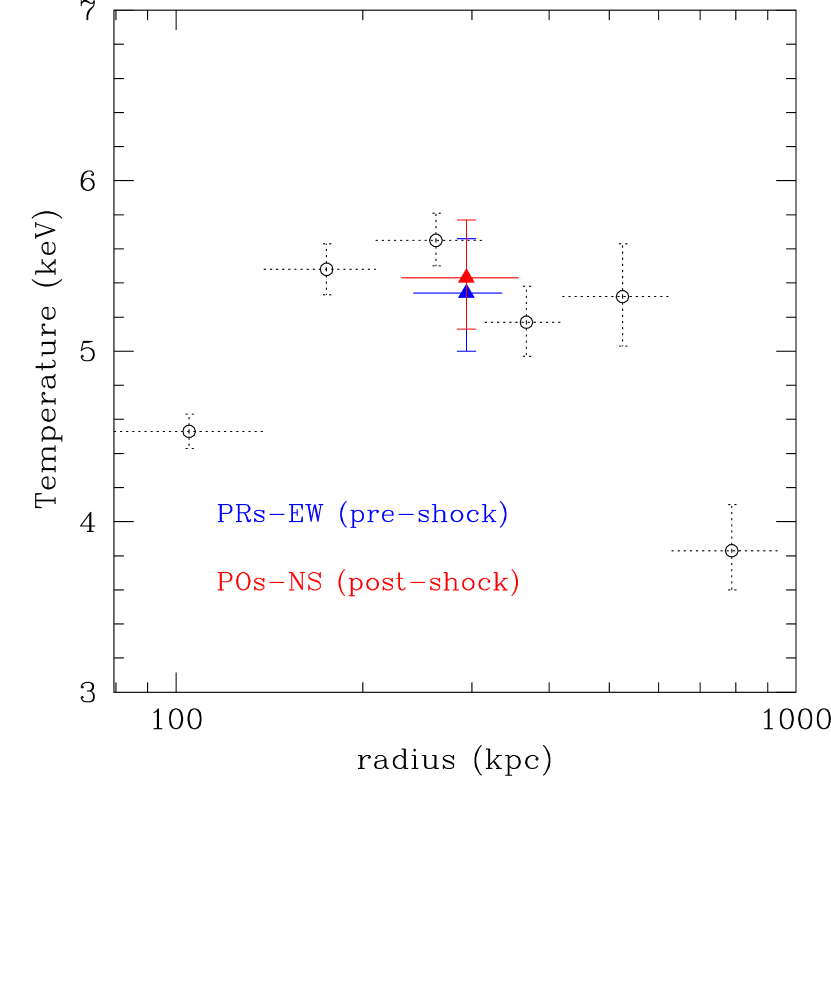
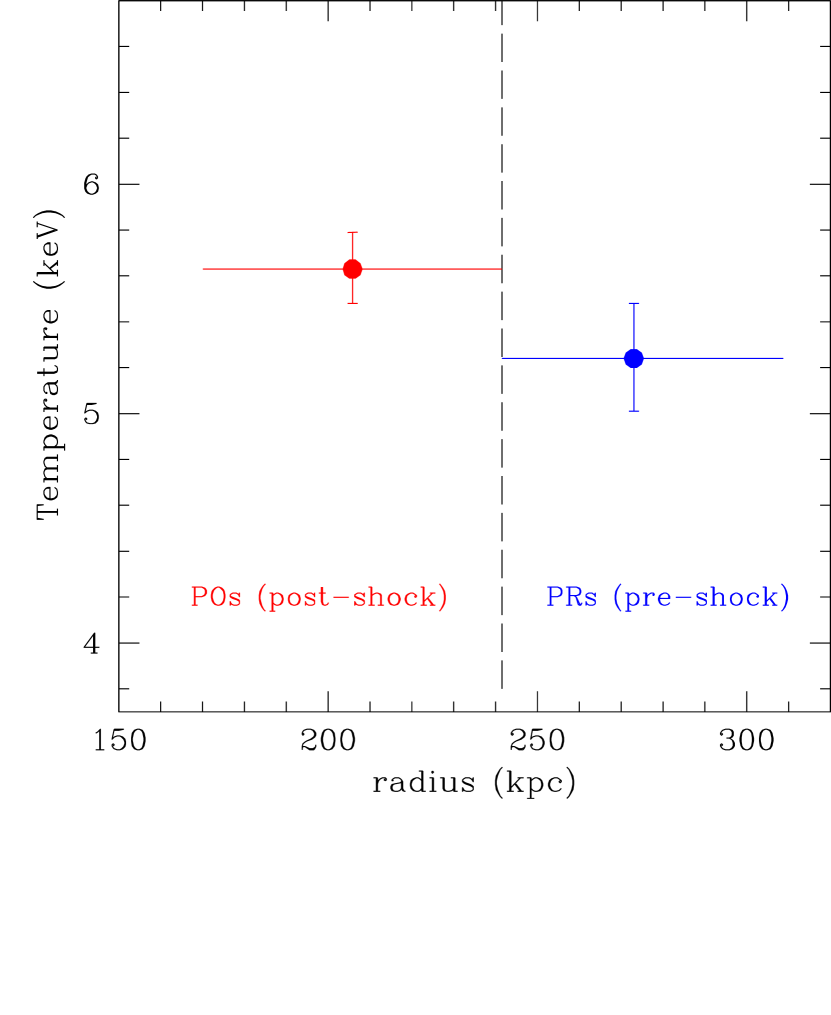
The particular choice of the elliptical regions next to specific sectors of the shock front (see Fig. 13) allows us to compare directly the spectral properties of the pre-shock and post-shock regions in different directions with respect to the azimuthally-averaged profiles. We do not find any appreciable variation in temperature (see Fig. 15). In the analysis of the Chandra data, the shock properties are determined using a spherical hydrodynamic model of a point explosion at the center of an initially isothermal, hydrostatic atmosphere. When adapted to the XMM data by taking into account the smearing effect due to the large PSF, such a model predicts a temperature rise of 10% (see Fig. 16). Our spectral results obtained from elliptical annular regions next to the whole shock front (see Fig. 14) do suggest a temperature jump at the shock front, in agreement with those derived from previous Chandra observations, although due to the large error bars the pre-shock and post-shock regions are still consistent with being isothermal (see Fig. 17). From this analysis we therefore conclude that the XMM data can neither confirm or deny the existence of the shock front.

6 Mass profile
6.1 Total gravitational mass
In the following we estimate the total mass of the cluster using the usual assumptions of hydrostatic equilibrium and spherical symmetry. Under these assumptions, the gravitational mass of a galaxy cluster can be written as:
| (2) |
where and are the gravitational constant and proton mass and . The mass contribution from galaxies is small, thus we neglect it. Therefore , i.e. the total gravitational mass within a sphere of radius is given by gas plus dark matter mass.
The mass profile derived from the equilibrium equation is strongly dependent upon the measured temperature profile. Large errors and irregular radial distribution of the temperature values induce large scatter on the reconstructed gravitational mass measurements. In order to obtain reliable mass estimates it is therefore crucial to select bins with a robust temperature estimate. For this reason we exclude the last temperature bin, although its inclusion would allow us to trace the temperature profile and therefore mass profile at much larger radii.
The deprojected is calculated from the parameters of the -model derived in Sect. 3.1. In particular, the advantage of using a -model to parameterize the observed surface brightness is that gas density and total mass profiles can be recovered analytically and expressed by simple formulae:
| (3) |
| (4) |
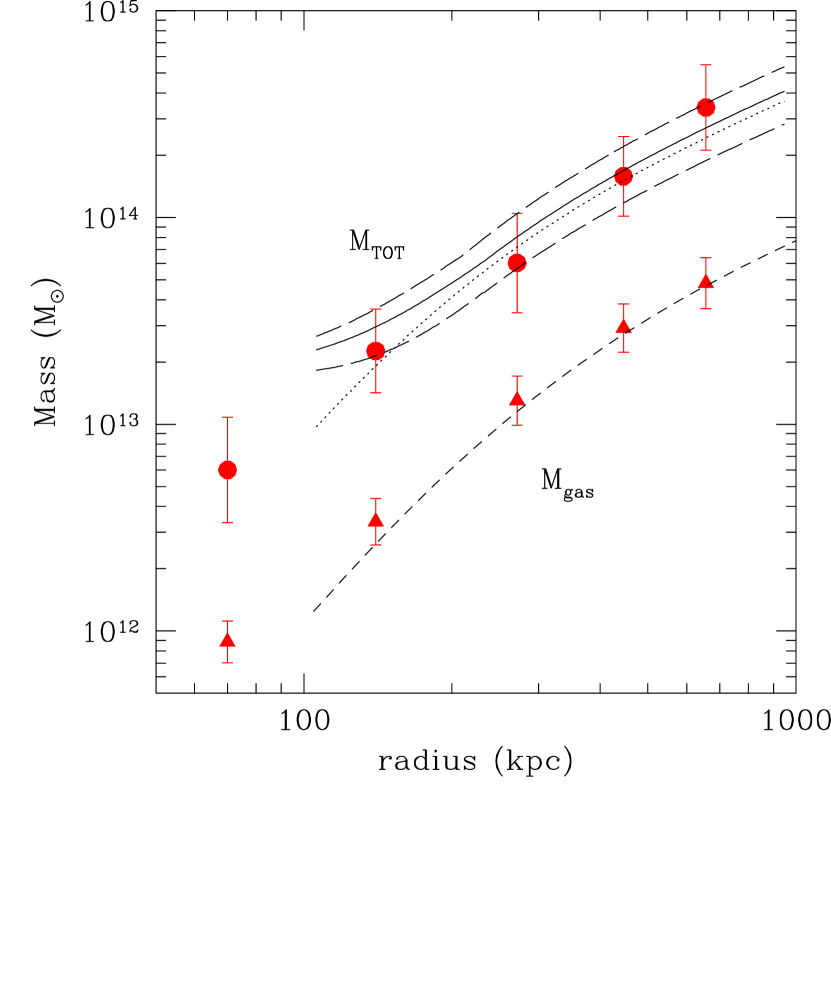
As a first-order approximation, the temperature gradient is estimated by dividing the deprojected temperature profile (see Fig. 7) into two radial intervals and least-squares fitting a straight line in each interval. The total gravitating mass distribution derived from Eq. 4 is shown in Fig. 18 as a solid line, with errors coming from uncertainties in the temperature measurement and -model parameters represented as long dashed lines. In Fig. 18 we also show (dotted line) the total mass calculated by assuming a constant temperature of keV, where the average emission-weighted cluster temperature is derived by extracting the global spectrum of the cluster after excluding the cooling flow region (i.e. in the annular region 30 arcsec - 6 arcmin). We note that the total integrated mass within a particular volume is dependent upon the local physical properties (local temperature and density gradients) and is is not strongly affected by the regions interior, or exterior, to that radius. The mass profile derived with this method is thus reliable in the region where the -model is a good representation of the observed surface brightness profile (100 kpc r 1150 kpc, see Sect. 3.1), whereas it cannot be extrapolated to the central region.
As an alternative method, we then calculate the total mass by making direct use of the deprojected gas temperature and electron density values estimated from the spectral best-fit with a single phase model (Sect. 5.3). In particular, the total mass enclosed within the midpoint between two consecutive shells is calculated from the pressure gradient and the gas density at the midpoint by following the method described in Voigt & Fabian (2006). The mass profile reconstructed by using this method, is shown as full red circles in Fig. 18. The uncertainties are calculated using error propagation from the pressure and density estimates (90% confidence level). We note that the cavities may affect the mass determination. In particular, since the cluster does not exhibit a smooth pressure profile between 100-400 kpc (see Fig. 10), which would result in a non-monotonically increasing mass profile in this region, we exclude the fourth data point in the pressure and gas density profiles.
The mass measurements reconstructed through the two different methods (direct application of the hydrostatic equilibrium equation with density profile derived from either -model fit to the surface brightness profile or deprojection analysis on annular spectra) are in very good agreement (see also Fig. 20).
6.2 Gas mass and gas mass fraction
We estimate the gas mass through two different methods, i.e. by using the density profile derived from either the -model fit to the surface brightness profile or the deprojection analysis on annular spectra. To convert from electron number density to gas density we use the relation .
In the first case, the gas mass profile is derived by integrating the gas density given by Eq. 3 in spherical shells and using the -model parameters determined in Sect. 3.1. The normalization of Eq. 3 is obtained from the combination of the best-fit results from the spectral and imaging analyses, which allows us to determine the conversion count rate - flux used to derive the bremsstrahlung emissivity that is then integrated along the line-of-sight and compared with the central surface brightness value. The adoption of the parameters of the -model fit in the outer regions produces an underestimate of the derived central electron density (see Fig. 9) and this turns into an underestimate of the gas mass in the central shells. Since the integrated gas mass is calculated by summing from the center outwards, any error in the measurement at small radii will propagate out to larger radii. However, the gas mass at small radii is much less than at large radii and any uncertainty in the measurements in the core are unlikely to have a significant effect on the gas mass profile further out. The gas mass profile derived from the -model is shown as a dashed line in Fig. 18. The gas mass profile obtained by integrating in spherical shells the gas density derived directly from the deprojected electron number density is shown in Fig. 18 as red triangles. Again, we note that the two profiles are in very good agreement.
The gas mass fraction is the ratio of the total gas mass to the total gravitating mass within a fixed volume:
| (5) |
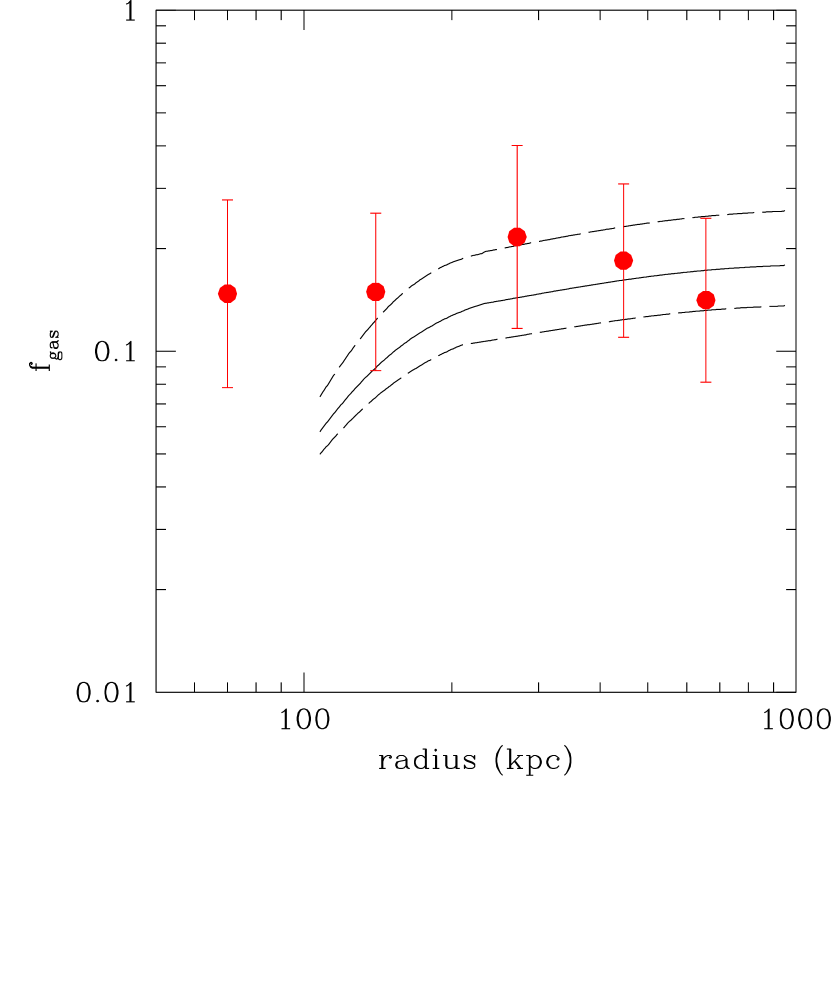
The gas mass fraction profile derived from and measured from the -model and deprojection methods are plotted in Fig. 19 as black lines and red points, respectively. Adding the mass contribution from galaxies (1-2%, Lin et al. 2003) to the total mass would have a small effect on the estimate of , with variations lying within the error bars.
7 Discussion
Simple assumptions for the formation and evolution of galaxy clusters predict self-similar scaling relations. Galaxy clusters are assumed to form by spherical collapse of dark matter and gas due to gravitational instability. The gas is heated by shocks and adiabatic compression. For dissipationless collapse, the X-ray emitting gas can be considered to share the same properties as the dark matter (e.g. Bryan & Norman 1998; Arnaud & Evrard 1999). Self-similar dark matter haloes are assumed to have identical properties when scaled by the virial radius, which is the radius separating the region where the cluster is in hydrostatic equilibrium from where matter is still infalling. However, deviations from self-similarity are expected in the ICM due to the details of individual collapse histories and to any physical processes beyond simple gravity and gas dynamics (e.g. Evrard & Henry 1991; Bryan & Norman 1998; Borgani et al. 2002 and references therein). In particular, the ICM of cooling flow clusters is affected significantly by heating that boosts the thermal energy of the gas.
Here we investigate the correlations between the physical quantities observed for MS0735 in order to scale it in the overall populations of clusters and assess its conformity to the generally observed mass-temperature (-) and luminosity-temperature (-) relations. Our final aim is to evaluate the impact of energetic AGN outbursts on such scaling relations, which are the foundation to construct the cluster mass function and to use these virialized objects as cosmological probes.
7.1 Modeling the observed mass profile: determination of
In order to rank MS0735 in the overall population of clusters we investigate the relations among different physical quantities considering their values at a given overdensity . This is defined with respect to the critical density , and within a cluster described as a sphere with radius :
| (6) |
where the Hubble constant at redshift z is equal to (e.g., Bryan & Norman 1998):
| (7) |
In order to estimate for various overdensities we need to fit the mass profile with an analytical function, that allows us to extrapolate the mass profile beyond the outer radius accessible to our X-ray observations. As a cosmologically motivated dark matter mass model, we consider the integrated NFW (Navarro et al. 1996) dark matter profile:
| (8) |
The scale radius and the concentration parameter are the free parameters.
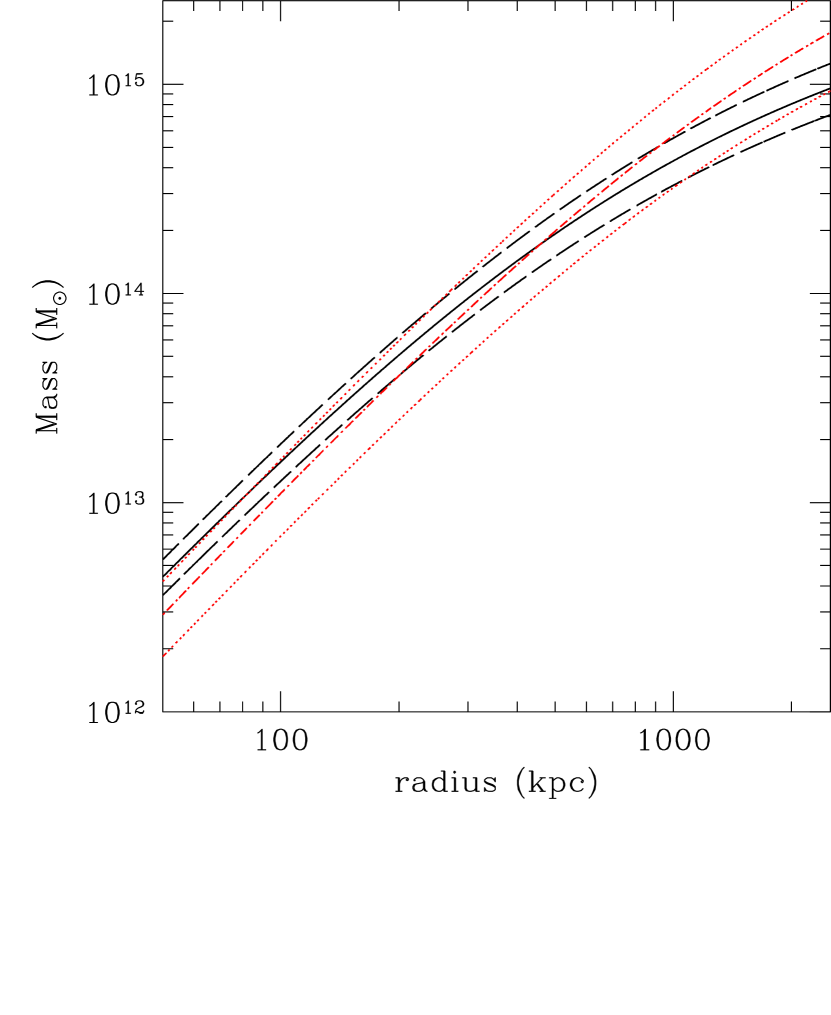
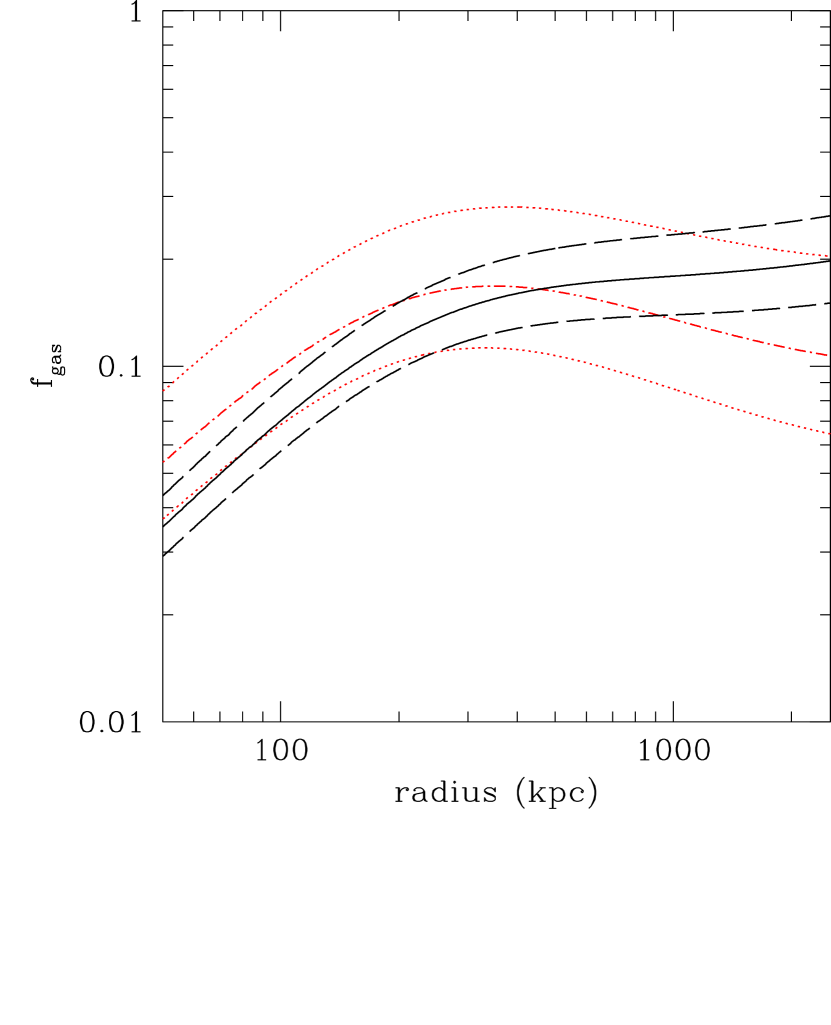
We perform the fit to minimize the of the comparison between the mass predicted by Eq. 8 and the mass profile reconstructed from both the density profiles estimated from the -model and deprojection methods. The best fit parameters for the mass profile reconstructed from density values estimated from the -model are: kpc, (dof = 0.08/4). The best fit parameters for the mass profile reconstructed from deprojected density values are: kpc, (dof = 0.18/3). The quoted error are at the 68% confidence levels (1). The comparison of the two best fits of the NFW mass profile is shown in Fig. 20. The corresponding gas mass fraction estimated from the NFW mass profile fit is shown in Fig. 21 for both the -model and deprojection methods. Note that we neglect the gas mass contribution to the total mass and we assume . We also perform the same fitting procedure by including the gas mass, i.e. by assuming , and find very similar results.
From the best fit parameters we compute from Eq. 6 for various overdensities: . For , the virial radius corresponds to if (Lacey & Cole 1993; Eke et al. 1996, 1998). For adopted here, . The virial radius derived in an Einstein-de Sitter Universe () is still often used in the literature, corresponding to a density contrast of (or ), so that . The relation holds for the NFW mass profile. The results obtained from the NFW fit to the mass estimated through the -model and deprojection methods are shown in the Tables 6 and 7, respectively. We also report the total mass and the gass mas fraction. The error related to the mass estimate is obtained from half the difference between the maximum and the minimum value calculated at each radius for the set of parameters acceptable at . The gas mass fraction is calculated at given overdensities by adopting the gas mass computed from the integration of the -model fit to the density profile extrapolated out to . The reported error is obtained from the error propagation and is dominated by the error on the total mass.
We note that the value obtained for is highly dependent on the accuracy of , since it involves extrapolating the NFW model using . The measure of is very uncertain as the best-fit scale radius lies beyond the radius at which mass measurement can be made and is therefore strongly dependent on the outermost datapoint of the mass profile. The value for is shown for interest, but is not used for any subsequent analysis. We instead adopt , which is the most reliable estimate since it lies well within the radius at which mass measurements are obtained. We indeed find an excellent agreement between the values of , and obtained from the NFW fit to the mass estimated through the -model and deprojection methods. In particular, in the following discussion we adopt the values obtained with the -model method as their determination is more precise (cf. Tables 6 and 7).
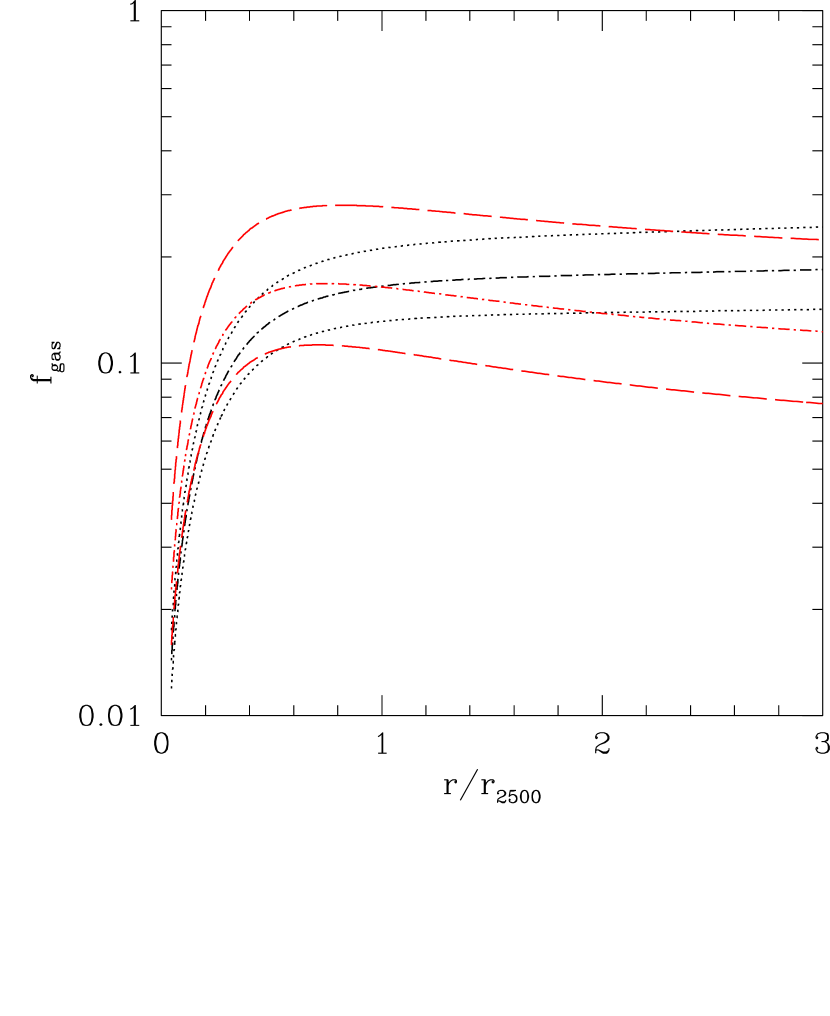
The gas mass fraction profile scaled in radial units of is shown in Fig. 22. The apparent flattening of outside is in agreement with previously observed profiles (Allen et al. 2002, Voigt & Fabian 2006), although it is systematically slightly above them. In particular, we find , which is higher than the average value derived in a number of previous measurements with Chandra (e.g., Allen et al. 2002, Vikhlinin et al. 2006). The high central gas fraction is close to the global baryon fraction in the Universe, constrained by CMB observations to be (Readhead et al. 2004, Spergel et al. 2003). However, our estimate of the central could be affected by several effects. In particular, the high measured central gas mass fraction could result from an underestimation of the total mass, supporting the presence of non-thermal pressure in the core. It could also result from an overestimate of the gas density due to the boost in emissivity produced by the cavities (see Sect. 7.6).
7.2 Scaled temperature profile
In order to make a fair comparison between the physical properties and investigate the scaling relations it is important to correct for the effects of the central cooling flow when measuring the characteristic temperature of the cluster. The average emission-weighted cluster temperature is calculated by fitting with a mekal model the spectrum extracted up to the outer radius detected by our X-ray observation (6 arcmin), after excising the cooling region (30 arcsec). We find a value keV.
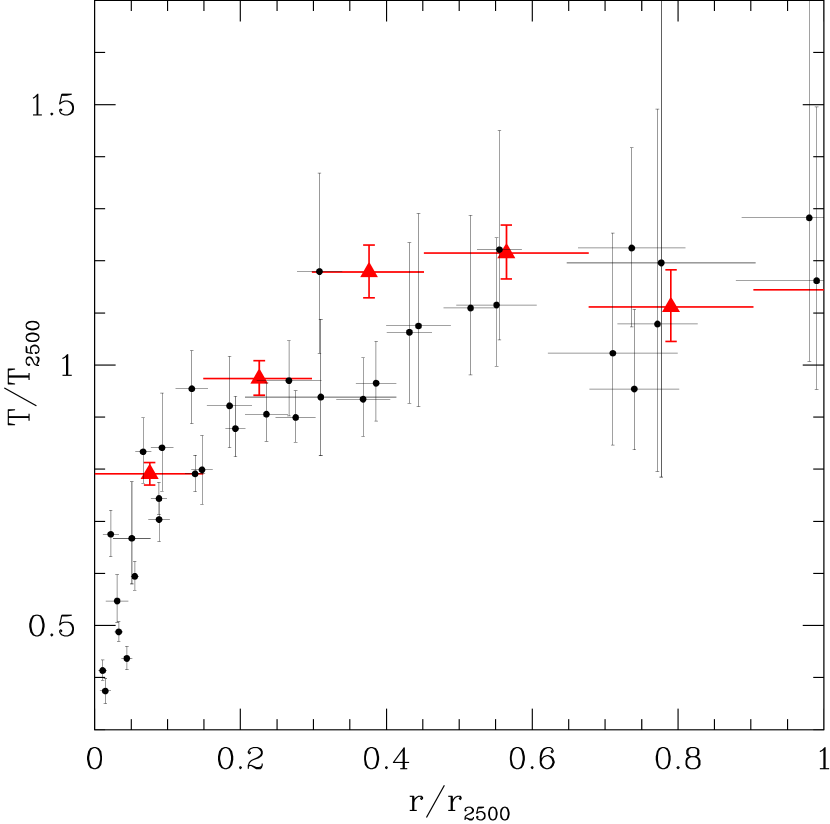
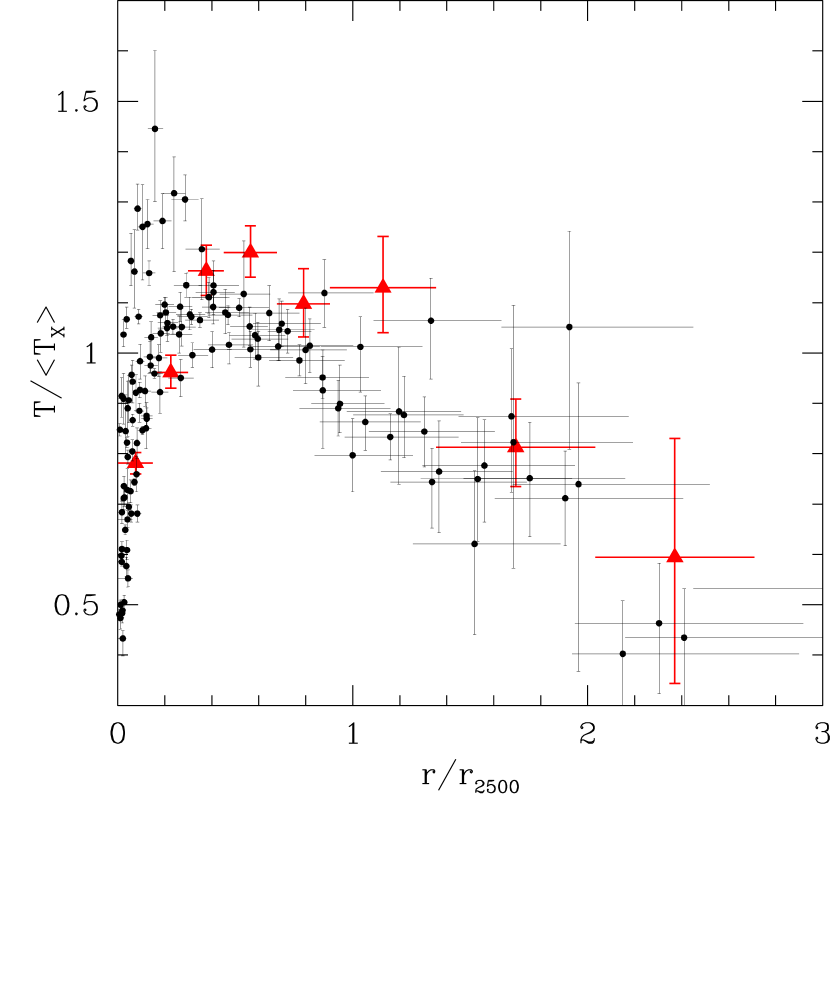
We show in Fig. 23 the projected temperature profile of MS0735 (red triangles) measured in the region internal to . The profile is scaled at an overdensity of 2500 and overlaid to the scaled temperature profiles of a sample of 6 relaxed clusters observed with Chandra (Allen et al. 2001). In Fig. 24 we present the same kind of comparison with a sample of 12 relaxed clusters for which the temperature profile has been measured farther out, up to more than 2 , revealing a clear general temperature decline in the outer regions (Vikhlinin et al. 2005). In this case the temperatures are scaled to the emission-weighted cluster temperature, excluding the central 70 kpc region usually affected by radiative cooling. To be fully consistent with the scaled profiles presented by Vikhlinin et al. (2005), we thus estimate the emission-weighted temperature used for the scaling by extracting the global spectrum of MS0735 in the annular region 20 arcsec - 6 arcmin. We find a value ( keV) slightly lower than the “true” average emission-weighted temperature, as expected since the effect of cooling flow is not completely corrected (the cooling radius in MS0735 is kpc). The overall temperature profile measured for MS0735 is consistent within the scatter of the profiles observed in relaxed cluster, although for its values tend to lie at the top of the distribution.
These results indicate that the energetic outburst in MS0735 does not cause dramatic instantaneous departures from the average properties of the ICM, as it has not had a large impact on the large-scale temperature profile. Of the roughly 30 clusters from the Chandra archive showing evidence of AGN outbursts (Rafferty et al. 2006), three have outburts of comparable energy, MS0735 (McNamara et al. 2005), Hercules A (Nulsen et al. 2005a) and Hydra A (Nulsen et al. 2005b; Wise et al. 2006). These three large outbursts all have ages of yrs. Dunn et al. (2005) find that of cooling flow clusters currently show signs of outbursts, implying that outbursts are active most of the time. If the large outbursts were confined to only these few clusters, their incidence and ages imply that the clusters have undergone tens of outbursts since they were formed. In that case, the total energy added to the ICM outside the cooling region should have had a marked effect, contradicting our findings for MS0735. Thus, the relatively high incidence of large outbursts is more likely to be due to them occurring of the time in a significant proportion of all cooling flow clusters, rather than occurring most of the time in of clusters.
7.3 Scaled metallicity profile
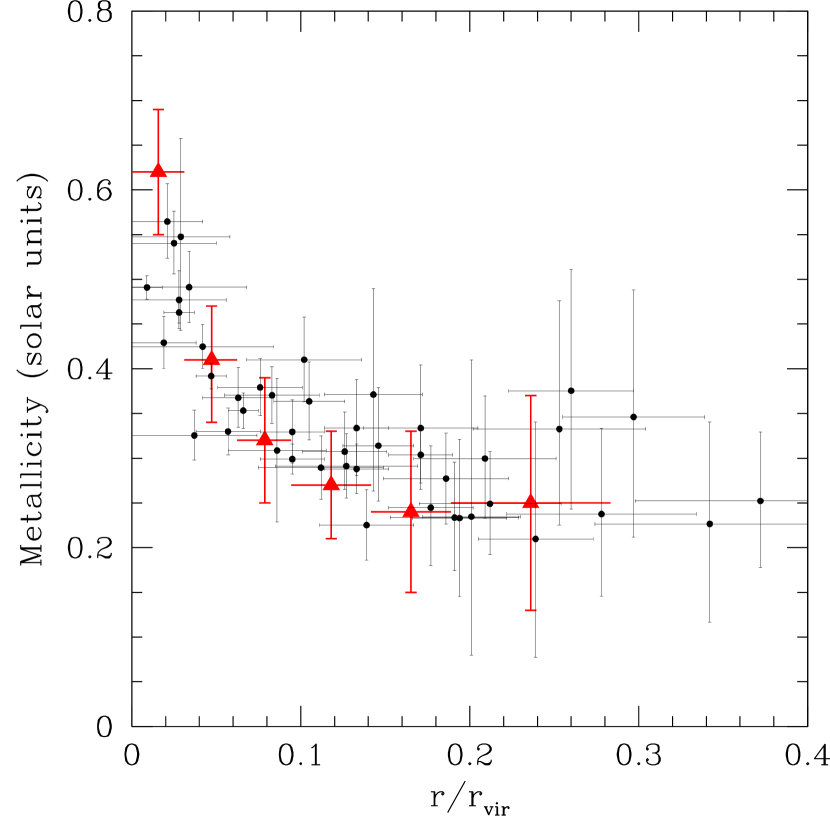
We studied the metallicity profile in order to investigate the possible effect of uplifting and outflows on the metal distribution. Fig. 25 shows the projected metallicity profile of 9 cooling flow clusters observed with BeppoSAX, rescaled to the virial radius (De Grandi & Molendi 2001). A strong enhancement in the abundance is found in the central regions. Overlaid is the metallicity profile that we measure for MS0735 (red triangles). We note that it is fully consistent with the strong central enhancement in the abundance exhibited by cooling flow clusters, indicating that the outburst has not smoothed the metal gradient.
How to interpret this result in the context of current models is unclear. Simulations of metal evolution due to mixing and uplifting by buoyant bubbles indicate that low-power, subsonic flows have a relatively weak impact on the metallicity gradients found in clusters (Brüggen 2002, Omma et al. 2004), whereas powerful outbursts with short active time can flatten the central metallicity gradients if the metals are not replenished quickly (Heath et al. 2006). The average jet power of the outburst in MS0735, as estimated from the shock model, is erg s-1 (McNamara et al. 2005) and the observed steep central metallicity profile is consistent with the findings of Heath et al. (2006) for jet simulations of comparable power. However, the cavities in MS0735 would increase the jet power significantly, in which case the dredge up by the rising bubbles is expected to have a significant effect in flattening the metallicity gradient. If such outbursts are rare and we assume no continuous central metal injection, the fact that we observe a normal gradient could thus be interpreted as a lack of strong evidence for significant metal uplifting or mixing by the cavities in MS0735. If instead as discussed above all clusters go through a similar phase, the observed agreement would not be surprising as the large outbursts would contribute to create the global cluster properties. Note however that the existing models do not allow us to exclude the possibility of some dredging occurring in MS0735. Indeed, the predictions of numerical simulations depend strongly on the details of the jet (like opening angle, initial Mach number, duration), which can significantly affect the extent of mixing. A direct comparison with the metallicity profile observed in MS0735 would therefore require a tailoring of such simulations to the particular conditions of the outburst in this cluster. Furthermore, observations of broader metallicity profiles compared to the cD light profiles in cD clusters (De Grandi & Molendi 2001, David et al. 2001, Rebusco et al. 2005) indicate that some outward diffusion of enriched gas due to AGN or mergers is occurring. Powerful outburst as the one in MS0735 are more likely to produce such an effect. What we conclude from our analysis is therefore that the single outburst in MS0735 has not appreciably affected the metal profile compared to other objects, but we cannot exclude the possibility of some mixing.
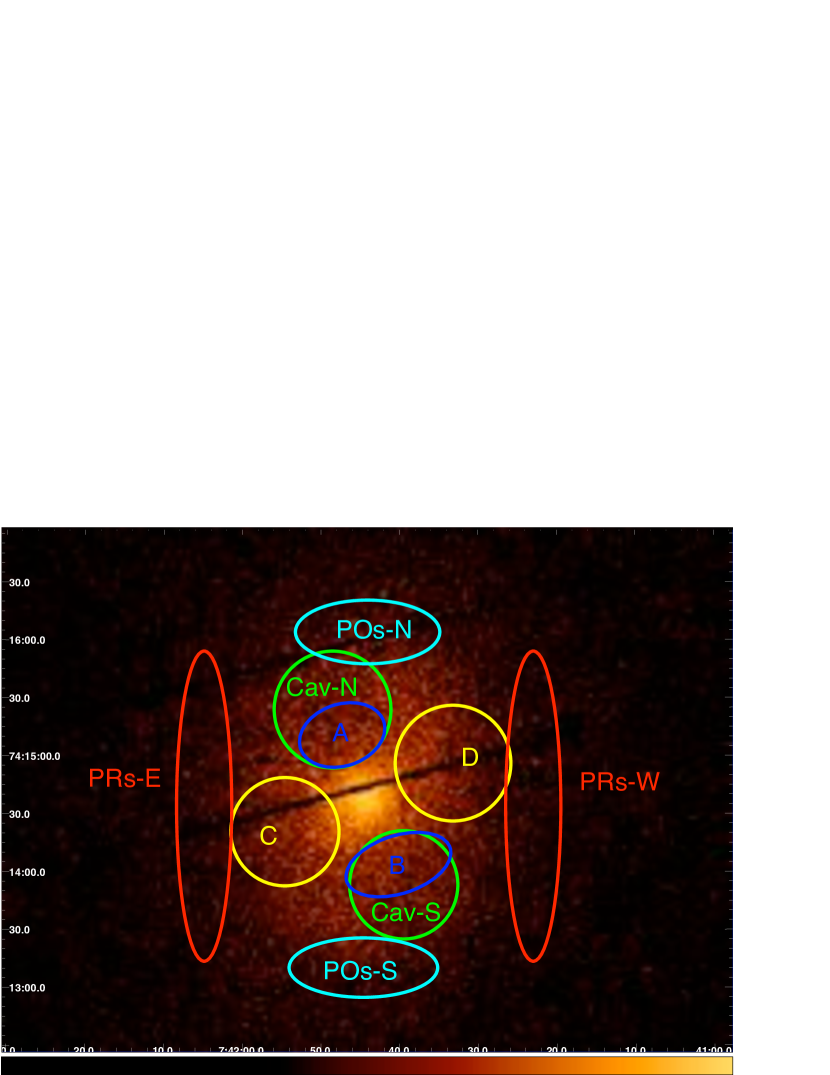
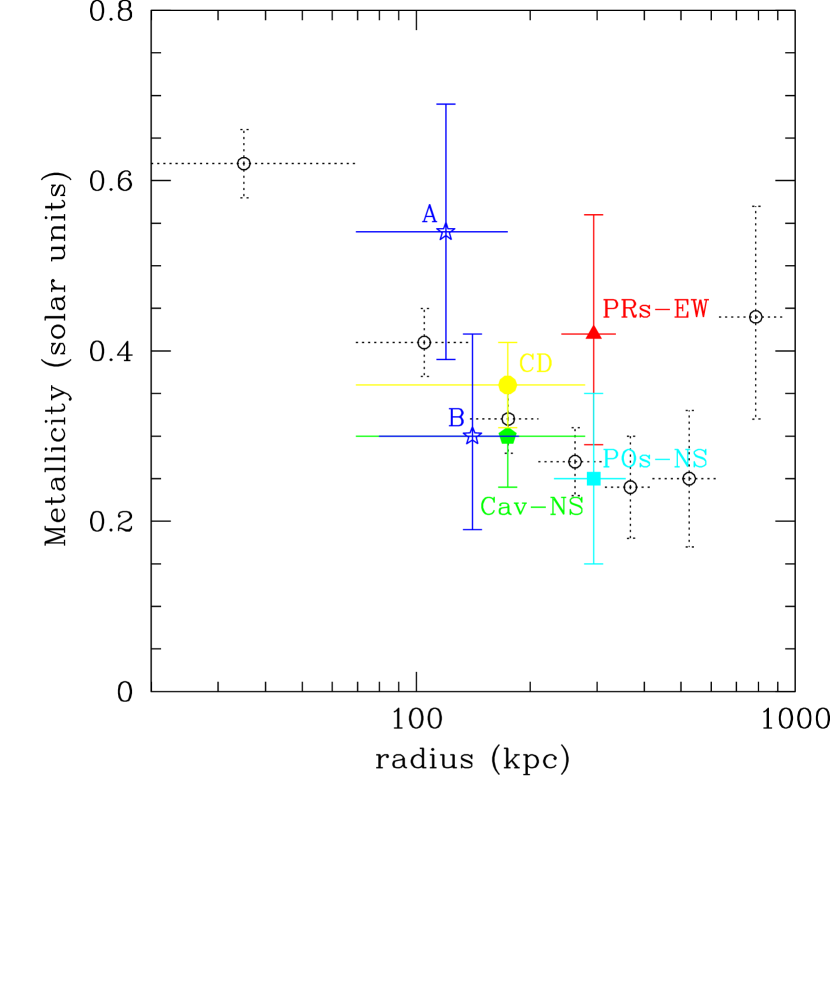
On the other hand, we note that when dealing with azimuthally-averaged profiles we cannot study the local distribution of metals. In order to further investigate the metallicity distribution we extract the spectra in the regions indicated in Fig. 26 and measure the abundance by fitting them with a mekal model. The results are reported in Table 8 and shown in Fig. 27, where we also plot for comparison the azimuthally-averaged profile. Simulations involving uplift by the cavities show that material is entrained at the upper (or lower) surface of the rising bubble and in its wake (e.g., Churazov et al. 2001), and the resulting metal distribution is very elongated along the direction of the bubbles (Roediger et al. 2006). We note that the possibility of making an accurate comparison between the pattern of abundance that we observe and the prediction of these models is complicated by the poor photon statistics, which do not allow us to place definite constraints on the metal distribution. Detailed abundance maps of the central cluster regions are required for this purpose.
7.4 - relation
A tight size-temperature relationship Is expected, as both of these quantities reflect the depth of the gravitational potential well in a virialized halo. Self-similarity predicts that (Mohr & Evrard 1997). Studies of ensembles of simulated clusters have confirmed this proportionality, providing a value for the normalization in the relation (e.g., Evrard et al. 1996). Recent XMM-Newton observations of a sample of six relaxed galaxy clusters hotter than 3.5 keV find for an overdensity that (Arnaud et al. 2005):
| (9) |
where the factor corrects for the evolution expected in the standard self-similar model (see Eq. 7). In the case of MS0735 the scaling factor is small, being at . This relation allows us to estimate a value of kpc, which is consistent with the value of kpc determined from the overdensity profile (see Sect. 7.1). We therefore find no evidence that the outburst is visibly affecting the size-temperature relationship.
We note that different studies on samples of galaxy clusters find that the - relation, as deduced from simulated clusters (Evrard et al. 1996), deviates systematically from the measured values of , as inferred from the overdensity profile (Sanderson et al. 2003; Piffaretti et al. 2005). The largest discrepancy is found for and in the smallest haloes. Our result, derived for in a massive cluster, does not contradict these findings. The estimate of is more reliable than that of as it does not require much extrapolation of the universal NFW profile (see Sect. 7.1). Furthermore, the impact of additional additional, non-gravitational heating is minimal in massive clusters. Its effect is most pronounced in poor, cool clusters, where the extra energy required to account for their observed properties is comparable to their thermal energy (e.g., Ponman et al. 1996; Tozzi & Norman 2001).
7.5 - relation
Theoretical predictions based on the simplistic assumption of an isothermal sphere for both the gas represented by its temperature and the collisionless dark matter particles (e.g. Kaiser 1986; Bryan & Norman 1998) infer a self-similar scaling relation between and at a given overdensity in the form . Various observational studies have found different and sometime conflicting results regarding the slope and normalization of the - relation (e.g., Allen et al. 2001; Finoguenov et al. 2001; Ettori et al. 2002; Sanderson et al. 2003, Arnaud et al. 2005 and references therein). The relation derived by Arnaud et al. (2005) for a sub-sample of six relaxed clusters hotter than 3.5 keV observed with XMM-Newton is consistent with the standard self-similar expectation, following the relation:
| (10) |
This result is in agreement with Chandra observations (Allen et al. 2001). In the case of MS0735, Eq. 10 turns into an estimate of . By considering the whole XMM-Newton sample (ten clusters in the temperature range [2-9] keV), the relation steepens with a slope (Arnaud et al. 2005) indicating a breaking of self-similarity. In this case we estimate . Although in better agreement with the - relation predicted from the cluster scaling laws, the mass estimate of as derived from the overdensity profile (see Sect. 7.1) is still consistent with a steeper slope of the relation considering the large errors that we measure.
7.6 - relation and pre-heating
The observed relation between X-ray luminosity and gas temperature in clusters is steeper than expected if cluster growth were governed by gravity alone. This steepening is best explained by the addition of heat to the ICM, and it has been estimated that the excess energies required to reconcile models and observations lie in the range of 1 to 3 keV per particle (Wu et al. 2000). The additional non gravitational heating is thought to have been injected into the gas during an early epoch of star formation and AGN activity, and therefore it has been called ”pre-heating”. Despite this term, there are now strong indications that powerful AGN outbursts occurring at late times may contribute a significant fraction of the extra energy (McNamara et al. 2005; Nulsen et al. 2005a, 2005b). In particular, in the case of MS0735 the driving energy of the shock as determined using a spherical hydrodynamic model is erg (McNamara et al. 2005). The AGN outburst in this cluster is therefore heating the gas mass within 1 Mpc at the level of about 1/4 keV per particle. The heating level increases to keV per particle when considering the gas mass within . This is a substantial fraction of the 1-3 keV per particle of excess energy required to preheat the cluster.
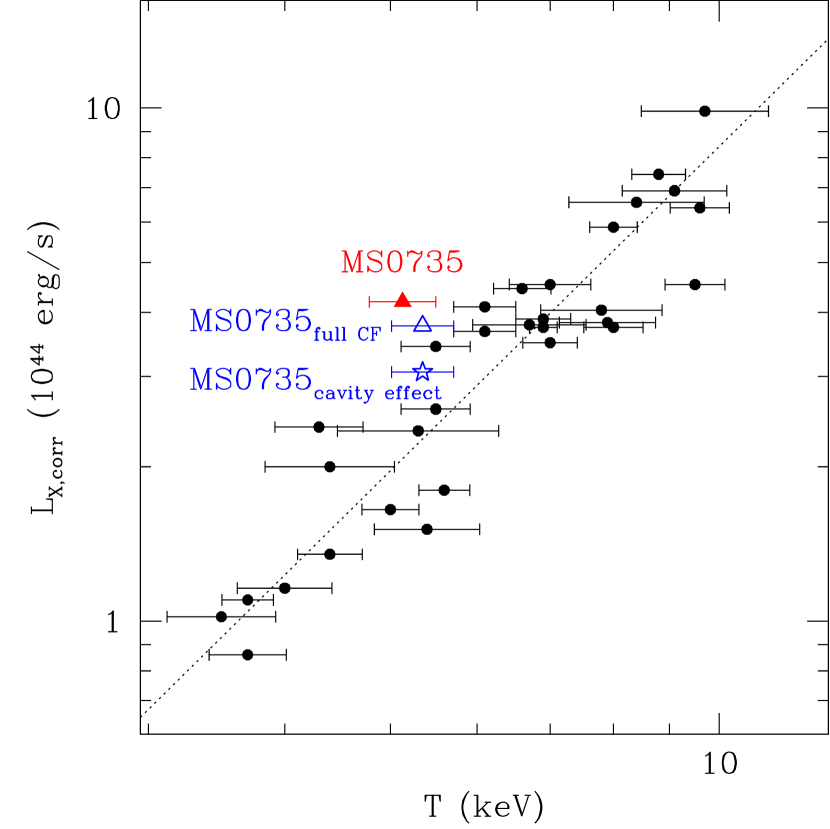
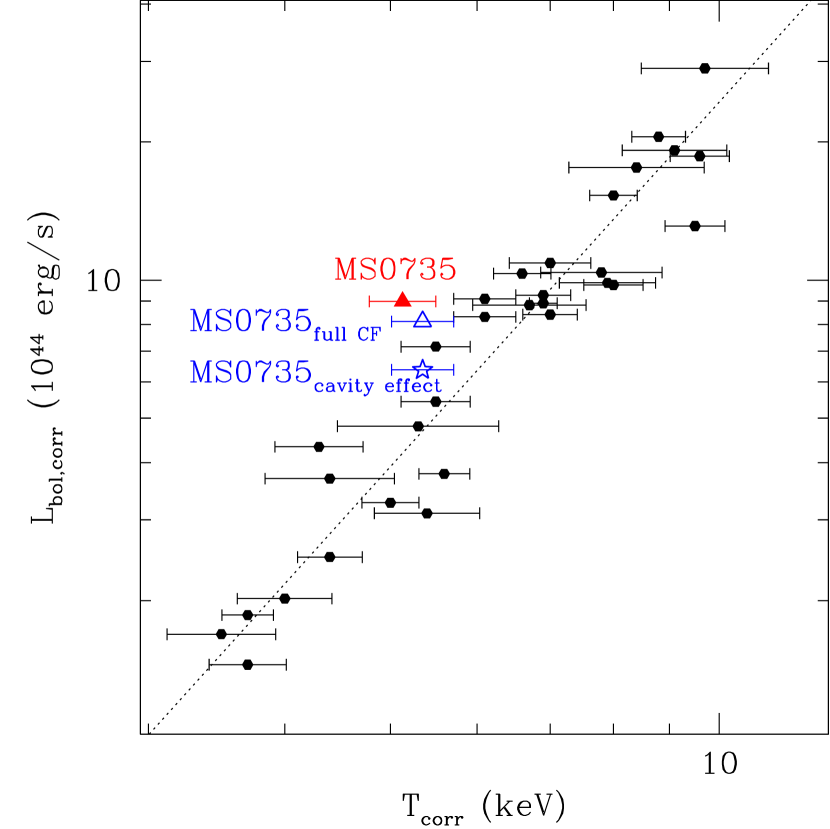
In order to place MS0735 in the observed luminosity vs. temperature relation for galaxy clusters we estimate that its X-ray luminosity in the 0.1-2.4 keV energy range is erg s-1. For a total, emission-weighted temperature of keV the observed luminosity is a factor 2.6 higher than that predicted by Markevitch’s relation (Markevitch 1998). The departure of MS0735 from the mean - relation is reduced when we correct both temperature and luminosity for the effect of the cooling flow, in the usual manner for the study of the scaling relations. In order to be fully consistent with the results presented by Markevitch (1998), we estimate the effect of the cooling flow by adopting the same approach of this author. The corrected temperature is obtained by averaging the projected temperature profile after excluding the coolest component in the central 20 arcsec bin (as estimated from a multiphase spectral fit), resulting keV. The corrected luminosity is estimated from the flux observed by masking the central 20 arcsec and then multiplying by a factor 1.06 which accounts for the flux of the hot plasma component inside the masked region. The corrected luminosity in the 0.1-2.4 keV energy range is erg s-1 and the corrected bolometric luminosity is erg s-1, which correspond to a factor higher than expected from the corrected average temperature of the cluster.
Note that the cooling flow region in MS0735 is bigger (see Sect. 5.4) than the average value adopted by Markevitch (1998) for the cluster sample, therefore the luminosities and temperature estimated above are not completely corrected for the effect of cooling flow. A more precise correction is obtained by estimating the luminosities from the spectra extracted after excluding the central 30 arcsec and then adding back in the luminosity expected from a -model profile inside the masked region. In this case we find values of erg s-1 and erg s-1. Similarly as done above, the temperature is estimated by averaging the temperature profile after excluding the coolest component in the central 30 arcsec bin, resulting keV. By considering these values “fully corrected” for the effect of cooling flow, the departure from the observed - relation is slightly reduced to a factor . The corrected luminosity vs. temperature relations for luminosities estimated in the X-ray and bolometric bands are plotted in Figs. 28 and 29, respectively. The MS0735 representative points are shown as red full triangles when corrected consistently with the method adopted by Markevitch (1998), and as blue open triangles when fully corrected for the effect of cooling flow. The results on temperatures and luminosities estimated in this section are summarized in Table 9.
7.6.1 The “cavity effect”
The energetic outburst and the consequently rising cavities uplift the central cool, low-entropy gas up to large radii, and the same time the compression in the shells increases the ICM density. This effect of cooling flow, cavities and bright shells (that for simplicity in the following we refer to as the ’cavity effect’) results in an increase of emissivity and thus luminosity. By considering a simple phenomenological model of the gas emissivity which assumes that all the gas filling the cavities is compressed into the bright shells due to the cavity expansion, we estimate that the luminosity is boosted by a factor which depends upon the cavity radius and shell thickness. For the particular configuration of the cavities observed in MS0735, we expect an increase in luminosity by a factor as high as about 25% (see Fig. 30), consistent with our measurements. Note that since the cavities lie outside the cooling region, their effect is not taken into account by the methods adopted above to correct for the cooling flow. The emission from the cavity region should also be masked before estimating the average properties of the “undisturbed” cluster. We thus extract the spectra in the annular region 1.3 - 6 arcmin (i.e. we excise the central 1.3 arcmin region which includes the cavities). From these spectra we estimate: erg s-1, erg s-1, where the missing luminosity expected from a -model profile inside the central masked region is added back in. A comparison of these values with those obtained by fully correcting for the effect of cooling flow allows us to evaluate the impact of the cavity effect on the luminosity (cf. blue open triangles and stars in Figs. 28 and 29). The observed luminosity increase is consistent with that expected by our simplified model of the structure and emissivity of the gas.
We want to stress that the cavity effect may contribute to partially explain the upward departure of MS0735 from the mean - relation, accounting for 25% of the increased luminosity. It may also be relevant for the measurements of the gas mass fraction in galaxy clusters: the cavities create lumps in the ICM and this results in an increase of emissivity and therefore in an overestimate of the gas density. We find indeed some evidence that the gas mass fraction in MS0735 might be higher than typically observed (see Sect. 7.1).

8 Conclusions
The main conclusions of this work can be summarized as follows:
-
•
The energetic outburst in MS0735 can heat the ICM up to a level of about 1/4 - 1/2 keV per particle, depending on its radius of influence, thus contributing a substantial fraction of the 1 to 3 keV per particle of excess energy required to preheat the cluster (Sect. 7.6). Only a few outbursts of this magnitude erupting over the life of a cluster would be required to preheat it.
-
•
MS0735 is a factor 2 more luminous than expected from its average temperature on the basis of the observed - relation for galaxy clusters (Sect. 7.6). Flux limited samples of distant X-ray clusters may be biased in favor of detecting clusters with energetic outbursts.
-
•
The ICM compression in the bright shells due to the cavity expansion produces a boost of the central luminosity of a factor that we estimate should be 25%, consistent with our measurements (Sect. 7.6). This ’cavity effect’ may contribute to partially explain the upward departure of MS0735 from the mean - relation, and may also lead to an overestimate of the gas mass fraction in qualitative agreement with the high value of that we measure for MS0735 (Sect. 7.1).
-
•
The observed scaled temperature and metallicity profiles are in general agreement with those observed in relaxed clusters (Sects. 7.2 and 7.3). Also, the quantities we measure for MS0735 are consistent with the - and - relations predicted by the cluster scaling laws (Sects. 7.4 and 7.5). This probably indicates that violent outbursts such as the one in MS0735 do not cause gross instantaneous departures from the average cluster profiles and cluster scaling relations (other than the - relation). However, if they are relatively common they may play a role in shaping these global properties.
It is nevertheless hard to draw general conclusions from only one object, and therefore in the future we plan to observe and study more supercavity systems.
References
- Allen et al. (2001) Allen, S. W., Schmidt, R. W., & Fabian, A. C. 2001, MNRAS, 328, L37
- Allen et al. (2002) Allen, S. W., Schmidt, R. W., & Fabian, A. C. 2002, MNRAS, 334, L11
- Anders & Grevesse (1989) Anders, E., & Grevesse, N. 1989, Geochim. Cosmochim. Acta, 53, 197
- Arnaud & Evrard (1999) Arnaud, M., & Evrard, A. E. 1999, MNRAS, 305, 631
- Arnaud et al. (2001) Arnaud, M., Neumann, D. M., Aghanim, N., Gastaud, R., Majerowicz, S., & Hughes, J. P. 2001, A&A, 365, L80
- Arnaud et al. (2002) Arnaud, M., et al. 2002, A&A, 390, 27
- Arnaud et al. (2005) Arnaud, M., Pointecouteau, E., & Pratt, G. W. 2005, A&A, 441, 893
- Benson et al. (2003) Benson, A. J., Bower, R. G., Frenk, C. S., Lacey, C. G., Baugh, C. M., & Cole, S. 2003, ApJ, 599, 38
- Bîrzan et al. (2004) Bîrzan, L., Rafferty, D. A., McNamara, B. R., Wise, M. W., & Nulsen, P. E. J. 2004, ApJ, 607, 800
- Blanton et al. (2001) Blanton, E. L., Sarazin, C. L., McNamara, B. R., & Wise, M. W. 2001, ApJ, 558, L15
- Blanton et al. (2003) Blanton, E. L., Sarazin, C. L., & McNamara, B. R. 2003, ApJ, 585, 227
- Böhringer et al. (1993) Böhringer, H., Voges, W., Fabian, A. C., Edge, A. C., & Neumann, D. M. 1993, MNRAS, 264, L25
- Borgani et al. (2002) Borgani, S., Governato, F., Wadsley, J., Menci, N., Tozzi, P., Quinn, T., Stadel, J., & Lake, G. 2002, MNRAS, 336, 409
- Brighenti & Mathews (2003) Brighenti, F., & Mathews, W. G. 2003, ApJ, 587, 580
- Brüggen (2002) Brüggen, M. 2002, ApJ, 571, L13
- Brüggen & Kaiser (2001) Brüggen, M., & Kaiser, C. R. 2001, MNRAS, 325, 676
- Bryan & Norman (1998) Bryan, G. L., & Norman, M. L. 1998, ApJ, 495, 80
- Cavaliere & Fusco-Femiano (1976) Cavaliere, A., & Fusco-Femiano, R. 1976, A&A, 49, 137
- Churazov et al. (2000) Churazov, E., Forman, W., Jones, C., Böhringer, H. 2000, A&A, 356, 788
- Churazov et al. (2001) Churazov, E., Brüggen, M., Kaiser, C. R., Böhringer, H., & Forman, W. 2001, ApJ, 554, 261
- Clarke et al. (2005) Clarke, T. E., Sarazin, C. L., Blanton, E. L., Neumann, D. M., & Kassim, N. E. 2005, ApJ, 625, 748
- David et al. (2001) David, L.P., Nulsen, P.E.J., McNamara, B.R., Forman, W., Jones, C., et al. 2001, ApJ, 557, 546
- De Grandi & Molendi (2001) De Grandi, S., & Molendi, S. 2001, ApJ, 551, 153
- De Young (2006) De Young, D. 2006, to be published in ApJ, astro-ph/0605734
- Dickey & Lockman (1990) Dickey, J. M., & Lockman, F. J. 1990, ARA&A, 28, 215
- Domainko et al. (2004) Domainko, W., Gitti, M., Schindler, S., & Kapferer, W. 2004, A&A, 425, L21
- Donahue, Stocke, & Gioia (1992) Donahue, M., Stocke, J. T., & Gioia, I. M. 1992, ApJ, 385, 49
- Donahue & Stocke (1995) Donahue, M., & Stocke, J. T. 1995, ApJ, 449,554
- Dunn et al. (2005) Dunn, R. J. H., Fabian, A. C., & Taylor, G. B. 2005, MNRAS, 364, 1343
- Eke et al. (1996) Eke, V. R., Cole, S., & Frenk, C. S. 1996, MNRAS, 282, 263
- Eke et al. (1998) Eke, V. R., Navarro, J. F., & Frenk, C. S. 1998, ApJ, 503, 569
- Ettori et al. (2002) Ettori, S., De Grandi, S., & Molendi, S. 2002, A&A, 391, 841
- Evrard & Henry (1991) Evrard, A. E., & Henry, J. P. 1991, ApJ, 383, 95
- Evrard et al. (1996) Evrard, A. E., Metzler, C. A., & Navarro, J. F. 1996, ApJ, 469, 494
- Fabian (2003) Fabian, A. C. 2003, MNRAS, 344, L27
- Fabian et al. (2000) Fabian, A. C., et al. 2000, MNRAS, 318, L65
- Fabian et al. (2002) Fabian, A. C., Voigt, L. M., & Morris, R. G. 2002, MNRAS, 335, L71
- Finoguenov et al. (2001) Finoguenov, A., Reiprich, T. H., Böhringer, H. 2001, A&A, 368, 749
- (39) Ghizzardi, S. 2001, EPIC-MCT-TN-011, XMM-SOC-CAL-TN-0022
- Gitti et al. (2006) Gitti, M., Feretti, L., & Schindler, S. 2006, A&A, 448, 853
- Heinz et al. (2002) Heinz, S., Choi, Y.-Y., Reynolds, C. S., & Begelman, M. C. 2002, ApJ, 569, L79
- Johnstone et al. (2002) Johnstone, R.M., Allen, S.W., Fabian, A.C., & Sanders, J.S. 2002 MNRAS, 336, 299
- Kaiser (1986) Kaiser, N. 1986, MNRAS, 222, 323
- Kaiser & Binney (2003) Kaiser, C. R., & Binney, J. 2003, MNRAS, 338, 837
- Lacey & Cole (1993) Lacey, C., & Cole, S. 1993, MNRAS, 262, 627
- Lin et al. (2003) Lin, Y.-T., Mohr, J. J., & Stanford, S. A. 2003, ApJ, 591, 749
- Lumb et al. (2002) Lumb, D. H., Warwick, R. S., Page, M., & De Luca, A. 2002, A&A, 389, 93
- Markevitch (1998) Markevitch, M. 1998, ApJ, 504, 27
- Markevitch et al. (2001) Markevitch, M., Vikhlinin, A., & Mazzotta, P. 2001, ApJ, 562, L153
- Mazzotta et al. (2002) Mazzotta, P., Kaastra, J. S., Paerels, F. B., Ferrigno, C., Colafrancesco, S., Mewe, R., & Forman, W. R. 2002, ApJ, 567, L37
- McNamara et al. (2000) McNamara, B. R., et al. 2000, ApJ, 534, L135
- McNamara et al. (2001) McNamara, B. R., et al. 2001, ApJ, 562, L149
- McNamara et al. (2005) McNamara, B. R., Nulsen, P. E. J., Wise, M. W., Rafferty, D. A., Carilli, C., Sarazin, C. L., & Blanton, E. L. 2005, Nature, 433, 45
- Mohr & Evrard (1997) Mohr, J. J., & Evrard, A. E. 1997, ApJ, 491, 38
- Navarro et al. (1996) Navarro, J. F., Frenk, C. S., & White, S. D. M. 1996, ApJ, 462, 56
- Nulsen et al. (2005) Nulsen, P. E. J., Hambrick, D. C., McNamara, B. R., Rafferty, D., Bîrzan, L., Wise, M. W., & David, L. P. 2005a, ApJ, 625, L9
- Nulsen et al. (2005) Nulsen, P. E. J., McNamara, B. R., Wise, M. W., & David, L. P. 2005b, ApJ, 628, 629
- Omma et al. (2004) Omma, H., Binney, J., Bryan, G., & Slyz, A. 2004, MNRAS, 348, 1105
- Peterson et al. (2003) Peterson, J.R., Kahn, S.M., Paerels, F.B.S., et al. 2003, ApJ, 590, 207
- Pfrommer. Enßlin, & Sarazin (2005) Pfrommer, C., Enßlin, T. A., & Sarazin C. L. 2005, A&A, 430, 799
- Piffaretti et al. (2005) Piffaretti, R., Jetzer, P., Kaastra, J. S., & Tamura, T. 2005, A&A, 433, 101
- Pollack et al. (2005) Pollack, L. K., Taylor, G. B., & Allen, S. W. 2005, MNRAS, 359, 1229
- Ponman et al. (1996) Ponman, T. J., Bourner, P. D. J., Ebeling, H., & Böhringer, H. 1996, MNRAS, 283, 690
- Rafferty et al. (2006) Rafferty, D., McNamara, B. R., Nulsen, P. E. J., & Wise, M. W. 2006, to be published in ApJ, astro-ph/0605323
- Readhead et al. (2004) Readhead, A. C. S., et al. 2004, Science, 306, 836
- Rebusco et al. (2005) Rebusco, P., Churazov, E., Böhringer, H., & Forman, W. 2005, MNRAS, 359, 1041
- (67) Roediger, E., Brueggen, M., Rebusco, P., Boehringer, H., & Churazov, E. 2006, MNRASin press, astro-ph/0611531
- Rosner & Tucker (1989) Rosner, R., & Tucker, W. H. 1989, ApJ, 338, 761
- Ruszkowski & Begelman (2002) Ruszkowski, M., & Begelman, M. C. 2002, ApJ, 581, 223
- Sanderson et al. (2003) Sanderson, A. J. R., Ponman, T. J., Finoguenov, A., Lloyd-Davies, E. J., & Markevitch, M. 2003, MNRAS, 340, 989
- Schindler et al. (2001) Schindler, S., Castillo-Morales, A., De Filippis, E., Schwope, A., & Wambsganss, J. 2001, A&A, 376, L27
- Spergel et al. (2003) Spergel, D. N., et al. 2003, ApJS, 148, 175
- Tabor & Binney (1993) Tabor, G., & Binney, J. 1993, MNRAS, 263, 323
- Tozzi & Norman (2001) Tozzi, P., & Norman, C. 2001, ApJ, 546, 63
- Tucker & Rosner (1983) Tucker, W. H., & Rosner, R. 1983, ApJ, 267, 547
- Vikhlinin et al. (2005) Vikhlinin, A., Markevitch, M., Murray, S. S., Jones, C., Forman, W., & Van Speybroeck, L. 2005, ApJ, 628, 655
- Vikhlinin et al. (2006) Vikhlinin, A., Kravtsov, A., Forman, W., Jones, C., Markevitch, M., Murray, S. S., & Van Speybroeck, L. 2006, ApJ, 640, 691
- Voit (2005) Voit, G. M. 2005, Reviews of Modern Physics, 77, 207
- Voigt et al. (2002) Voigt, L. M., Schmidt, R. W., Fabian, A. C., Allen, S. W., & Johnstone, R. M. 2002, MNRAS, 335, L7
- Voigt & Fabian (2006) Voigt, L. M., & Fabian, A. C. 2006, MNRAS, 368, 518
- Voit & Donahue (2005) Voit, G. M., & Donahue, M. 2005, ApJ, 634, 955
- White & Rees (1978) White, S. D. M., & Rees, M. J. 1978, MNRAS, 183, 341
- Wise et al. (2006) Wise, M. W., et al. 2006, in preparation
- Wu et al. (2000) Wu, K. K. S., Fabian, A. C., & Nulsen, P. E. J. 2000, MNRAS, 318, 889
- Zakamska & Narayan (2003) Zakamska, N. L., & Narayan, R. 2003, ApJ, 582, 162
| Radius | /dof | ||
|---|---|---|---|
| (kpc) | (keV) | () | |
| 0-70 (0-) | 694/641 | ||
| 70-140 (-) | 695/652 | ||
| 140-210 (-) | 715/617 | ||
| 210-315 (-) | 718/690 | ||
| 315-420 (-) | 484/505 | ||
| 420-630 (-) | 582/599 | ||
| 630-945 (-) | 858/739 | ||
| 945-1260 (-) | 1129/810 |
Note. — Results of the spectral fitting in concentric annular regions in the [0.4-10.0] keV energy range obtained by fixing the absorbing column density to the Galactic value (). The temperature (in keV) and metallicity (in fraction of the solar value, Anders & Grevesse 1989) are left as free parameters. Error bars are at the 90% confidence levels on a single parameter of interest.
| MOS1 + MOS2 | pn | |||||||
|---|---|---|---|---|---|---|---|---|
| Radius | norm | norm | ||||||
| (kpc) | (keV) | () | () | (cm-3) | (keV) | () | () | (cm-3) |
| 0-70 | ||||||||
| 70-140 | ||||||||
| 140-210 | ||||||||
| 210-315 | ||||||||
| 315-420 | ||||||||
| 420-630 | ||||||||
| 630-945 | ||||||||
| 945-1260 | – | – | – | – | ||||
Note. — Results of the deprojection analysis on annular MOS and pn spectra using the XSPEC projcttbabsmekal model. The column density is fixed to the Galactic value and the normalizations are in units of . The fits give /dof = 3160/2610 and 2786/2635 for MOS and pn, respectively.
| Par. | Mod. A | Mod. B | Mod. C | Mod. D |
|---|---|---|---|---|
| Norm | ||||
| — | ||||
| Normlow | — | |||
| /dof | 891/787 | 839/785 | 839/785 | 861/786 |
Note. — The best-fit parameter values and 90% confidence limits of the spectral analysis in the central 30 arcsec region. Temperatures () are in keV, metallicities () as a fraction of the solar value and normalizations in units of as done in XSPEC (for the mkcflow model the normalization is parameterized in terms of the mass deposition rate , in ). See text for details.
| Par. | mekal | mekal+mekal | |
|---|---|---|---|
| Cavity N | Norm1 | ||
| — | |||
| Norm2 | — | ||
| /DOF | 394/313 | 385/311 | |
| Cavity S | Norm1 | — | |
| — | |||
| Norm2 | — | ||
| /DOF | 288/287 | 275/285 |
Note. — The best-fit parameter values and 90% confidence limits of the spectral analysis in the cavity region. Temperatures () are in keV, metallicities () as a fraction of the solar value and normalizations in units of as done in XSPEC.
| Region | source counts | Z | /dof | |
|---|---|---|---|---|
| (MOS+pn) | (keV) | |||
| PRs-E | 3081 | 143/122 | ||
| PRs-W | 2361 | 87/100 | ||
| POs-N | 2958 | 116/110 | ||
| POs-S | 3122 | 113/118 | ||
| (PRs-E) (PRs-W) | 5442 | 301/227 | ||
| (POs-N) (POs-S) | 6080 | 233/233 | ||
| PRs (annulus) | 13187 | 440/461 | ||
| POs (annulus) | 22655 | 647/634 |
Note. — Results from the spectral fitting in the regions indicated in Figs. 13 and 14. The fit is performed in the [0.4-10.0] keV energy range by fixing the absorbing column density to the Galactic value. When fitting simultaneously two different regions at the same radial distance from the center (e.g., PRs-E + PRs-W), the normalizations of each camera are linked in order to have the same value in the two regions. Error bars are at the 90% confidence levels on a single parameter of interest.
| (kpc) | () | ||
|---|---|---|---|
| 200 | 1718 (218) | 7.12 (1.96) | 0.188 (0.052) |
| 500 | 1107 (145) | 4.77 (1.26) | 0.181 (0.048) |
| 1000 | 775 (105) | 3.27 (0.83) | 0.176 (0.046) |
| 2500 | 463 (65) | 1.74 (0.42) | 0.165 (0.040) |
Note. — Characteristic radii , total mass and mass gas fraction for various overdensities derived from the NFW fit to the mass estimated through the -model. All the quantities are estimated within (1 errors in parentheses).
| (kpc) | () | ||
|---|---|---|---|
| 200 | 2230 (650) | 15.6 (8.78) | 0.109 (0.061) |
| 500 | 1340 (410) | 8.46 (4.42) | 0.124 (0.065) |
| 1000 | 875 (280) | 4.71 (2.33) | 0.141 (0.070) |
| 2500 | 465 (158) | 1.76 (0.81) | 0.165 (0.076) |
Note. — Same as Table 6 for various overdensities derived from the NFW fit to the mass estimated through the deprojection method.
| Region | Z | /dof |
|---|---|---|
| PRs-E | 143/122 | |
| PRs-W | 87/100 | |
| POs-N | 116/110 | |
| POs-S | 113/118 | |
| Cav-N | 394/313 | |
| Cav-S | 288/287 | |
| A | 188/174 | |
| B | 173/210 | |
| C | 346/380 | |
| D | 371/335 | |
| (PRs-E) (PRs-W) | 301/227 | |
| (POs-N) (POs-S) | 233/233 | |
| (Cav-N) (Cav-S) | 869/605 | |
| A B | 497/389 | |
| C D | 902/720 |
Note. — Abundance measured in the regions indicated in Fig. 26. The mekal fit is performed in the [0.4-10.0] keV energy range by fixing the absorbing column density to the Galactic value. When fitting simultaneously two different regions at the same radial distance from the center (e.g., C + D), the normalizations of each camera are linked in order to have the same value in the two regions. Error bars are at the 90% confidence levels on a single parameter of interest.
| Band | Data | |||
|---|---|---|---|---|
| (keV) | (keV) | ( erg/s) | ( erg/s) | |
| 0.1-2.4 | total | 5.00 | 1.89 | |
| 0.1-2.4 | CF corr.M | 4.19 | 2.07 | |
| 0.1-2.4 | CF fully corr. | 3.76 | 2.26 | |
| 0.1-2.4 | cavity effect corr. | — | 3.06 | — |
| Bolom. | CF corr.M | 8.98 | 4.20 | |
| Bolom. | CF fully corr. | 8.12 | 4.69 | |
| Bolom. | cavity effect corr. | — | 6.37 | — |
Note. — Temperatures and luminosities measured for MS0735. The effect of the cooling flow (CF) has been evaluated by employing two different approaches. CF corr.M indicates the correction adopted by Markevitch (1998): the temperature is obtained by averaging the temperature profile after excluding the coolest component in the central 20 arcsec bin (as estimated from a multiphase spectral fit); the luminosities are estimated from the flux observed by masking the central 20 arcsec and then multiplying by a factor 1.06 which accounts for the flux of the hot plasma component inside the masked region. CF fully corr. indicates a more precise correction which takes into account the “true” extent of the cooling region in MS0735: the temperature is estimated by averaging the temperature profile after excluding the coolest component in the central 30 arcsec bin; the luminosities are estimated from the spectra extracted after excluding the central 30 arcsec and then adding back in the luminosity expected from a -model profile inside the masked region. indicates the luminosity expected from the luminosity vs. temperature relation (Markevitch 1998). The luminosities corrected for the cavity effect are also reported. See text (Sect. 7.6.1) for details.