MULTI-WAVELENGTH SIGNATURES OF MAGNETIC RECONNECTION OF A FLARE ASSOCIATED CORONAL MASS EJECTION
Abstract
The evolution of an X2.7 solar flare, that occurred in a complex magnetic configuration region on 2003 November 3 is discussed utilizing a multi-wavelength data set. The very first signature of pre-flare coronal activity is observed in radio wavelengths as type III burst that occurred several minutes prior to the flare signature in H. This type III is followed by the appearance of a looptop source in hard X-ray (HXR) images obtained from RHESSI. During the main phase of the event, H images observed from the solar tower telescope at ARIES, Nainital, reveal well-defined footpoint (FP) and looptop (LT) sources. As the flare evolves, the LT source moves upward and the separation between the two FP sources increases. The co-alignment of H with HXR images shows spatial correlation between H and HXR footpoints, while the rising LT source in HXR is always located above the LT source seen in H. The evolution of LT and FP sources is consistent with the reconnection models of solar flares. The EUV images at 195 Å taken by SOHO/EIT reveal intense emission on the disk at the flaring region during the impulsive phase. Further, slow drifting type IV bursts, observed at low coronal heights at two time intervals along the flare period, indicate rising plasmoids or loop systems. The intense type II radio burst at time in between these type IV bursts, but at a relatively larger height indicates the onset of CME and its associated coronal shock wave. The study supports the standard CSHKP model of flares, which is consistent with nearly all eruptive flare models. More important, the results also contain evidence for breakout reconnection before the flare phase.
Appl. Opt.
Bhuwan Joshi
Aryabhatta Research Institute of Observational Sciences (ARIES),
Manora Peak, Naini Tal263 129,
INDIA.
Phone: +91-5942-235583, 235136
Fax: +91-5942-233439
email: bhuwan@aries.ernet.in
1 Introduction
Stressed magnetic fields are thought to provide the free energy for a wide range of transient energetic phenomena on the Sun, ranging from the smallest microjets and microflares to the largest flares and coronal mass ejections (CMEs). During the onset of flares and CMEs, plasma of a wide range of temperatures (i.e., the cool plasma eruption observed in H to the rapidly heated plasma in excess of 10 million K as recorded in X-rays) as well as fast nonthermal particles, diagnosed in hard X-rays and radio, are emitted. The multi-wavelength observations are therefore essential to study the dynamical phenomena, which include plasma and filament eruptions, associated with the various stages of flares and their energy generation sites. For example, the radio observations at different frequency bands have provided the location, timing, and characteristics of beams of accelerated electrons from the flare site (e.g., Manoharan et al., 1996). In such multi-wavelength studies, the relationship inferred between the hottest thermal electrons and the non-thermal electrons provide the particle acceleration sites. However, it is unclear how these electrons are accelerated to various energy levels and what is the role of triggering of reconnection in controlling the timing of the hot thermal and non-thermal emissions and the escape of particles into the interplanetary medium.
A simplistic picture of the magnetic configuration of the flaring region was revealed by the soft X-ray observations from the Yohkoh satellite. It shows a cusp-shaped magnetic field configuration, which is formed along a filament channel and consists of overlying loops system. This simple geometry is in good agreement with the standard flare models, which demonstrate the reconnection between the low-lying current carrying twisted field lines and over-lying casual loops and the closure configuration of the system of loops after the flare and/or CME (see review by Hudson et al., 2004). However, recent observations and numerical simulations have suggested a more complex geometry for the reconnection of the magnetic fields having multiple poles (e.g., Antiochos, De Vore, and Klimchuk, 1999; Manoharan and Kundu, 2003; Moore et al., 2001). In this model, the energy for the flare/CME is stored in the stressed core of multi-polar magnetic fields and the evolution of their geometry as well as the weakening of the surrounding and over-lying fields trigger the onset of rapid magnetic reconnection to result in an explosion.
In this paper, we present a multi-wavelength study of a flare event (2B/X2.7) that occurred in the NOAA active region 10488, on November 3, 2003, during 01:00 UT to 02:30 UT. This event also produced a fast coronal mass ejection. The near-Sun manifestations of this event have been observed in H (ARIES), hard and soft X-rays (RHESSI and GOES), extreme ultra-violet (SOHO/EIT), and radio (HiRAS). In the interplanetary medium, the white-light images (SOHO/LASCO), space-based radio spectral data (Wind/WAVES), and interplanetary scintillation images (Ooty IPS data) provide the characteristics of propagation of the CME-associated disturbance. We describe the observational characteristics of the event obtained from the above stated measurements in Section 2. We discuss the results and conclude in the final section.
2 Observations
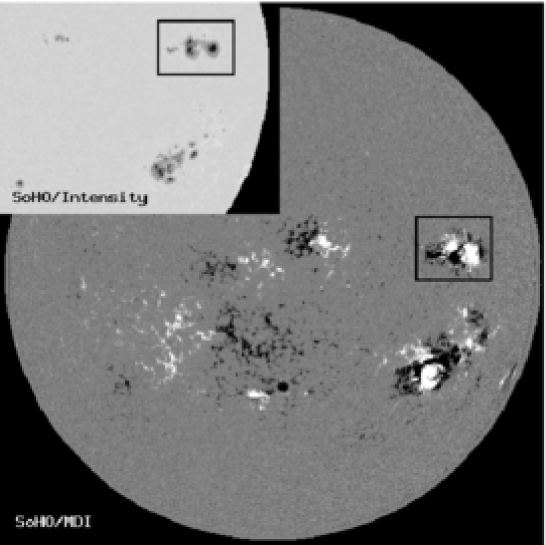
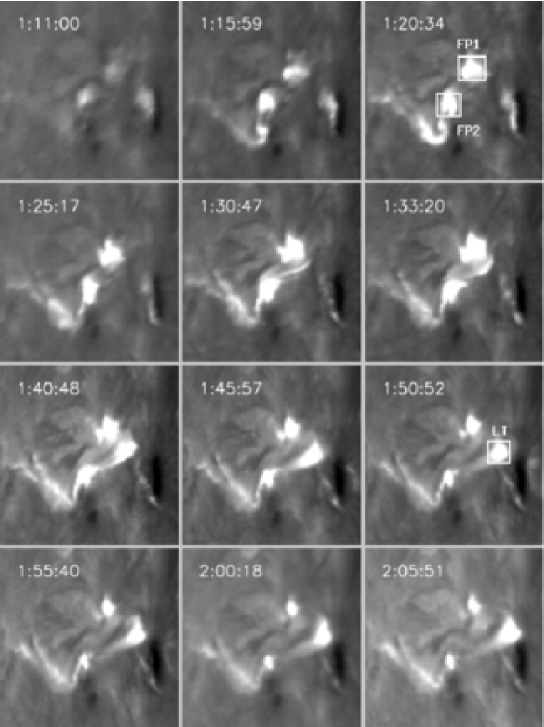
The flare event on November 3, 2003 occurred in a complex magnetic configuration region. The SOHO/MDI magnetogram of this active region observed a few days prior to the reported event is shown in Figure 1. The evolution of the long duration event (LDE) in H is shown in Figure 2, between 01:11 UT and 02:05 UT.
The soft X-ray flux recorded by the GOES satellite in the 0.5–4 and 1–8 Å wavelength bands starts to steadily increase as early as 00:30 UT, whereas the fast rise sets in around 01:00 UT and intensifies further at 01:13 UT (cf. Figure 3a). The maximum of X-ray intensity is observed around 01:30 UT and then this long duration event continues to decline gradually. The important signature observed in these X-ray profiles is that they indicate the characteristics of superposition of two peaks. The first one occurs at 01:17 UT and the later one at 01:30 UT, which coincides with the flare maximum. For this flare event, as shown by the RHESSI measurements, the hard X-ray activities seem to peak around the first phase and in the later time, the soft X-ray flux increases further and gets intensified at the flare maximum, 01:30 UT. We will now analyse the event in detail.
2.1 H Images

The H observations (=6563 Å 0.5 Å) of the flare event were made using a 15 cm f/15 Coudé refractor mounted on a tower at ARIES, Nainital, India. The images were recorded with a pixel 16 bit frame transfer CCD camera. The spatial resolution of the images is about 1′′ per pixel and the temporal cadence is about 20 s. During the observation of this event, the seeing condition was favourable and good quality images were obtained.
A careful examination of the H images reveals interesting features associated with this event as well as with the activity site. Figure 2 shows some representative H images from the rising to the declining phase of this long duration event. We find that during the rising phase of the flare, there are four chromospheric sources of H emission. But only two of them show strong emission (one at the northern and another at the southern side of the active region, indicated as FP1 and FP2 in Fig. 2) and they remain visible up to the maximum as well as in the decay phase of the flare. The H images of these sources after the flare maximum (i.e., after 01:30 UT) reveal that these two bright regions are connected by loops. During the rising phase, a spray-like activity is observed from the southern footpoint which shows mass motion towards the south east of the active region.
In Figures 3(b–e), the H intensity is plotted as a function of time. The four panels show the brightness variations of the whole flaring region, the northern footpoint, the southern footpoint and the LT source with respect to the background emission. The light curve of the flare as well as the two footpoints show a fairly quick rise similar to the soft X-ray profile (cf. top panel of Figure 3) and gradual decline of intensity between 01:10 UT and 02:25 UT. The brightness of the rising looptop source increases after the peak seen in the H light curve of the whole flaring region (cf. bottom panel of Figure 3). In the successive H filtergrams, a rapid increase in the looptop brightening is observed as it moves towards the west side of the active region. At the same time, the size and intensity of the footpoints decrease gradually after the flare maximum and the separation between the two increases. It is interesting to note that the looptop source in H is seen in emission against the solar disk, which is rather an unusual feature. This is considered as evidence for high pressure/density in the loops (Heinzel and Karlicky, 1987). Starting from 01:40 UT, the total intensity of the flaring region seems to be dominated by the emission originating from the top of the rising loops. On the other hand, the overall size and thickness of the loop system increase with time and provide a clear picture of the post-flare configuration associated with the flare event.
Here it is relevant to mention that another flare of class X3.9 occurred in the same active region nine hours later which looks totally homologous to this event. Several aspects of this later X-class flare have been studied in detail (Liu et al., 2004; Veronig et al., 2006; Vršnak et al., 2006a,b; Dauphin et al., 2006) and they show various common features between the two events in different wavelengths.
2.2 RHESSI Measurements
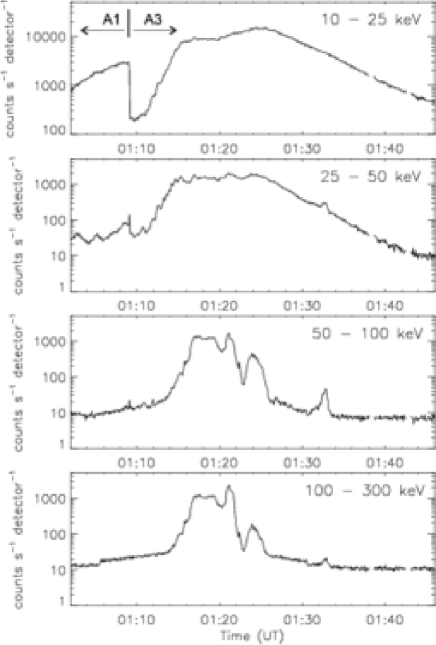
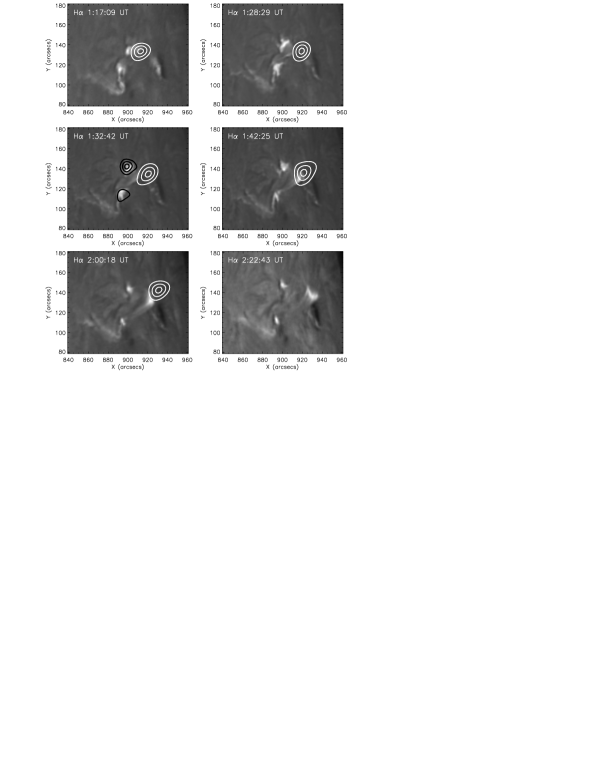
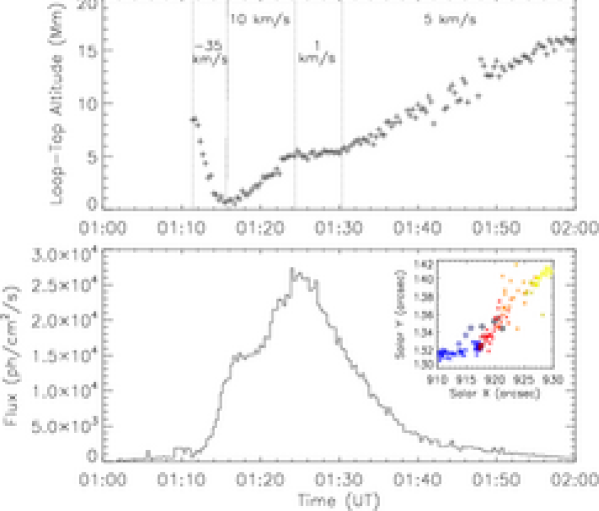
Figure 4 shows hard X-ray light curves in the 10–25, 25–50, 50–100 and 100–300 keV energy bands observed by the RHESSI instrument (Lin et al., 2002). The RHESSI observations cover the total impulsive phase of the flare but are contaminated by X-rays from a particle event, i.e., the RHESSI detectors were hit by high-energy particles trapped in the Earth’s radiation belts. The X-ray fluxes above about 30 keV are strongly affected by the particle event and therefore the time histories 30 keV have to be interpreted with caution since a substantial fraction of the signal is of non-solar origin.
In the hard energy channels, 100–300 keV, 50–100 keV, and 25–50 keV, the count rates peak around 01:18 UT and the maxima coincide with the time of the first maximum observed in the GOES profiles (refer to Figure 3a). Further, we observed another peak at 01:21 UT equal to the one at 01:18 UT. The first one was broad and lasted for about 4 min whereas the second peak was narrower. These peaks occur nearly simultaneously at three high energy bands. However, in the lower energy channels (probably dominated by thermal bremsstrahlung emission), i.e., 10–25 keV, and in the GOES profiles, the count rates maximized after 01:24 UT.
Figure 5 shows a sequence of H images overlayed with RHESSI X-ray images. The RHESSI images have been reconstructed with the Clean algorithm with the natural weighting scheme using front detector segments 3 to 8 in the energy bands 10–15 keV and 50–100 keV (Hurford et al., 2002). At high energies we were able to reconstruct RHESSI images only at the last X-ray peak around 01:33 UT (cf. Figure 4). At this time, two footpoints are observed in hard X-rays which are roughly co-spatial with the two strong footpoints observed in H (see Figure 5, third panel). Due to the strong contribution from the particle event, it was not possible to reconstruct RHESSI footpoint images at earlier times. The signal (solar) to “noise” (particle event) ratio is as low as 1:50 during these times (Gordon Hurford, private communication). However, in H two strong footpoints are observed during the whole impulsive phase which separate from each other in the course of time.
At low energies ( 30 keV) the X-ray emission is concentrated in a distinct looptop (LT) source located above the H LT source at each instant, as it is expected since the H LT source is generally considered to be the result of cooling (and also shrinking) of the hot X-ray emitting flare loops (cf. Vršnak et al., 2006a, and references therein). The RHESSI LT source can be observed as early at 01:02:20 UT when the X-ray level is still very low until the end of RHESSI observations at about 02:01 UT when the spacecraft again entered the Earth’s shadow.
Figure 6 shows the altitude evolution of the RHESSI LT source which was derived by measuring the centroids of the LT emission in the 10–15 keV energy band along its main axis of motion. The angular resolution of the RHESSI images which were reconstructed with front detector segments 3 to 8 is 8′′. However, we stress that the determination of the emission centroids of the sources may be as good as 1′′, depending on the count statistics and source complexity (Hurford et al., 2002). From 01:16 UT up to the end of the RHESSI observations at 02:01 UT the RHESSI LT source rises. In the classical “CSHKP” model of eruptive (two-ribbon) flares this rising motion as well as the footpoint separation reflects the progression of magnetic reconnection during which field lines rooted successively further apart from the magnetic inversion line reconnect. The highest upward growth is observed between 01:16 and 01:24 UT with a mean velocity of 10 km s-1. Afterwards the loop growth slowed down to 1 km s-1 between 01:24 and 01:30 UT, and rose again with a mean value of 6 km s-1 during the interval 01:30–02:00 UT. We note that these are comparatively low velocities for the growth of the flare loop system in an X-class flare (for instance, in the homologous X-class flare at 09:45 UT the velocities of the LT growth are about a factor 2–3 larger, see Fig. 6 in Veronig et al., 2006 and Table 1 in Liu et al., 2004). The low velocities are most probably due to the fact that the flare loop footpoints are rooted in sunspots (cf. the inset in Figure 1 and the last panel in Figure 5), i.e., regions of very strong magnetic fields : although the loop growth and ribbon expansion velocities are small, the locally reconnected magnetic flux can be very large.
Between 01:11 and 01:16 UT, i.e. at the beginning of the impulsive phase, the height of the LT source apparently decreases with a mean velocity of 35 km s-1 (cf. Figure 6). Such a decrease of the LT altitude in the early impulsive phase has been recently reported for several flares observed by RHESSI (Krucker, Hurford, and Lin, 2003; Sui and Holman, 2003; Sui, Holman, and Dennis, 2004; Liu et al., 2004; Ji et al., 2006; Veronig et al., 2006) as well as in soft X-rays by GOES12/SXI, in TRACE EUV and in microwaves (Li and Gan, 2005, 2006; Veronig et al., 2006), and is assumed to be closely related to the establishment of the magnetic reconnection process powering the flare (cf. the discussion in Sui, Holman, and Dennis, 2004).
2.3 EIT Observations
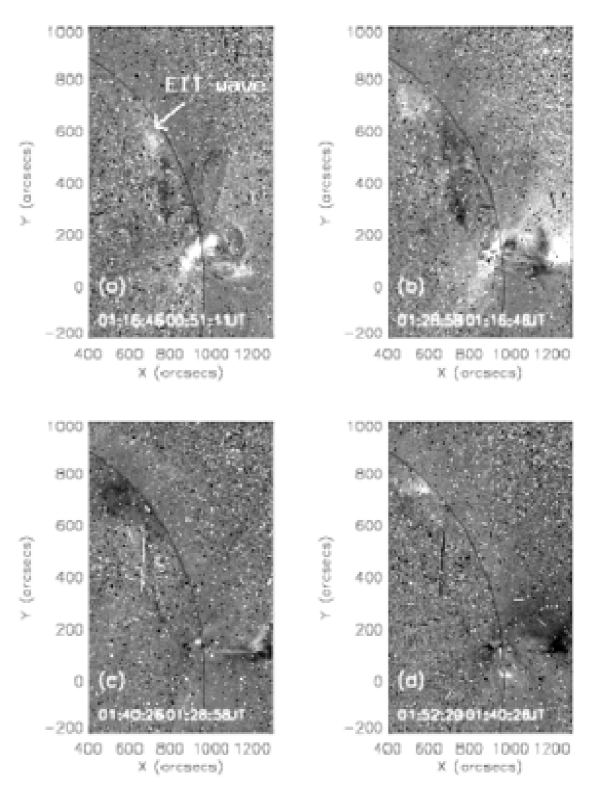
Figure 7 shows the EUV images of the flare and its environment observed at 195 Å with EIT onboard the SOHO spacecraft (Delaboudiniere et al., 1995). These running difference images reveal the sequence of activities from the beginning to the declining phase of the flare. During the rising phase (cf. Figure 7a) the eruption is evident where a patchy pattern of high intensity is observed on the disk, close to the active region. Moreover, two looptops are seen outside the limb towards the west side of the active region. The southern looptop is brighter than the one located just above, towards the north.
Figure 7b, which corresponds to the impulsive phase of the flare, shows eruption of plasma from the looptop. The intense emission observed close to the flare site in the previous image continues here. Further, the emitting region at the top of the loop system shows complex structure, suggesting a crucial stage at the time of the reconnection process, i.e., prior to the restructuring of the magnetic field after the reconnection followed by the ejection of plasma and field. The images recorded at the later time intervals (Figures 7c and 7d) show relaxation of field at the flare region and the intensity of the emission declines heavily. These results are consistent with RHESSI and H findings.
The EIT difference images also reveal the propagation of an EIT wave associated with the flare event (Thompson et al., 1999). In Figure 7a, the EIT wave is visible on the disk moving towards the north-east of the flaring region. The wave propagates further towards the north direction in the next image (Figure 7b).
2.4 Radio Spectra by HiRAS and WAVES
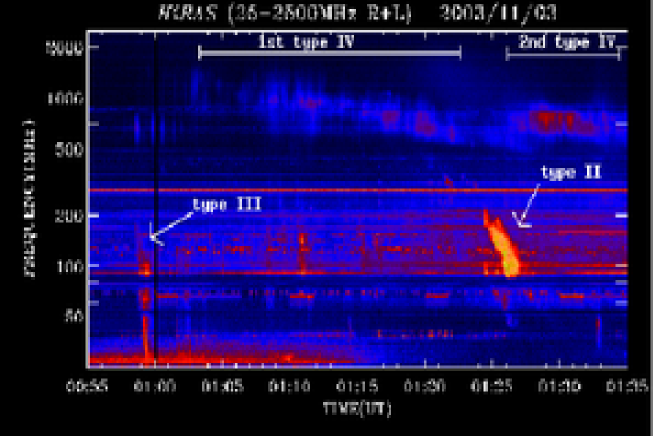
The HiRAS spectrograph operated by the NICT, Japan, observed significant activities at a wide range of frequencies between 30 and 2000 MHz in association with this LDE. Figure 8 shows the HiRAS spectrum. The radio emission starts at 00:59 UT with a bunch of type III bursts from 1000 MHz to the lowest observed frequencies, and is followed by two type IV continua one after the other between 01:02 and 01:35 UT. Both broad-band type IV continua (i.e., in the frequency-range 4001500 MHz) showed a slow drift toward the low frequency side. The first type IV continuum starts at a frequency of 1500 MHz and its width extended down to about 400 MHz between 01:02 and 01:22 UT. However, the second continuum was mostly confined between 1000 and 500 MHz and is observed during 01:2601:35 UT. The slow drifts observed in both Type IVs suggest the expansion of loops filled with non-thermal particles. The typical heliocentric height of these bursts can be at 1.1 R⊙. The drift rate of the first continuum suggests a typical expansion rate of about 40 to 60 km s-1 (01:02 to 01:22 UT). However, during this time interval, between 01:12 and 01:16 UT, the LT source as seen by RHESSI (cf. Figure 6) shows a downward altitude shift. It is likely that the expansion of the loop system caused a major reconfiguration of field lines. The second continuum seems to represent a lower expansion rate of 40 km s-1 (at time 01:25 UT).
Additionally, the spectrum of the first continuum showed vertical structures of brighter intensity at random time intervals. However, between 01:15 to 01:21 UT, these vertical structures formed two patches of high intensity with a frequency drift from 1000 MHz to 600 MHz. These patches of intense flux density represent rapid acceleration of electrons within a range of defined heights (i.e., 2 – 4 104 km), and they are likely to be associated with the particle acceleration along the current sheet during the reconnection process.
An intense type II burst is observed between 01:24 and 01:28 UT, in the frequency range of 20080 MHz. The intensity of this type II is low at the higher frequency side. However, a careful examination reveals the fundamental emission of this burst running parallel to the above intense burst at a lower-frequency range. As it has been reported in the literature (e.g. Kundu, 1965) the typical strength of the second harmonic seems to be more intense. Using the Saito coronal density model (Saito, 1970), we estimate the heliocentric height of the type II to be about 1.2 R⊙. It may be noted that the second harmonic of the type II has two regions: a fairly slow drift up to about 01:25 UT, followed by the onset of a sharp–fast drift structure. The slow–drift part seems to agree with a speed of about 700 to 800 km s-1, whereas the fast–drifting structure is consistent with a speed of about 1200 km s-1. The typical height of the type II emission is in good agreement with the EIT wave discussed above (e.g., Figure 7). The occurrence of the very intense fast–drifting type II suggests the ejection of mass, and its starting frequency, 200 MHz, confirms the ejection at a height above the first type IV continuum. In other words, the restructuring of magnetic field lines and the energy release of the flare/CME are revealed by the type II and type IV bursts as well as the structure embedded within them.
Here it is interesting to note that the EIT wave was observed a few minutes prior to the start of type II burst (cf. section 2.4 and Figure 7). The association between the EIT wave and the coronal shock wave (i.e. type II) suggests that both wave phenomena are probably different signatures of same coronal disturbance initiated by the flare or CME (see Klassen et al., 2000).
Just after the type II burst, a second slow moving type IV continuum starts at 1000 MHz and drifts to lower frequencies between 01:26 to 01:35 UT. On the whole, this type IV continuum is brighter than the first one discussed above. The radio emission from this continuum becomes very intense between 01:26 to 01:33 UT. We also find that, in the time interval of 01:26 to 01:29 UT, there are two bands of continuum bursts that lie one over the other on the frequency scale, suggesting the presence of two radio–emitting structures containing high-energy accelerated electrons.
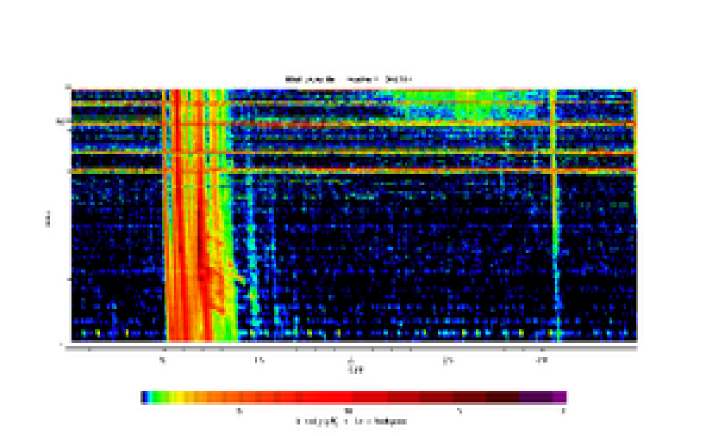
The type III bursts observed at 00:59 UT in the HiRAS spectrum continued in the whole frequency range of 1–14 MHz of the WAVES experiment on the Wind spacecraft (Figure 9). But, on the WAVES spectrum, multiple intense bursts were observed between 01:00 and 01:30 UT. Also, finger like structures were visible after the first maximum of the event around 01:24 UT in the frequency range of 1–2 MHz, indicating the production of accelerated particles after the first stage of reconnection. In the high-frequency part of the WAVES spectrum (i.e., 9–14 MHz), an intense patch of emission was observed between 02 and 03 UT. The emission height of this radio burst suggests that it is likely to be the continuation of the slow drifting type IV continua observed in HiRAS spectra, and hence is associated with the expansion of an arcade of loops to a height 2 R⊙.
2.5 Coronal Mass Ejection – White-light and IPS Images
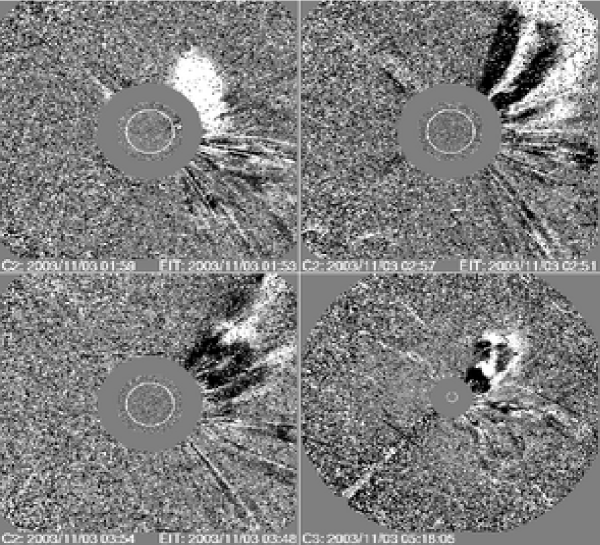

The Large-Angle Spectroscopic Coronagraph (LASCO) on board SOHO images the white-light corona from 230 R⊙ (Brueckner et al., 1995). The C2 coronagraph covers a field of view of 26 R⊙ while the C3 coronagraph images the corona from 430 R⊙. A CME, with a fairly wide bright loop front with cavity and gusty outflow moving towards the north-west side of the Sun, was associated with this flare event, (cf. Figure 10). The CME onset was first seen in the LASCO C2 field of view at 01:59 UT. The angular width and position angle of the CME were 65∘ and 304∘, respectively. At first, the CME appeared in C2 at a radial distance of 4 R⊙ and it could be followed by C3 up to 20 R⊙. In the C2 field of view, the CME appears to have a bright asymmetrical loop structure. The successive images show the fast movement of the CME with time. The CME maintains its loop-like structure till 02:57 UT when its leading edge goes beyond the C2 field of view. The CME first appears in the C3 field of view at 02:22 UT and can be seen till 06:42 UT when its leading edge becomes very faint. The height-time plot available at the SOHO LASCO-CME catalogue111http://cdaw.gsfc.nasa.gov/CMElist/ shows that the mean propagation speed of the CME in the LASCO field of view is about 827 km s-1. However, the first two points in the height-time plot of the CME observed by C2 indicate that the CME was faster at the beginning with a speed of about 1000 km s-1. A secondorder polynomial fit to the heighttime data indicates a deceleration of 28 m s-2 in the CME propagation at heliocentric heights less than 30 R⊙.
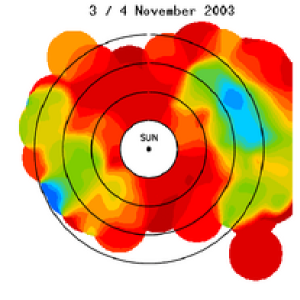
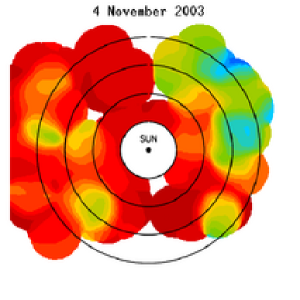
Figure 11 shows interplanetary scintillation (IPS) images of the CME observed with the Ooty Radio Telescope, Radio Astronomy Centre. The IPS technique measures the turbulent plasma at the front of the moving CME. The above images are projected on the sky plane and with these measurements the CME could be followed outside the LASCO field of view up to about 1 AU. In this heliocentric distance range the speed of the CME declined approximately as a power law of R-0.4, suggesting that the magnetic field associated with the CME supported the propagation to a fairly large distance of about 100 R⊙ (Manoharan et al., 2001; Manoharan, 2006). The CME deceleration, mostly effected by the typical interaction with the background solar wind flow (see, e.g., Vršnak et al., 2004, and references therein), seems to be rather slow. This indicates that additional energy is provided by the internal energy of the CME (i.e., possibly magnetic field expansion). The IPS images indicate that the CME associated shock propagates into the inner heliosphere to large distances from the Sun, while the IPS intensity indicates the strength of compression region between the shock and the driver gas, i.e., CME. Further, the speed profile and its comparison with IPS measurements made on a number of CMEs (Manoharan 2006), suggest an additional energy supplied by the CME to the propagation.
3 Discussion
The 2B/X2.7 flare that occurred on November 3, 2003 has been observed with a set of instruments, which cover a wide range of wavelengths and energy bands.
The multi-wavelength observations discussed in the previous section provide us some important features and sequence of activities before the rising phase of the event that need more attention. The HiRAS spectrograph shows the type III radio burst at 00:59 UT, significantly earlier than the flare signatures in soft X-rays and H. The type III started at 1000 MHz, very low in the corona and is followed by type IV that started at even lower coronal heights. The frequency drift of this type IV shows the bulging of the magnetic field system out into the corona. In HXR, a 10-15 keV LT source is observed in low corona as early as 01:02 UT. We interpret these observations as evidence for the first phase of a breakout, when reconnection in the corona transfers overlying flux to adjoining regions, thus weakening the constraining magnetic configuration (Antiochos, DeVore, and Klimchuk 1999). However, in the GOES profile the first peak is seen at 01:17 UT, which we attribute to the filling of thermal particles in the flare loops in response to the phase of the breakout process. The H images during this interval (i.e., between the type III and the first peak in GOES profile) show multiple brightenings in the chromosphere and a spray that shows evaporation of plasma from the chromosphere towards the north-east side of the active region.
During the whole impulsive and gradual phase, the H observations clearly show two strong welldefined footpoints which separate from each other in the course of time. After the flare maximum, a loop system is observed which connects these two footpoint sources. With the evolution of the flare, the loop system grows and intense emission is produced at the looptop. The emission at the two footpoints in H is co-spatial with the RHESSI image in the 50–100 keV energy band. On the other hand, the evolution of the looptop source is also evident in RHESSI images in the 10–15 keV energy band, and the RHESSI LT source is always located above the LT source in H. The growth of the loop system has also produced signatures in radio observations obtained from the HiRAS spectrograph between 1000–400 MHz frequency range as two broad band type IV radio bursts drifting towards the low frequencies one after the other. An intense type II burst, emission most probably at the second harmonic, occurred in between these type IV continua but at a lower frequency range (20080 MHz). The type II shows the onset of the CME and the associated coronal shock wave. EIT observations indicate intense brightening at the activity site as well as large loops associated with the active region. The H, RHESSI, and EIT observations along with the associated radio emission observed over a wide range of frequencies indicate the link between the energy release in the corona, downward to the chromosphere and upward in the heliosphere.
In the present analysis we have discussed the evolution of a flare and associated eruption that took place in a complex multipolar magnetic topology. The H and RHESSI observations clearly demonstrate the growth of a low lying loop system with the hard X-ray source at the top of the loops. With the evolution of the looptop source, new hot loops are formed with ever increasing altitude while the lower ones cool down and begin to be visible in H in the later stages. The EIT images show the magnetic field structure associated with the active region at larger heights in the corona. The CME structure observed in IPS images and their speed profiles suggest that the CME also carried sufficient magnetic energy. In summary, we find that the flare evolution is consistent with the standard CSHKP model of solar flares. The observations also contain evidence for breakout reconnection before the flare phase.
Acknowledgements.
It is a great pleasure to thank Ram Sagar for his support and encouragement in the present study. The authors thank the observing and engineering staff of Radio Astronomy Centre in making the IPS observations. We also acknowledge the technical staff of ARIES Solar Tower Telescope for their assistance in maintaining and making regular solar observations. We acknowledge RHESSI and SOHO for their open data policy. RHESSI is a NASA’s small explorer mission. SOHO is a project of an international collaboration between ESA and NASA. The authors would like to thank for the excellent LASCO-CME catalog, which includes the supportive data. The CME catalog is generated and maintained by the Center of Solar Physics and Space Weather, Catholic University of America, in cooperation with the Naval Research Laboratory and NASA. We also acknowledge the team of Wind/WAVES and HiRAS for radio dynamic spectra. We thank Gordon Hurford for valuable discussions on RHESSI data analysis. The constructive comments and suggestions from an anonymous referee are sincerely acknowledged. We thank Judy Karpen for insightful comments and valuable discussions that significantly improved the scientific content of the paper.References
- Antichos (1999) Antiochos, S. K., DeVore, C. R., and Klimchuk, J. A.: 1999, Astrophys. J. 510, 485.
- Brueckner (1995) Brueckner, G. E., Howard, R. A., Koomen, M. J., et al.: 1995, Solar Phys. 162, 357.
- Dauphin (2006) Dauphin, C., Vilmer, N., and Krucker, S.: 2006, Astron. Astrophys.. 445, 339.
- Delaboudiniere (1995) Delaboudinière, J.-P., Artzner, G. E., Brunaud, J., et al.: 1995, Solar Phys. 162, 291.
- Heinzel (1987) Heinzel, P. and Karlický, M.: 1987, Solar Phys. 110, 343.
- Hudson (2004) Hudson, H., Fletcher, L., Khan, J. I., and Kosugi, T.: 2004, in Solar and Space Weather Radiophysics, D. E. Gary and C. Keller (eds), Astrophysics and Space Science Library 314, 153.
- Hurford (2002) Hurford, G. J., Schmahl, E. J., Schwartz, R. A. et al.: 2002, Solar Phys. 210, 61.
- Ji (2006) Ji, H., Huang, G., Wang, H. et al.: 2006, Astrophys. J. 636, L173.
- Klassen (2000) Klassen, A., Aurass, H., and Mann, G., and Thompson, B. J.: 2000, Astron. Astrophys. Suppl. 141, 357.
- Krucker (2003) Krucker, S., Hurford, G. J., and Lin, R. P.: 2003, Astrophys. J. 595, L103.
- Kundu (1965) Kundu, M. R.: 1965, Solar Radio Astronomy, John Wiley & Sons.
- Lin (2002) Li, Y. P. and Gan, W. Q.: 2005, Astrophys. J. 629, L137.
- Li (2006) Li, Y. P. and Gan, W. Q.: 2006, Astrophys. J. 644, L97.
- Lin (2002) Lin, R. P., Dennis, B. R., Hurford, G. J. et al.: 2002, Solar Phys. 210, 3.
- Liu (2004) Liu, W., Jiang, Y. W., Liu, S., and Petrosian, V.: 2004, Astrophys. J. 611, L53.
- Manoharan (1996) Manoharan, P. K., van Driel-Gesztelyi, L., Pick, M., and Démoulin, P.: 1996, Astrophys. J. 468, L73.
- Manoharan (2001) Manoharan, P. K., Tokumaru, M., Pick, M. et al.: 2001, Astrophys. J. 559, 1180.
- Manoharan (2003) Manoharan, P. K. and Kundu, M. R.: 2003, Astrophys. J. 592, 597.
- Manoharan (2006) Manoharan, P. K. : 2006, Solar Phys. 235, 345.
- Moore (2001) Moore, R. L., Sterling, A. C., Hudson H. S., and Lemen, J, R.: 2001, Astrophys. J. 552, 833.
- Saito (1970) Saito, K.: 1970, Ann. Tokyo Astron. Obs., Ser. 2, 12, 53.
- Sui (2003) Sui, L. and Holman, G. D:: 2003, Astrophys. J. 596, L251.
- Sui (2004) Sui, L., Holman, G. D., and Dennis, B. R.: 2004, Astrophys. J. 612, 546.
- Thompson (1999) Thompson, B. J., Gurman, J. B., Neupert, W. M. et al.: 1999, Astrophys. J. 517, L151.
- Veronig (2006) Veronig, A. M., Karlický, M., Vršnak, B. et al.: 2006, Astron Astrophys. 446, 675.
- Vrsnak (2004) Vršnak, B., Ruždjak, D., Sudar, D., and Gopalswamy, N. 2004, Astron. Astrophys. 423, 717.
- Vrsnak (2006) Vršnak, B., Temmer, M., Veronig, A., Karlický, M., and Lin, J.: 2006a, Solar Phys. 234, 273.
- Vrsnak (2006) Vršnak, B., Warmuth, A., Temmer, M. et al.: 2006b, Astron Astrophys. 448, 739