High-Resolution Imaging of the Dust Disk around 49 Ceti
Abstract
Sub-arcsecond scale Keck images of the young A1V star, 49 Ceti, resolve emission at and m from a disk with long axis at PA ∘and inclination ∘. At m, the emission is brighter and more extended toward the NW than the SE. Modeling of the mid-infrared images combined with flux densities from the literature indicate that the bulk of the mid-infrared emission comes from very small grains ( 0.1 m) confined between and AU from the star. This population of dust grains contributes negligibly to the significant excess observed in the spectral energy distribution. Most of the non-photospheric energy is radiated at longer wavelengths by an outer disk of larger grains ( 15 m), inner radius 60 AU, and outer radius 900 AU. Global properties of the 49 Cet disk show more affinity with the Pic and HR 4796A disks than with other debris disks. This may be because they are all very young ( Myr), adding strength to the argument that they are transitional objects between Herbig Ae and “Vega-like” A stars with more tenuous circumstellar disks.
1 Introduction
Vega-excess stars were identified in observations with the Infrared Astronomical Satellite (IRAS) as having infrared excess emission attributed to circumstellar dust (see reviews by Backman & Paresce 1993 and Zuckerman 2001). More than a hundred Vega-excess candidates have been identified by comparison of IRAS sources with stellar counterparts in optical catalogs since the early discovery of prototypes such as Vega and Pic (Backman & Paresce 1993, Mannings & Barlow 1998, Silverstone 2000). Estimated ages and circumstellar dust masses support the view that these objects are largely distinct from their pre-main sequence counterparts, the T Tauri and Herbig Ae/Be stars. The latter have typical ages less than 107 yrs and fractional infrared luminosities, /, of approximately 0.25 (Adams, Lada & Shu 1987), while Vega-excess stars may be as old as 109 yrs with values of typically in the range to . Larger values of are found for a few Vega-excess stars with much younger ages (t yrs) that often appear to be associated with young kinematic moving groups (Moor et al. 2006). Jura et al. (1998) noted three A-type stars in the Bright Star Catalogue with and interpreted them as representative of an early phase of debris disk evolution. Pic, HR 4796A, and 49 Cet have since been assigned stellar ages of 20 Myr or less (Stauffer et al. 1995, Zuckerman et al. 1995, Zuckerman et al. 2001) and may well be important as examples of the transition from viscous protostellar accretion disks to planetary systems. The existence of such a phase is supported by recent Spitzer studies of weakline T Tauri stars in nearby clouds where a small sample of objects with values of in the high debris disk range was recently discovered by Cieza et al. (2006).
High-resolution images can reveal features that signal the presence of gravitational interactions between unseen planets and orbiting dust grains. In recent years more than a dozen such disks have been resolved, revealing tantalizing features like ring arcs, clumps, disk warps, and other non-axisymmetric signatures of potentially planetary importance (e.g. Holland et al. 1998, Koerner et al. 1998, Schneider et al. 1999, Heap et al. 2000, Koerner et al. 2001, Wilner et al. 2002, Clampin et al. 2003, Wahhaj et al. 2003, Ardila et al. 2004, Liu et al. 2004, Schneider, Silverstone & Hines 2005, Wahhaj et al. 2005, Kalas et al. 2005 and Kalas, Graham & Clampin 2006 ). Simple gaps and rings are often apparent, although these may not be definitive signatures of unseen planets (Takeuchi & Artymowicz 2001, Klahr & Lin 2001). Some features, however, are as yet unaccounted for by any other means. Examples include stellar offset from the orbital center of an elliptical ring around Fomalhaut (Kalas et al. 2005). The evidence for a planet-disk connection is now sufficiently compelling that the Vega-excess phenomenon has been proposed as an indirect detection method for planetary systems (Zuckerman & Song 2004).
Dynamically important disk features have been identified in high-resolution mid-infrared images for 2 out of the three young A-type stars mentioned by Jura et al. (1998). Keck studies of HR 4796A (Koerner et al. 1998; Telesco et al 2000; Wahhaj et al. 2005) and Pic (Wahhaj et al. 2003; Weinberger et al. 2003; see also Gemini mid-infrared observations by Telesco et al. 2005) reveal gaps and rings with azimuthal asymmetries, inclination offsets, and radial changes in grain size and distribution. Here we present Keck mid-infrared imaging of 49 Cet, the third nearby A-type star identified by Jura et al. (1998) as having a young debris disk in an early transitional phase. 49 Ceti is an A1V star with an age of 82 Myr (Zuckerman et al. 1995; Thi et al. 2000) and a distance of 613 pc. As discussed by Jayawardhana et al. (2001), mid-infrared radiation of 49 Cet (0.38 Jy in the IRAS 25 m band) is reduced in comparison to HR 4796A, posing an added challenge to imaging at mid-infrared wavelengths. Nevertheless, these authors report radiation from the circumstellar dust that is marginally resolved at 10.8 m with flux density mJy. Substantial long-wavelength excess has also been detected at = 60 m by Sadakane & Nishida (1986) and at = 1.2 mm ( = 12.7 mJy) by Bockelee-Morvan et al. (1994). Here we present Keck II images of 49 Cet at = 12.5 and 17.9 m together with simultaneous modeling of both the images and spectral energy distribution.
2 Observations and Results
49 Cet was imaged with the Mid-InfraRed Large-well Imager (MIRLIN; Ressler et al. 1994) at the f/40 bent-Cassegrain focus of the Keck II telescope on UT dates 7 October 1998 and 28-31 July 1999. At Keck, MIRLIN has a plate scale of 0′′.138 pixel-1 and a 17′′.5 field of view. Filters centered on 12.5 and 17.9 m with widths 1.16 and 2 m were used for the observations presented here. Initial sky subtraction was carried out by differencing images chopped 7′′ in an east-west direction at a frequency of 4 Hz. The telescope was nodded the same distance in a north-south direction after co-adding several hundred frames at each of the chop positions. The total integration times were 20 and 66 minutes at 12.5 and 17.9 m respectively. Residual background emission in the form of a striping pattern was removed by masking on-source emission and separately subtracting the median emission within each row and column of pixels. Disk emission in each of the double-differenced chop and nod frames was shifted and added to produce a final combined image. Observation and data reduction of standards Boo, Tau, Cet and Vega proceeded in the same way for photometric calibration and served as a representation of the Point Spread Function (PSF). Images of 49 Cet and PSF stars from separate nights of observation were co-added after weighting by the signal-to-noise ratio of their peak flux. Seeing effects on low-level emission in the PSF stars were mostly evident at 12.5 m and were reduced for both the source and calibration images by smoothing with a circular hat function.
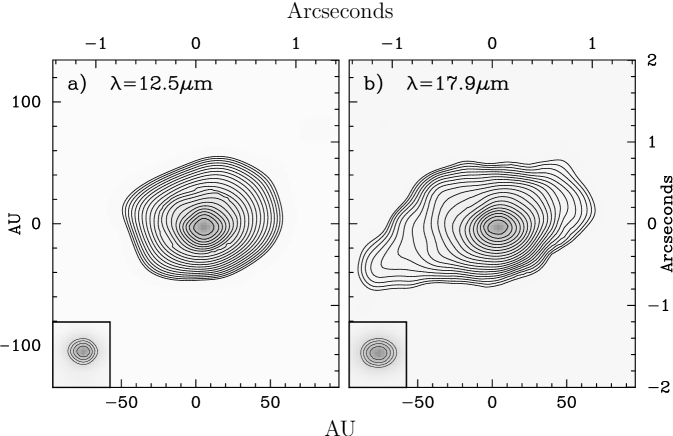
Final processed images of 49 Cet at angular resolutions of 0′′.41 and 0′′.48 at 12.5 and 17.9 m, respectively are shown in Fig. 1. The original 64 64 pixel (8.8′′ 8.8′′) images were finely gridded to 256 256 pixels and smoothed by convolution with a circular hat function of diameter equal to the Full Width Half Maximum (FWHM) of the PSF star Boo. Images of Boo, resampled and smoothed in the same manner, are shown in the insets in Fig. 1. Images used later for model-fitting purposes were smoothed in the same way, but not resampled beforehand. In Fig. 1 both images of 49 Cet are elongated along approximately the same position angle. To characterize this effect more accurately, normalized strip cuts were obtained from the images by windowing the emission in rectangular apertures aligned with the long axis of emission (PA = 125∘) and of width corresponding to the PSF FWHM. The results, displayed in Fig. 2, demonstrate that 49 Cet’s emission profile is clearly resolved at both wavelengths.
Flux densities for 49 Cet were derived using aperture photometry of images of the calibrator stars. Calibrator flux densities were adopted from the ISO Calibration web site (http://www.iso.vilspa.esa.es/users/expl_lib/ISO/wwwcal/) as follows: Boo ( Jy; Jy), Tau ( Jy; Jy), Cet ( Jy; 0.33 Jy) and Vega ( Jy; Jy). The resulting flux densities for 49 Cet were 20026 mJy and 18625 mJy at 12.5 and 17.9 m. Although our 12.5 m value and the appreciably higher IRAS 12 m measurement (330 mJy) are at first sight inconsistent, the discrepancy is explained readily by the fact that the IRAS band is much broader (6 to 18 m) and thus includes more of the bright photospheric emission at shorter wavelengths. Peak brightnesses, the flux in the brightest pixel divided by the pixel area, were 231 mJy/arcsec2 and 583 mJy/arcsec2 at 12.5 and 17.9 m respectively. The corresponding rms background values were 41 mJy/arcsec2 and 26 mJy/arcsec2. The extent of the long axis enclosed by the 2 contours of the 12.5 m emission is 1′′.64 (100 AU). At 17.9 m, elongation at the 2 level is 2′′.3 (140 AU) with the SE side clearly more extended than the NW side.
Available flux densities for 49 Cet at mid-infrared and longer wavelengths are listed in Table 1. A 200 m flux density from ISOPHOT observations (Walker & Heinrichsen 2000) was suspiciously low ( Jy) compared to the value implied by an interpolation between the 100 m IRAS and 1.2 mm IRAM observations. We have therefore listed only the values obtained directly from the Infrared Space Observatory (ISO) Data Archive ( Jy at 170 m and Jy at 150 m). Photometry in U,B,V,J,H,K,L and M bands from Sylvester et al. (1996) were used to constrain stellar photospheric properties as outlined below.
3 Modeling
We use a simple model of a flat optically thin disk with relatively few parameters (Backman, Gillett & Witteborn 1992; Koerner et al. 1998; Wahhaj et al. 2003; 2005) to derive the properties of the 49 Cet disk, since our images have limited spatial resolution, and there are relatively few flux density measurements. We assume that thermal radiation from an annulus of width at a distance from a star is given by:
where is the fractional surface density, the grain temperature, the Planck function, and the distance. For 49 Cet, 61 pc. Moderately absorbing dielectrics with an effective grain radius, , have radiative efficiency for and for (Greenberg 1979). The grain temperature for efficient absorbers and inefficient emitters is K can be calculated from radiative balance equations. For very small grains, m, which are both inefficient absorbers and emitters, K (Backman & Paresce 1993), where is the stellar luminosity, 18.4 for 49 Cet. The two temperature laws converge at m, and varying the grain radius across this point does not result in a discontinuity in temperature. However, the latter law yields degenerate solutions between and , and so only the product of the two quantities can be constrained. This degeneracy finds natural expression in the probability distributions generated by the Bayesian method which we discuss later. The assumed power-law emissivities are admittedly crude approximations for the grain temperature behavior. However, the constraining power of the extant data is also limited. Thus, more realistic temperature laws are counter-productive since they unnecessarily complicate the modeling method. The modeling constraints yielded on grain radii suggests a range of temperatures. It is better to work from these temperature ranges and investigate what kinds of dust grains they are consistent with, under more realistic modeling assumptions.
To describe the disk morphology and orientation we introduce parameters , the inner radius, , the width, , assuming radial density profile, , , the inclination of the disk to line of sight (90∘ is edge-on) and , the PA of long axis. We also include an asymmetry parameter , the factor by which emission from the NW ansa exceeds that from the SE. We simulate the stellar photosphere by fitting a Kurucz (1993) model of a star with Teff=9250 K to the optical and infrared photometry of Sylvester et al. (1996), and use the mid-infrared and longer wavelengths estimates from Table 1. The resulting photospheric flux density is added to the central pixel of the model image, and the final image is convolved with the appropriate PSF star to construct the simulated emission map. Models are varied over all parameter space, and the probability of each model calculated from following Wahhaj et al. (2005).
Initially, the two Keck/MIRLIN images were treated separately in the model-fitting process to differentiate their separate roles in constraining disk parameter values. Orientation parameters like and can be estimated only by fitting to these individual images. Most of the emission appears to arise in a small inner disk of very small ( m) hot grains that contribute neglibly to the spectral energy distribution (SED). Both the temperature and the size of grains are mainly constrained by the relative brightness of the disk at 12.5 and 17.9 m.
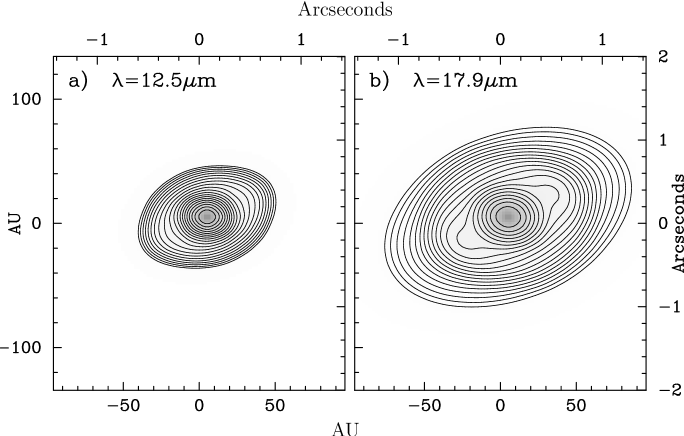
Our subsequent efforts to fit the SED and mid-infrared images simultaneously with a single disk model failed to reproduce the extensions in emission in the mid-infrared images. Unreduced values for the best fit were 45, with cardinality of the data only 27 (see also in Wahhaj et al. 2005). Fits to the SED alone required a much larger disk than that mandated by the images to reproduce the long wavelength flux densities and yielded only weak constraints on and grain radius . We then invoked a 2-part disk model comprising an inner disk of small grains to simulate the MIR images and a large outer disk with a population of large dust grains to fit the SED. To introduce as few parameters as possible the inner radius of the outer disk is set to begin at the outer edge of the inner disk. These two data sets are complimentary in that the 17.9 m image constrains the inner radius of the outer disk, while the SED limits the inner radius of the inner disk. This model effectively reproduces all the data, and yields a of 28. Most probable parameter values for the inner disk are ∘, ∘, = AU, = AU, m, , , with no constraints on . The probability distribution for the grain radius, actually peaks around m. The distribution suggests no lower limit mostly because the temperature law becomes degenerate between grain radius and optical depth for mas discussed earlier. Outer disk properties are ∘, ∘, = AU, = AU, m, , , and . There exists an unrefereed publication of an 850m JCMT/SCUBA detection of 49 Cet (Song, Sandel & Friberg 2004). At mJy, this value is inconsistent with the mm IRAM detection. We note that if the IRAM flux were ignored and instead the JCMT flux were used, the outer disk width would have to be 300 AU. The weak constraints on the disk asymmetry parameters can be explained by the fact that the average signal from the outer regions of the disk is roughly 3. Thus any asymmetry seen in our images are statistically not very significant. The probability distributions for the inner/outer disk configurations are dispayed in Fig. 5 & 6 .
Images simulated from the two-part disk model fit to Keck images and the SED for 49 Cet are displayed in Fig. 3. The simulated SED is shown in Fig. 4. We recognize that even this model may be an approximation to some more complicated structure that is not discernable from the current data set. Nevertheless, a number of useful properties emerge : 1) the 2-component disk has a uniform orientation, within uncertainties; 2) characteristic temperatures derived from a grain size-temperature relation (see Backman & Paresce 1993) are 360 K for inner dust grains and 95 K for the outer; 3) the total cross-sectional area of grains in the inner disk is 5 AU2, and in the outer disk, 1650 AU2; 4) a grain density of (Jura 1998), leads to masses of and respectively.
4 Discussion
Mid-infrared images have also identified variations in radial structure in the Pic and HR 4796A disks. Structures with sharply varying density and grain size are apparent within the depleted inner region of Pic’s disk (Lagage & Pantin 1994; Backman, Gillett & Witteborn 1992; Wahhaj et al. 2003; Weinberger et al. 2003; Okamoto et al. 2004; Telesco et al. 2005). Likewise, a comparison of mid-infrared and Hubble images of HR 4796A demonstrates that it is surrounded by a narrow ring of large grains embedded within a wider ring of smaller grains (Wahhaj et al. 2005), properties that are consistent with dispersal of an exo-Kuiper belt by radiation pressure. The analysis presented here suggests a similar morphology for 49 Cet. It is evident in Fig. 5 that there is only a very small probability that the disk around 49 Cet extends all the way to the star. Indeed, it is most likely that the region interior to 20 AU is strongly depleted of dust. The absense of silicate emission in Spitzer Space Telescope observations of 49 Cet suggests that the circumstellar dust must be cooler than 200 K (Kessler-silacci et al. 2005). In combination with the constraints on grain size obtained here, this further strengthens the case for a large inner clearing of the disk.
The major contribution to the excess luminosity comes from a large-grained outer disk with an inner edge that can barely be discerned in the 17.9 m image. Both the 12.5 and 17.9 m images predominantly trace a region that is approximately 30 to 60 AU from the star and composed of very small dust grains, 0.1 m. How can dust grains as small as 0.1 m survive in the harsh radiation environment of 49 Cet? A conceivable explanation can be found in a paper by Artymowicz (1997). Grain-grain collisions result in a size distribution, (Dohnanyi 1969). Grains smaller than 7 m, similar to the blow-out (-meteoroids) size for HR 4796A (Wahhaj et al. 2005), exit the system under radiation pressure. However, as they travel outward along the disk mid-plane, they undergo further collisions producing a dust avalanche of even smaller grains. The resulting amplification in the dust production rate depends on the disk surface density and the width of the disk traversed. The smallest grains (called -meteoroids), will experience a relative pile-up, since their outflow is braked more efficiently by residual gas (Thebault & Augereau 2006). An approximate expression for dust production-amplification due to the avalanche phenonemon is , where is the number of particles produced per collision and is the fractional surface density experienced by a particle traveling along the disk midplane. Collision physics predicts values between 102 and 103 for . Assuming that the disk thickness is , and the inner disk is 30 AU wide, . Thus the amplification factor ranges from 2 to 3000. Detailed numerical simulations of the avalanche mechanism show that, in a debris disk with properties similar to 49 Cet, an amplification factor of 200 may be expected (Grigorieva, Artymowicz & Thebault 2007). Obviously, too high a dust production rate predicts too short a disk lifetime. At the same time, rates consistent with the pile-up of -meteoroids are accomodated by the range of predictions.
Another plausible mechanism for -meteoroid production is the sublimation of icy bodies analagous to comets or Kuiper Belt Objects in our own solar system. Submicron refractory particles may be held together by volatile ices to produce large particles unaffected by radiation pressure. Upon sublimation, however, the smaller particles may be released and subsequently pushed outwards. Indeed, transient red-shifted lines in the Pictoris disks have been attributed to falling evaporating bodies (FEBs; Beust et al. 1990, 1996, 1998). While these events occur only for bodies that pass within 0.4 AU of the star, sublimation of comets and asteroids can occur as far out as 4 AU (Flammer et al. 1998). Since the dust/gas ratio in comets is close to 1 (Greenberg 1998), large amounts of evaporated fine dust particles might exist in the region of 49 Cet’s inner disk. Given the wide-ranging grain sizes in optically thin circumstellar disks, from submicron-sized grains in 49 Cet and HD 141569 (Marsh et al. 2002) to the 50m grains in part of the disk around HR 4796A (Wahhaj et al. 2005), we conclude that multiple processes may control the evolution of dust grains both in size and radial location.
In summary our analysis of 49 Cet, Pic and HR 4796A demonstrates that their disks have more in common than just a large fractional luminosity. Morphological resemblances that set these objects apart from other “Vega-like” A stars, including Psa and Vega itself may be due to their youth, 8-20 Myr (see discussion in Jura et al. 1993). They may in fact be in a transitional stage of evolution between that of viscous accretion disks around Herbig Ae stars (e.g., Mannings & Sargent 1997; Mannings, Koerner & Sargent 1997) and truly “Vega-like” stars with ages of order 100 Myr or greater. As such, they are interesting candidates for constraints on the survival times of circumstellar gas. Marginal detection of molecular gas ( ) has been reported around 49 Cet (Thi et al. 2001) based on observations of the pure rotational transitions of . If circumstellar exists, it will be an important factor in the evolution of dust grains, since this amount of gas will shorten the natural lifetime even for grains as large as a 50 m (Klahr & Lin 2001). A marginal detection of CO(21) emission at 1mm was also reported by Zuckerman et al. (1995). However, observations of CO(32) at 850 m by Coulson et al. (1998) suggest a very low upper limit on the gas mass in the disk . CO is easily frozen out onto grains in the colder parts of the disk (Aikawa et al. 1997).
A better understanding of both the abundance of molecular gas and the morphology of cold dust in the outer disk await study at longer wavelengths with higher resolution and sensitivity, such as will be available to the next generation of mm-wave arrays.
References
- (1) Adams, F.C., Lada, C.J., Shu, F.H. 1987, ApJ, 312, 788
- (2) Aikawa, Y., Umebahashi, T., Nakano, T., Miyama, S.M. 1997, ApJ, 486, L51
- (3) Ardila, D. R., Golimowski, D. A., Krist, J. E., Clampin, M., Williams, J. P., Blakeslee, J. P., Ford, H. C., Hartig, G. F., Illingworth, G. D. 2004, ApJ, 617, 147
- (4) Artymowicz, P. 1997, Annual Review of Earth and Planetary Sciences, 25, 175
- (5) Backman, D.E., Gillett, F.C., & Witteborn, F.C. 1992, ApJ, 385, 670
- (6) Backman, D.E., & Paresce, F., 1993, in Protostars & Planets III, (ed.E.H.Levy & J.I.Lunine), Tucson: University of Arizona Press, p.1253
- (7) Beust, H., Vidal-Madjar, A., Ferlet, R., Lagrange-Henri, A.M. 1990, Astronomy and Astrophysics, 236, 202
- (8) Beust, H., Lagrange, A.-M., Plazy, F., Mouillet, D. 1996, Astronomy and Astrophysics, 310, 181
- (9) Beust, H., Lagrange, A.-M., Crawford, I.A., Goudard, C., Spyromilio, J., Vidal-Madjar, A. 1998, Astronomy and Astrophysics, 338, 1015
- (10) Bockelee-Morvan, D,, André, P., Colom, P., Colas, F., Crovisier, J., Despois, D., Jorda, L. 1994, Circumstellar Dust Disks and Planet Formation, Proceedings of the 10th IAP Astrophysics Meeting, Institut d’Astrophysique, Paris
- (11) Cieza, L. A. et al. 2006, in preparation.
- (12) Clampin, M., Krist, J.E., Ardila, D.R., Golimowski, D.A., Hartig, G.F., Ford, H.C., Illingworth, G.D., Bartko, F., Benítez, N., Blakeslee, J.P., Bouwens, R.J., Broadhurst, T.J., Brown, R.A., Burrows, C.J., Cheng, E.S., Cross, N.J.G., Feldman, P.D., Franx, M., Gronwall, C., Infante, L., Kimble, R.A., Lesser, M.P., Martel, A.R., Menanteau, F., Meurer, G.R., Miley, G.K., Postman, M., Rosati, P., Sirianni, M., Sparks, W.B., Tran, H.D., Tsvetanov, Z.I., White, R.L., Zheng, W. 2003, AJ, 126, 385
- (13) Coulson, I.M., Walther, D.M., Dent, W.R.F. 1998, MNRAS, 296, 934
- (14) Dohnanyi, J.W. 1969, J. Geophys. Res., 74, 2531
- (15) Flammer, K.R., Mendis, D.A., Houpis, H.L.F. 1998, ApJ, 494, 822
- (16) Greenberg, J.M. 1979, Infrared Astronomy, Proceedings of NATO Advanced Study Institute, ed.G.Setti & G.G.Fazio (Dordrecht:Reidel), 51
- (17) Greenberg, J.M. 1998, Astronomy and Astrophysics, 330, 375
- (18) Grigorieva, A., Artymowicz, P., & Thebault, Ph. 2007, Astronomy and Astrophysics, 461, 537
- (19) Heap, Sara R., Lindler, Don J., Lanz, Thierry M., Cornett, Robert H., Hubeny, Ivan, Maran, S.P. & Woodgate, Bruce 2000, ApJ, 539, 435
- (20) Holland, W.S., Greaves, J.S., Zuckerman, B., Webb, R.A., McCarthy, C., Couldon, I.M., Walther, D.M., Dent, W.R.F., Gear, W.K., & Robson, I. 1998, Nature, 392, 788
- (21) Jayawardhana, R., Fisher, R.S., Telesco, C.M., Piña, R.K., Barrado y Navascués, D., Hartmann, L.W., Fazio, G.G. 2001, ApJ, 122, 2047
- (22) Jura, M., Zuckerman, B., Becklin, E.E., & Smith, R.C.1993, ApJ, 418, L37
- (23) Jura, M., Malkan, M., White, R., Telesco, C., Pena & Fisher, R.S.1998, ApJ, 505, 897
- (24) Koerner, D.W., Sargent, A.I. & Ostroff, N.A. 2001, ApJ, 560, L181
- (25) Koerner, D.W., Ressler, M.E., Werner, M.W., & Backman, D.E.,1998, ApJ, 503, L83
- (26) Kalas, P. et al. 2005, Nearby Resolved Debris Disks Conference, STSI
- (27) Kalas, P., Graham, J.R., Clampin, M.C., Fitzgerald, M.P. 2006, ApJ, 637, 57
- (28) Kessler-Silacci, J.E., Hillenbrand, L.A., Blake, G.A., Meyer, M.R. 2005, ApJ, 622, 404
- (29) Klahr, H.H., Lin, D.N.C. 2001, 554, 1095
- (30) Kurucz, R. 1993, ATLAS9 Stellar Atmosphere Programs and 2 km/s grid.Kurucz CD-ROM No.13.Cambridge, Mass.: Smithsonian Astrophysical Observatory.
- (31) Liu, M.C. 2004, Science, 305, 1442
- (32) Lagage, P.O., Pantin, E. 1994, Nature, 369, 628
- (33) Mannings, V. & Sargent, A.I. 1997, ApJ, 490, 792
- (34) Mannings, V., Koerner, D.W., & Sargent, A.I. 1997, Nature, 388, 555
- (35) Mannings, V., Barlow, M.J. 1998, ApJ, 497, 330
- (36) Marsh, K.A., Silverstone, M.D., Becklin, E.E., Koerner, D.W., Werner, M.W., Weinberger, A.J., Ressler, M.E. 2002, ApJ, 573, 425
- (37) Mo r, A., brah m, P., Derekas, A., Kiss, Cs., Kiss, L. L., Apai, D., Grady, C., Henning, Th. 2006, ApJ, 644, 525
- (38) Okamoto, Y.K., Kataza, H., Honda, M., Yamashita, T., Onaka, T., Watanabe, Jun-ichi, Miyata, T., Sako, S., Fujiyoshi, T., Sakon, I. 2004, Nature, 431, 660
- (39) Ressler, M.E., Werner, M.W., Van Cleve, J., Chou, H.A. 1994, Experimental Astronomy, 3, 277
- (40) Sadakane, K., Nishida, M. 1986, Astronomical Society of the Pacific, Publications, 98, 685
- (41) Schneider, G., Smith, B.A., Becklin, E.E., Koerner, D.W., Meier, R., Hines, D.C., Lowrance, P.J., Terrile, R.J., Thompson, R.I., Rieke, M. 1999, ApJ, 513, 127
- (42) Schneider, G., Silverstone, M.D., Hines, D.C. 2005, 629, 117
- (43) Silverstone, M.D. 2000, PhDT, UCLA
- (44) Song, I., Sandell, G., Friberg, P. 2004, Debris Disks and the Formation of Planets: A Symposium in Memory of Fred Gillett, ASP Conference Series, 324, 205
- (45) Stauffer, J.R., Hartmann, L.W., Barrado y Navascues, D. 1995, ApJ, 454, 910
- (46) Sylvester, R.J., Skinner, C.J., Barlow, M.J., Mannings, V. 1996, MNRAS, 297, 915
- (47) Telesco, C.M., Fisher, R.S., Piña, R.K., Knacke, R.F., Dermott, S.F., Wyatt, M.C., Grogan, K., Holmes, E.K., Ghez, A.M., Prato, L., Hartmann, L.W., & Jayawardhana, R. 2000, ApJ, 530, 329
- (48) Telesco, C.M., Fisher, R.S., Wyatt, M.C., Dermott, S.F., Kehoe, T.J.J., Novotny, S., Mari as, N., Radomski, J.T., Packham, C., De Buizer, J., Hayward, T.L. 2005, Nature, 433, 133
- (49) Takeuchi, T. & Artymowicz, P. 2001, ApJ, 557, 990
- (50) Thebault, P., Augereau, J.-C. 2006, Astronomy and Astrophysics, to be published.
- (51) Thi, W. F., van Dishoeck, E. F., Blake, G. A., van Zadelhoff, G. J., Horn, J., Becklin, E. E., Mannings, V., Sargent, A. I., van den Ancker, M. E., Natta, A., Kessler, J. 2001, ApJ, 561, 1074
- (52) Wahhaj, Z., Koerner, D.W., Ressler, M.E., Werner, M.W., Backman, D.E., Sargent, A.I. 2003, ApJ, 584, 27
- (53) Wahhaj, Z., Koerner, D.W., Backman, D.E., Werner, M.W., Serabyn, E., Ressler, M.E., Lis, D.C. 2005, ApJ, 618, 385
- (54) Walker, H.J., Heinrichsen, I. 2000, Icarus, 143, 147
- (55) Weinberger, A.J., Becklin, E.E., Zuckerman, B. 2003, ApJ, 584, 33
- (56) Wilner, D.J., Holman, M.J., Kuchner, M.J., Ho, P.T.P. 2002, ApJ, 569, 115
- (57) Zuckerman, B., Becklin, E.E. 1993, ApJ, 406, 25
- (58) Zuckerman, B., Forveille, T., Kastner, J.H. 1995, Nature, 373, 6514, 494
- (59) Zuckerman, B. 2001, Annual Review of Astronomy and Astrophysics, 39, 549
- (60) Zuckerman, B. & Song, I. 2004, ApJ, 603, 738
| Flux Density | Uncertainty | Photosphere | Reference | ||
|---|---|---|---|---|---|
| (m) | (m) | (Jy) | (Jy) | (Jy) | |
| 10.8 | 5.3 | 0.25 | 0.05 | 0.191 | Jayawardhana et al. 2001 |
| 12.5 | 1.2 | 0.2 | 0.026 | 0.143 | This work |
| 17.9 | 2.0 | 0.186 | 0.025 | 0.069 | ” |
| 12.0 | 6.5 | 0.33 | 0.066 | 0.154 | IRAS FSC |
| 25.0 | 11.0 | 0.38 | 0.076 | 0.036 | ” |
| 60.0 | 40.0 | 2.0 | 0.4 | 0.006 | ” |
| 100.0 | 37.0 | 1.91 | 0.38 | 0.002 | ” |
| 150.0 | 40.0 | 0.75 | 0.50 | 0 | ISO |
| 170.0 | 50.0 | 1.1 | 0.50 | 0 | ” |
| 800.0 | - | 0.036 (3) | - | 0 | Zuckerman & Becklin 1993 |
| 1200.0 | - | 0.0127 | 0.0028 | 0 | Bockelee-Morvan(IRAM) 1994 |