Young Stellar Groups Around Herbig Ae/Be Stars: A Low-Mass YSO Census
Abstract
We present NIR and MIR observations of eight embedded young stellar groups around Herbig Ae/Be stars (HAEBEs) using archived Spitzer IRAC data and 2MASS data. These young stellar groups are nearby ( 1 kpc) and still embedded within their molecular clouds. In order to identify the young stellar objects in our sample, we use the color-color diagram of J - [3.6] vs. Ks - [4.5]. The Spitzer images of our sample show that the groups around HAEBEs, spectral types earlier than B8, are usually associated with bright infrared nebulosity. Within this, there are normally 10 - 50 young stars distributed close to the HAEBEs ( 1 pc). Not only are there young stars around the HAEBEs, there are also young stellar populations throughout the whole cloud, some are distributed and some are clumped. The groups around the HAEBEs are sub-structures of the large young population within the molecular cloud. The sizes of groups are also comparable with those sub-structures seen in massive clusters. Young stars in groups around HAEBEs have generally larger SED slopes compared to those outside, which suggests that the young stars in groups are probably younger than the distributed systems. This might imply that there is usually a higher and more continuous star forming rate in groups, that the formation of groups initiates later, or that low mass stars in groups form slower than those outside. Finally, there is no obvious trend between the SED slopes and the distance to the HAEBEs for those young stars within the groups. This suggests that the clustering of young stars dominates over the effect of massive stars on the low-mass young stars at the scale of our study.
1 Introduction
It has been well known that stars form deeply within molecular clouds, which provide the raw material. However, how the star formation begins and proceeds within the molecular cloud is still one of the most fundamental yet unsettled questions in astronomy. For the past few decades, a picture of isolated solar-type star formation has been developed (e.g. Shu et al., 1987). The basic idea is that the forming star gathers mass via active infalling and circumstellar accretion after the onset of gravitational collapse. Therefore, the star will experience an envelope phase (Class 0/I protostar) when there exists an optically thick envelope with heavily infalling matter, a disk phase (Class II protostar, also known as T-Tauri star, CTT) when the envelope has been mostly evaporated but a massive disk is still accreting, and then a pre-main sequence phase (Class III, also known as weak-line T-Tauri star, WTT) when most material in the disk has disappeared but a solar-like planetary system may be developing. Not only a theoretical portrait, these star forming processes have been extensively suggested by modern infrared observations of nearby star forming regions.
Nevertheless, there has been increasing evidence that the majority of stars in the Galaxy do not form in isolation but in groups or clusters (e.g. Carpenter, 2000; Lada & Lada, 2003). Especially, isotopic studies of the short-lived radionuclide in the early solar system suggest the contamination from a nearby supernova ( 0.02-1.6 pc distance, e.g. Looney et al., 2006a), which suggests that even the Sun formed in a cluster environment rather than isolation. But how does a star form and evolve in a cluster environment (see reviews, e.g. Clarke et al., 2000; Elmegreen et al., 2000)? One would expect that there might be some modification or fundamental difference of star formation in a cluster from that in isolation. This should not be too surprising because the dynamical environment, such as the gas potential, the UV radiation field, encounter cross section of cluster members, and turbulence performance, dramatically varies with the evolution of cluster members.
Clusters are characterized by the number of cluster members, and often separated as groups (N 100) and clusters (N 100) (Adams & Myers, 2001). Larger clusters have higher probability to contain more massive stars, which are able to produce more feedback on the environment. These clusters, therefore, increase the ability to detect environmental effects on young cluster members observationally, but also increase the observational complexity. On the contrary, small clusters and groups often contain only one or a few massive stars, so that the dynamical effects of massive stars may not be significant or powerful enough to be detected. However, these small clusters and groups are the simplest systems that contain massive stars, so they can be treated as a starting point or basic unit of studying the environmental effects in clusters.
In this paper, we focus on these small clusters or groups around one or a few young intermediate mass stars ( 3-20 M⊙) with age a few Myrs (HAEBEs) (Herbig, 1960), in order to diminish the complexity of the environment. These kinds of groups are typical star formation systems in the Galaxy. The purpose of this paper is to investigate the low mass young stellar population around HAEBEs using Spitzer observations. In this paper, we will address the following questions: (1) How are low mass young stars distributed compared to the HAEBEs; (2) Is there any clustering or environmental effects; and (3) What are the IR properties of identified young stars compared to isolated stars. Furthermore, in order to clarify the definition of cluster and group, hereafter we use groups for small clusters and groups (our sample) and use clusters for all multiple systems in general.
2 Observations
2.1 Sample Selection
We sample eight young stellar groups around HAEBEs with archived Spitzer IRAC data. These young stellar groups are still deeply embedded within their molecular clouds, with spatial scales of a few pc and ages a few Myrs. The age criteria is required so that those low mass group members are old enough to have been born but young enough to be still going through infalling and accreting phases. In addition, there is at least one HAEBE star in the group, so that there will be at least a few tens of low mass group members. Moreover, all of them are nearby ( 1 kpc), that increases the sensitivity to detect lower mass group members as completely as possible. Table 1 lists the stellar parameters of the most massive star or stars in groups. Short description of each group is also summarized as follows:
-
•
BD40 contains three HAEBE stars, , V1686 Cyg, and the southern star of V1318 Cyg binary, with age 1 Myr at 1 kpc. Molecular clumps have been detected centered on the southern star of V1318 Cyg, which is therefore believed to be the youngest and most actively forming star (e.g. Looney et al., 2006b). Moreover, more than 80 of the group members show near infrared excess (Hillenbrand et al., 1995), which implies the youthfulness of this group. The fact that both massive and low mass stars form simultaneously within such a small scale provides us an excellent environment to study the star formation in the cluster.
-
•
NGC 7129 is a reflection nebula that contains three Herbig Be stars, LkH 234, , and . A number of young stars have been found in this system, along with molecular outflows (Edwards & Snell, 1983; Fuente et al., 2001) and dense molecular clumps centered on LkH 234 (Wang & Looney, 2007). It has been suggested LkH 234 is the youngest among the three Be stars (Hillenbrand et al., 1992). Several authors have published the Spitzer photometric and spectroscopic results for this system (e.g. Megeath et al., 2004; Morris et al., 2004; Gutermuth et al., 2004). It is included as one of our sources for completeness.
-
•
MWC 297 is an O9e star at 450 pc (Hillenbrand et al., 1992). B1.5V at 250 pc is also suggested by other authors (e.g. Drew et al., 1997). We use the former in this paper. Dense molecular emission, such as 13CO and C18O (Fuente et al., 2002; Ridge et al., 2003), and molecular outflows (e.g. Drew et al., 1997) have been detected around MWC 297, which suggests an active star forming environment.
- •
- •
-
•
HD 97048 is an A0e star surrounded by a few stars. It is the oldest in our sample.
-
•
BD46 system is embedded within a molecular cloud that includes the Herbig A0e star, , and the B0 star, . illuminates an emission nebula, IC 5146, that contains more than 100 stars, including four other late B stars; while 3.5 pc away, illuminates another emission nebula including more than 10 stars with an average age of 0.2 Myrs (Herbig & Dahm, 2002). How two clusters with such different sizes form closely in the same cloud is still unsolved and it also makes this system interesting for the study of star formation.
-
•
V921 Sco is an Be star away from the HII region, GAL 343.49-00.03, at the distance of 2 pc. This HII region contains the IR source, IRAS 16558-4228, and several radio sources. Four 10 m companions around V921 Sco were detected (Habart et al., 2003).
2.2 Infrared Observations
In this paper, we study the infrared emission of young stars. Young stars are normally detected at infrared bands because their circumstellar dust re-emits the stellar light into the infrared regime and enhances the infrared luminosity (so called infrared excess).
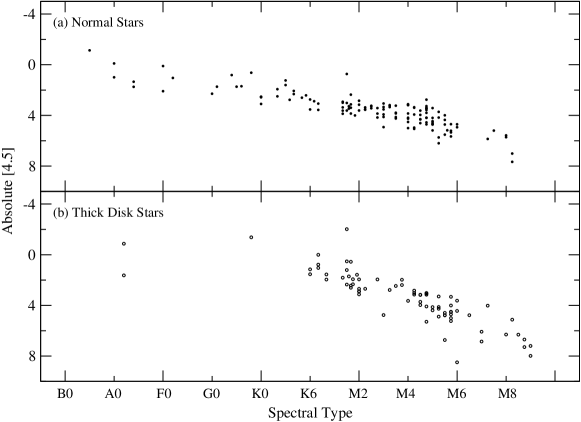
We use data from the 2MASS (Skrutskie et al., 2006) point source catalog and the Spitzer Archive to obtain the photometry at near- (2MASS: J, H, and Ks) and mid- (Spitzer IRAC: [3.6], [4.5], [5.8], and [8.0]) (Fazio et al., 2004) infrared bands. Table 2 summarizes the observational details of our sources from the Spitzer Archive. The source position and photometry of JHKs were obtained directly from the 2MASS point source catalog; the point source detection and photometry of IRAC data, which are PBCD in the Spitzer Archive, were accomplished using IRAF APPHOT package (daofind and phot tasks). Only sources above 5 are considered. We use an aperture radius of 3 pixel (3.6) and sky annulus from 3 (3.6) to 7 (8.4) pixels for all point sources. We use the zero magnitude of 21.108, 20.635, 20.1667, and 19.5 for IRAC [3.6], [4.5], [5.8], and [8.0], respectively (Fazio et al., 2004). The uncertainty of IRAC magnitudes is less than 0.05 mag for each channel of all sources. The detection limit at J band, J 17, is applied, which corresponds to the 0.2 mag uncertainty. Table 3 list the detection limit at each band of the identified YSO candidates in this study. The last column in Table 3 is the spectral type whose color is the detection limit at [4.5] using Figure 1(b) (more details about Figure 1 in Sec. 3.1).
3 Identifying Protostars
Recent studies in nearby embedded clusters have shown that photometry of Spitzer observations is efficient to identify young stars, especially to distinguish between stars with disks and envelopes (e.g. Allen et al., 2004; Megeath et al., 2004; Allen et al., 2006). For example, Hartmann et al. (2005) plots Taurus young stars with known classes (i.e. WTTs, CTTs, and Class I protostars), and shows that all of them are well separated in the color-color diagram, [3.6] - [4.5] vs. [5.8] - [8.0]. In addition, the color-color diagrams that combine IRAC and MIPS bands, for example [3.6] - [8.0] vs. [8.0] - [24] and [3.6] - [5.8] vs [8.0] - [24], are also efficiently used to identify young stars, especially for highly embedded stars and stars with significant inner holes (e.g. Rho et al., 2006; Lada et al., 2006). Indeed, unlike the near infrared (e.g. JHK) emission from young stars, the IRAC ([3.6], [4.5], [5.8], and [8.0]) and MIPS [24] channels contain a significant fraction of emission from circumstellar material (disk or envelope) over the stellar photosphere, so these channels are more sensitive to probe the circumstellar characteristics than the near infrared.
However, not all sources can be simultaneously detected at all bands. This is because the [3.6] and [4.5] are much more sensitive than others (Fazio et al., 2004). On the other hand, [5.8] and [8.0] contain strong PAH emission that easily confuse the detection and photometry of point sources. Since the archived data of our sources are not deep and the majority of the young star population in these groups are low mass, photometry using only the IRAC bands is not reliable to identify young stars. Therefore, due to the intrinsic difficulties of nebulosity confusion and sensitivity at [5.8] and [8.0], only the [3.6] and [4.5] IRAC bands are used here and combined with J, H, and Ks to identify young stellar objects. Indeed, the J to [4.5] colors have been used in some studies of embedded clusters (e.g. Gutermuth et al., 2004). In order to best separate between Class I/II protostars and Class III/normal stars in our sample with only J, H, Ks, [3.6], and [4.5], we examine the color-color diagrams of one of the most well studied and nearby young clusters IC 348 using the published infrared data (Luhman et al., 2003; Lada et al., 2006), and apply the results to our sources.
3.1 Case Study of IC 348
IC 348 is a partially embedded young cluster with age 2 Myrs at 260 pc, which contains 300 cluster members with spectral types from early B down to M (Muench et al., 2003). It is a cluster with an age and number of cluster members larger than our sample. We simply assume that the young stars in IC 348 are generally similar to those in our sample, so that we can compare techniques to identify young stars. Published NIR and Spitzer data of IC 348 are used, including the colors at J, H, Ks (Luhman et al., 2003), [3.6] and [4.5], SED-derived AV, and classes of protostars (Lada et al., 2006). In order to obtain the intrinsic colors, the interstellar extinctions are corrected by applying the extinction laws from Rieke & Lebofsky (1985) for J, H, and Ks and Indebetouw et al. (2005) for the IRAC bands, which corresponds to R. Moreover, in the paper of Lada et al. (2006), stars are classified as stars with pure stellar photospheres (star, hereafter called normal star), optically thick disks (thick), and anemic disks (anemic). Those stars with optically thick disks are most likely CTTs that have primordial disks while those with anemic disks are more like transition ones with mostly depleted disks. Here we only include stars with thick disks as young stars, in order to identify the primordial disk populations.
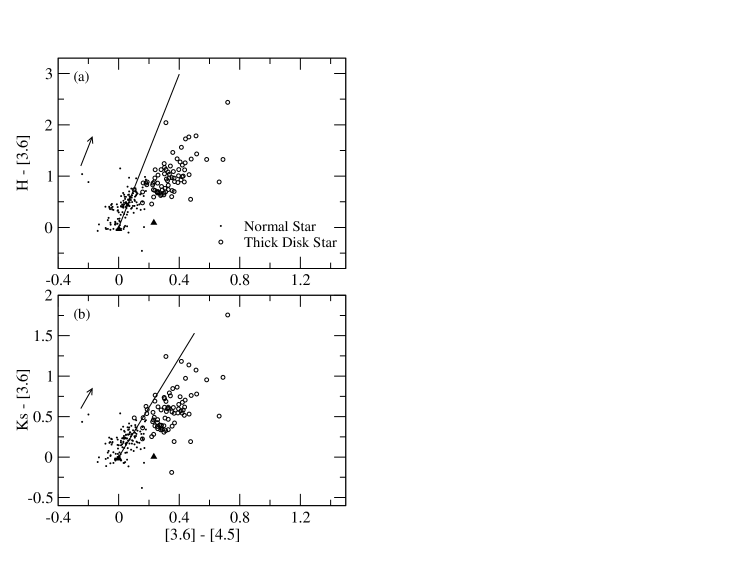
Figure 1 plots the absolute magnitude at [4.5] of normal and thick disk stars by applying the extinction and distance corrections. Using this figure, we can estimated the range of spectral types of identified young stars at an assumed distance. Figure 2 plots the dereddened color-color diagrams of H - [3.6] vs. [3.6] - [4.5] and Ks - [3.6] vs. [3.6] - [4.5] for IC 348, which are the methods often suggested by other authors (e.g. Hartmann et al., 2005; Allen et al., 2006). For example, Hartmann et al. (2005) showed that Taurus Class I/II protostars are clearly distinguished from Class III sources in both diagrams, especially in the diagram of H - [3.6] vs. [3.6] - [4.5]. In Figure 2, normal and thick disk stars in IC 348 are indeed distributed as two groups in the color-color diagrams. However, normal stars will mix with thick disk stars when they are highly extincted; extinction is usually significant in embedded clusters. In addition, the solid lines in Figure 2, which were arrows drawn in the Taurus study (Figure 3 in Hartmann et al., 2005), can not separate thick disk stars from normal stars in IC 348 as well as those in Taurus.
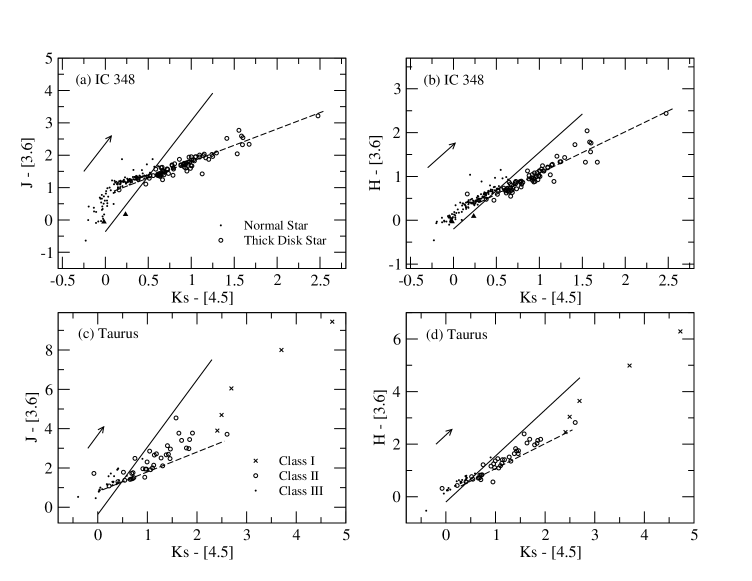
Figure 3(a) and 3(b) plot two dereddened color-color J to [4.5] diagrams for normal and thick disk stars in IC 348. They are the best color-color diagrams to separate normal and thick disk stars. We derive lines that divide the normal and thick disk stars,
| (1) |
(solid line in Figure 3(a) and 3(c)) and
| (2) |
(solid line in Figure 3(b) and 3(d)), which are both along the direction of extinction with , , and (Rieke & Lebofsky, 1985; Indebetouw et al., 2005). Because Equation (1) and (2) are along the direction of extinction, normal and thick disk stars can be still separated no matter how large the extinction. We also compare these two diagrams to Taurus’ results (Hartmann et al., 2005). Figure 3(c) and 3(d) plot the colors of Class I-III protostars in Taurus in the same color-color diagrams as 3(a) and 3(b). They show that Equation (1) and (2) can also discriminate most stars with circumstellar material (CTTs and Class I) from stars without disks (WTTs). According to the results of IC 348 and Taurus, we can conclude that at least 90 of young stars will be identified using Equation (1) and (2), and at most 10 of them are normal star contamination. In this study, we use Equation (1) and the color-color diagram of J - [3.6] vs. Ks - [4.5].
Not only can the thick disk stars be identified in Figure 3(a) and 3(b), they are also distributed within narrow bands. These are also found for CTTs in the color-color diagrams of J - H vs. H - K and H - K vs. K - L, so called CTTs loci (Meyer et al., 1997). Likewise, we can obtain two loci (dashed lines in Figure 3) via least-square fittings,
| (3) |
| (4) |
which are called YSO loci here. Although it does not necessarily mean that all young stars will locate along the YSO loci intrinsically, they can be useful to estimate the interstellar extinction of young stars. With estimated extinctions, we can get an average extinction, that help us understand the cloud conditions of our sample.
In summary, after examining the intrinsic colors of young stars in IC 348 and comparing them to the results in Taurus, we decide to use the color-color diagram of J - [3.6] vs. Ks - [4.5] as the tool of identifying young stars. All stars with colors redder than Equation (1) in this color-color diagram are young stellar candidates (hereafter called YSO candidates). This method is useful for those low mass groups similar to Taurus and intermediate-sized clusters similar to IC 348, when using J to [4.5] colors only. Methods of identifying young stars and YSO loci of young stars in different environments may be different due to the environmental impacts on the young stars. Therefore, in the future, this should be tested in other environments, such as massive clusters.
4 Spitzer Images and YSO Candidates
4.1 Dust Morphology
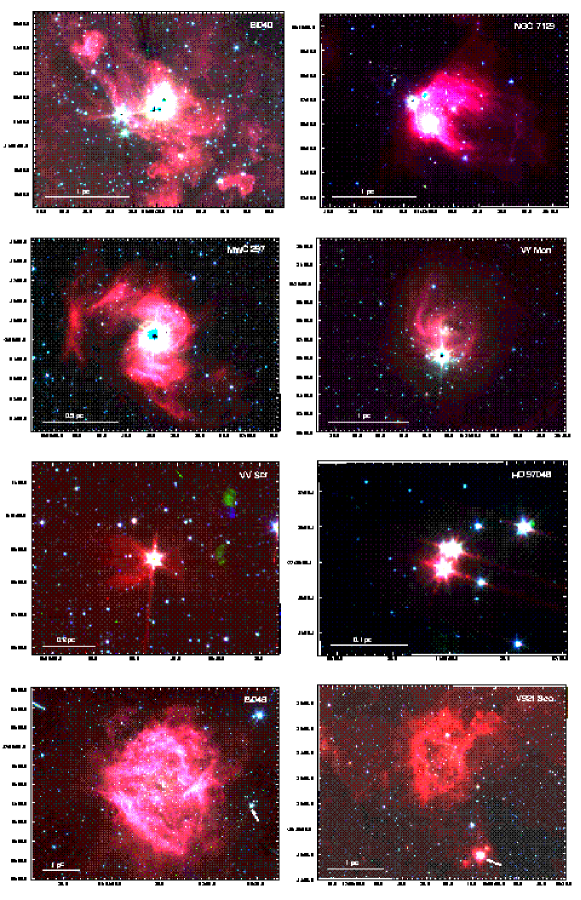
RGB color composite images of all sources are plotted in Figure 4, where [3.6], [4.5], and [8.0] are displayed as blue, green, and red, respectively. This figure shows the distribution of dust in red, which contributes significantly at [8.0]. The emission comes from thermal dust continuum illuminated by the massive HAEBEs and the PAHs, that often trace the star forming regions. From this figure, we can see that all but two of our sources show bright diffuse emission in channel [8.0]. However, the most massive star in the system, the HAEBE, is not always at the center of the dust. For example, the BD40 system is in a dust-rich environment and located right at the intersection of two branches of dust with different position angles. This is consistent with the two systemic velocities of dense gas that suggests that the high star forming activity is due to the collision of clouds. (Looney et al., 2006b). Unlike MWC 297, which has a basically centered symmetric dust nebula, the VY Mon and NGC 7129 systems are located at the edge of dust structures. These one-side structures may result from the disruption of the natal cloud by the massive star in one direction. However, we can not exclude the possibility that massive stars may not primordially form in the center of a dense cloud. Two of our systems, HD 97048 and VV Ser, show very little dust emission. This might be because they are both at the lower mass end of HAEBE stars (3.4 and 3.3 M, respectively)– not energetic enough to illuminate their environments.
Interestingly, the bright dust structures in two systems, BD46 and V921 Sco, are actually not associated with the HAEBEs, and V921 Sco, respectively. In the BD46 system, a symmetric morphology of dust with radius 2 pc is centered on the B0 star, , while no obvious dust is detected around the A0e star, . Again, this might be because is not massive enough, as it is an A0e star. On the other hand, in the V921 Sco system, there are multiple dust accumulations. The brightest dust feature is centered on the HII region, GAL 343.49-00.03, with radius 1 pc and 2 pc away from the B0e star V921 Sco. The Spitzer image also shows there is a large group of optically invisible stars deeply embedded within this HII region, that might suggest it is the most active star forming region in the area. Two other small dust clumps with radius 0.5 pc are centered on two IRAS sources, IRAS 16566-4229 and IRAS 16570-4227, 2 and 2.5 pc away from the HII region, respectively. As shown in Fig. 4, there is also some dust around the B0e star, V921 Sco. How the small groups of stars around and V921 Sco form so closely to the large clusters around and the HII region is interesting and still unknown. For the BD46 system, the group might form and escape while the gas within the cluster was dispersing, because seems to be isolated without any diffuse dust connected to the nebula. However, for the V921 Sco system, the V921 Sco group might form due to the collision of turbulent clouds near the actively forming cluster (the HII region), because both of them are surrounded by a large scale diffuse dust.
Table 4 lists the estimated spatial radial scales for the dust around the massive stars, defined as . We briefly conclude that groups around the HAEBEs whose spectral types are earlier than B8 are usually associated with bright dust and PAH emissions, although the formation mechanisms of our sample may be varied due to their different morphologies.
4.2 Color-Color Diagrams
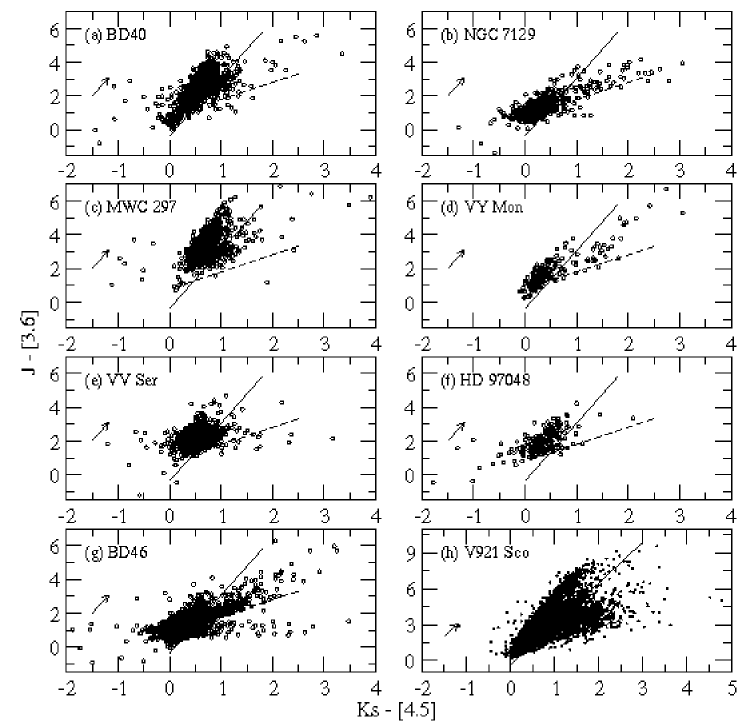
Figure 5 shows the color-color diagrams of J - [3.6] vs. Ks - [4.5] for all sources. The solid and dashed line are Equation (1) and (3), respectively. Stars redder (rightward) than the solid lines are characterized as YSO candidates; while those YSO candidates above the dashed lines are most likely thick disk stars (CTTs). From this figure, we can see that most of YSO candidates are indeed CTT-like. Those YSO candidates below the dashed lines and with large Ks - [4.5] may be young A or F stars, similar to those in the color-color diagram of J - H vs. H - K in Figure 15 of Hillenbrand et al. (1992).
Table 4 also summarizes the total number of identified YSO candidates for each source in the whole data field and inside the group, respectively. We simply define that the stars within the dust region (, estimated in the Sec. 4.1) are inside the group. Adams et al. (2006) derived the relationship between the number of cluster members () and radius of the cluster (), pc . Based on this equation, we calculate the group radius ( in Table 4) assuming that the entire population consists of our YSO candidates. The result that is comparable or less than (see Table 4) shows that the number of detected YSO candidates in groups is actually close to or less than the number of group members. Based on the number of YSO candidates, our sample can be sorted into three divisions: (1) 10 YSO candidates for HAEBEs later than B9: and HD 97048; (2) 20-50 for single HAEBEs earlier than B9: MWC 297, VY Mon, VV Ser, and V 921 Sco; (3) 50 for multiple HAEBEs or B stars: BD40, NGC 7129, and . The HII region in the V921 Sco system is not included because it is actually not a HAEBE group. This categorization implies a positive trend between the mass and number of massive stars and the number of young stars in groups, just as suggested by other authors (e.g. Hillenbrand et al., 1995; Palla et al., 1995). Despite the categorization, we can simply conclude that there are normally 10 - 50 young stars distributed centered at or close to the HAEBEs.
Moreover, according to Figure 5, the interstellar extinction for each CTT-like YSO candidate can be estimated using the offset from the YSO locus (Equation (3)). Except the V921 Sco system, which shows a relatively high extinction (AV 10 - 20 in average), the majority of the extinction is 10 (peak at 5) for YSO candidates in our sample.
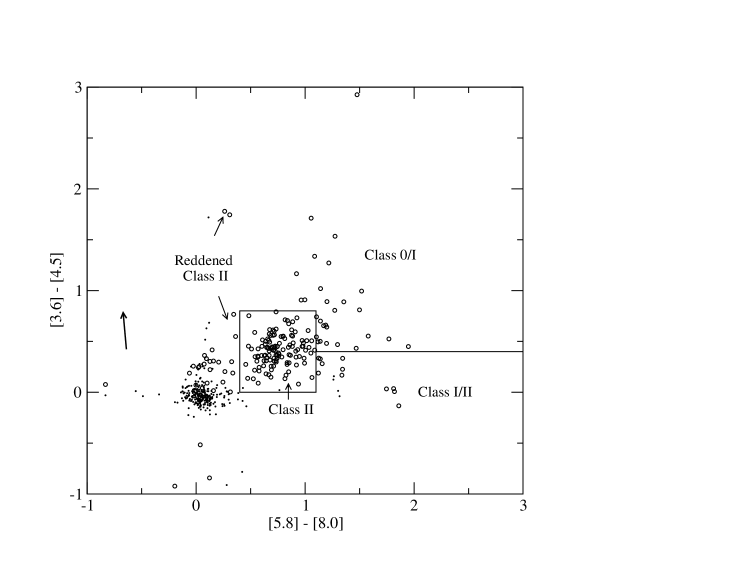
Figure 6 plots those YSO candidates in our sample with the identification of all four IRAC bands in the color-color diagram of [3.6] - [4.5] vs. [5.8] - [8.0]. We use the classification scheme proposed in Megeath et al. (2004) to characterize these YSO candidates: 10 , 3 , 80 , 1 , and 6 of them are Class 0/I, Class I/II, Class II, reddened Class II, and normal stars, respectively. This is consistent with the conclusion that more than 90 of YSO candidates are most likely young stars, from the case study of IC 348.
There is the possibility of contamination from background galaxies in our YSO candidate sample. Harvey et al. (2006) use the Spitzer Wide-Area Infrared Extragalactic Survey (SWIRE) Elais N1 data Surace et al. (2004) to determine the extragalactic contaminates; they find that 25 of the 591 sources (assuming they are all extragalactic) within 0.89 degree2 meet their YSO selection criteria. In other words, on average 25 extragalactic sources are misidentified as YSO candidates within 0.89 degree2. Although our YSO selection criteria are different (see Section 3), we can compare our results numerically, as most of the sources are foreground or background sources. For example, in our groups, 5 - 15 of identified point sources are YSO candidates, only slightly larger than the 5 in Harvey et al. (2006). This is not surprising as we expect to have more YSOs in our sample of pointed star formation observations compared to the large-scale survey. In other words, the YSO selection criteria are consistent with each other. Moreover, the detection limit at [8.0] in our sample, 14.0 (Table 3), is higher than that of the 25 extragalactic sources. Therefore, we adopt their value of 25 extragalactic sources in 0.89 degree2 as an upper limit to extragalactic contamination of our YSO candidates. For our sources, with small fields of view, it is unlikely that there will be more than a few extragalactic sources in each of our fields. Therefore, we conclude that the contamination from background galaxies should be negligible.
4.3 Spatial Distribution of YSO Candidates
One of the most basic questions when studying star formation in clusters is the location of the young stellar population. Two elements determine the distribution of young stars in the cluster, the initial cloud condition and the interaction of cluster members. Clusters form through the fragmentation of the molecular cloud, which is determined by the initial conditions, such as the gravitational potential, velocity field of the gas, magnetic field, and turbulence (see review, Meyer et al., 2000). However, after the onset of individual collapse in the cluster, the forming stars will continue being affected by the dynamical evolution of the cluster, for example, the removal of gas, feedback of stars, and collision between cluster members. With the continuous modification of the dynamical state in the cluster, the distribution of stars might change dramatically. Adams et al. (2006) modelled the early evolution (within 10 Myr) of clusters with 100 - 1000 members with respect to the boundness, cluster size, virial ratio, and number of cluster members with time. Their results showed that the gas dispersal plays a primary role in the evolution of these parameters. For example, in their Figure 3, the fraction of bounded cluster members is decreased from 1 to 0.2 within 5 Myrs after the gas dispersed for the virial initial condition. Although this depends on the real gas dispersal processes dramatically, it implies that there is a significant fraction of cluster members that will escape the cluster eventually; there should be a significant fraction of isolated stars actually formed in clusters. Moreover, Allen et al. (2006) studied several embedded clusters from the Spitzer survey and showed that protostars tend to distribute in elongated morphologies around massive stars, along with some sub-clustered structures. They suggested that the distribution of protostars may still appear as the primordial structure of the natal cloud. Indeed, studying the spatial distribution of young stars in clusters will allow us to assess not only the cluster formation but its history.
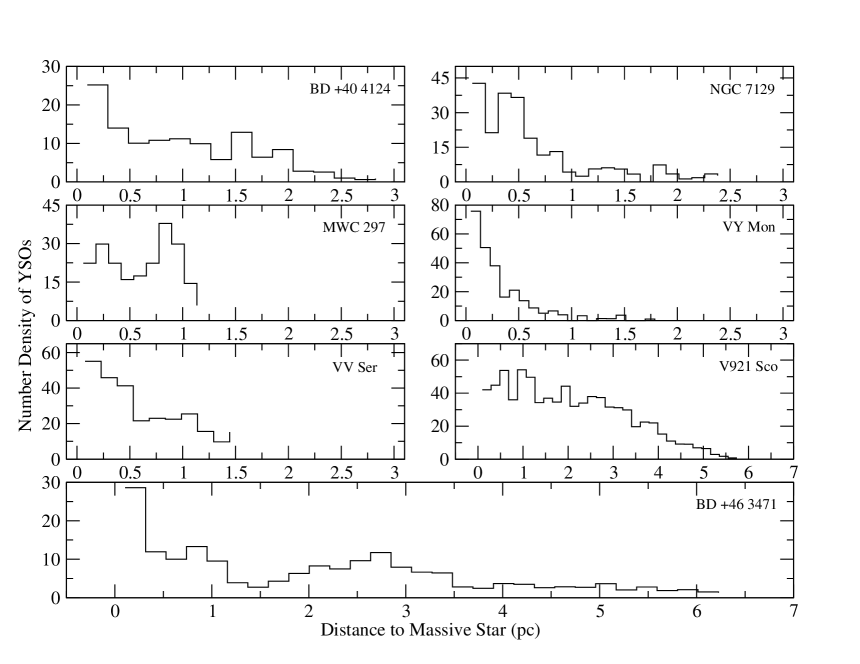
Figure 7 plots the number density of YSO candidates vs. the distance to massive stars. For example, in the BD46 system, it is centered on , instead of . The number density defines the number of YSO candidates per surface area (number pc-2). From this figure, we can see that there are indeed groups of YSO candidates around the massive stars as expected, but also a young stellar population throughout the whole field outside the group. Those YSO candidates outside the group are mostly distributed uniformly. However, there are some clumps of young stars outside the groups around HAEBEs, for example, MWC 297 and BD46. The young stellar group around HAEBEs, the clumps of young stars outside the group, and the overall distributed young population may be formed as a part of sub-clustered structures of an dispersed cluster. The fact that there exists a young population outside the group is reasonable as the group is actually embedded in a large-scale molecular cloud. The Spitzer observations of several young stellar clusters, including NGC 7129, show a similar picture (Megeath et al., 2004; Gutermuth et al., 2004) – a significant fraction of identified young stars distributed outside the cluster core. Their results also show that these young stars outside the cluster are actually well associated with the large scale dense molecular gas. They also suggest that the cluster forming environment plays an important role in determining the morphology of the young stellar population.
From Figure 7, we also can estimate the spatial size of the young stellar group around HAEBEs ( in Table 4) and the clumps of young stars outside the group. These groups and clumps have the sizes 0.5 - 1 pc, which are similar to the sizes of those sub-cluster structures in massive clusters (Allen et al., 2006). This further supports the suggestion in Section 1 that these groups can be treated as basic units of studying the star formation in clusters. In addition, Table 4 shows and are basically consistent, as shows the range of the dust distribution and probes the spatial clustering of the YSO candidates.
In summary, our results suggest that the groups around HAEBEs usually contain 10 - 50 young stars within the dust emission and form relatively isolated groups separated from the other regions in the large scale molecular cloud. The HAEBEs are normally located near the center of the group of young stars. These groups can be treated as sub-structures of the large scale young stellar population within the molecular cloud, as the clumpness of YSOs throughout the whole fields are seen. Each clump and group can also be compared to those sub-cluster structures found in massive clusters.
5 SED Slopes vs. Distance to the HAEBEs
The slope of the spectral energy distribution (SED) is often used as the parameter indicating the youthfulness of a young star (e.g. Wilking et al., 1989). The SED slopes of the YSO candidates in our sample are also derived, using Ks, [3.6], and [4.5]. However, the SED slope is modified by the interstellar extinction. We derive the SED slopes of YSO candidates in the BD40 system with AV 0, 5, 10, 15, and 20, and conclude that the SED slope will change 0.4 per increasing AV 5. This provides an uncertainty to the SED slope derivation, along with the estimated AV from Figure 5, for each of our sample.
5.1 Environmental Impact from Massive Star and Clustering
Not only are the position and mass of young stars affected by either the massive star or clustering, but the evolutionary stages of the clustering stars may also be affected. During the formation of massive stars, the molecular gas is actively disrupted by their strong stellar winds and UV radiation fields. These two factors might effectively alter the formation and evolution of protoplanetary disks, too. Studies on how EUV and FUV photons truncate the circumstellar disk and affect the formation of planets are increasing, especially theoretically. It is predicted that the mass loss decreases with the FUV flux, thus the distance to the massive star, so that the disk size would increase with distance to the massive star within the FUV dominated regime (Störzer & Hollenbach, 1999). In addition, alternative models about how close encounters of cluster members affect the size and mass loss of circumstellar disks are also studied. Pfalzner et al. (2006) suggested that the mass loss on the disks decreases with the distance from the cluster center due to the star-disk encounter, and high and low mass stars are affected more seriously than intermediate mass stars by the cluster environment. The recent observational result of the cluster IC 348 (Lada et al., 2006) also showed a dependence between the disk fraction and the mass and spectral type of stars. Direct observational evidence of truncated disks is also found in nearby massive clusters, such as Orion. Vicente & Alves (2005) probed the disk size distribution in the Trapezium cluster. However, they found no correlation between disk size and the distance to the massive star or between disk size and the mass of the star, as theories predict (e.g. Störzer & Hollenbach, 1999). They suggest that there might be various mechanisms of disk destruction happening so that no obvious correlation is shown.
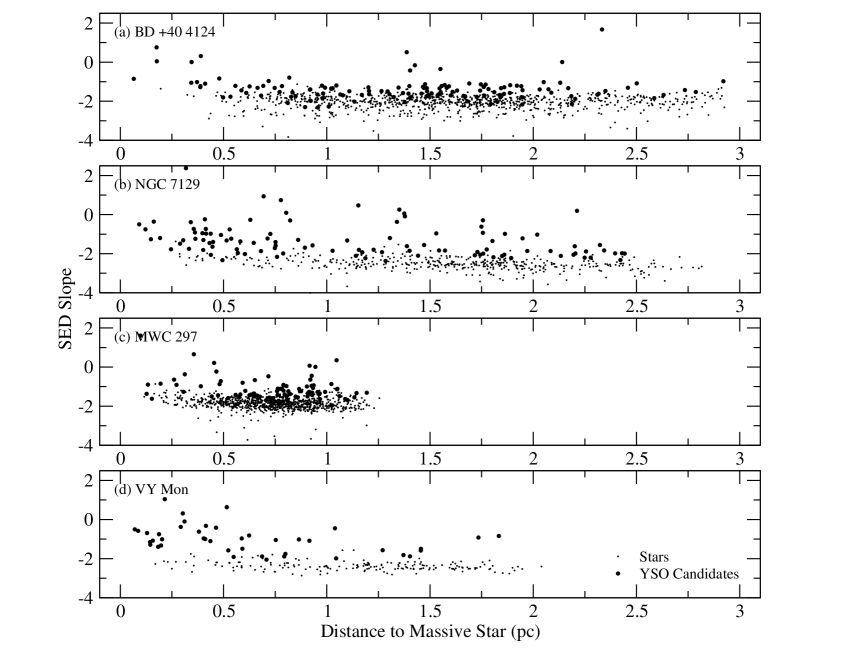
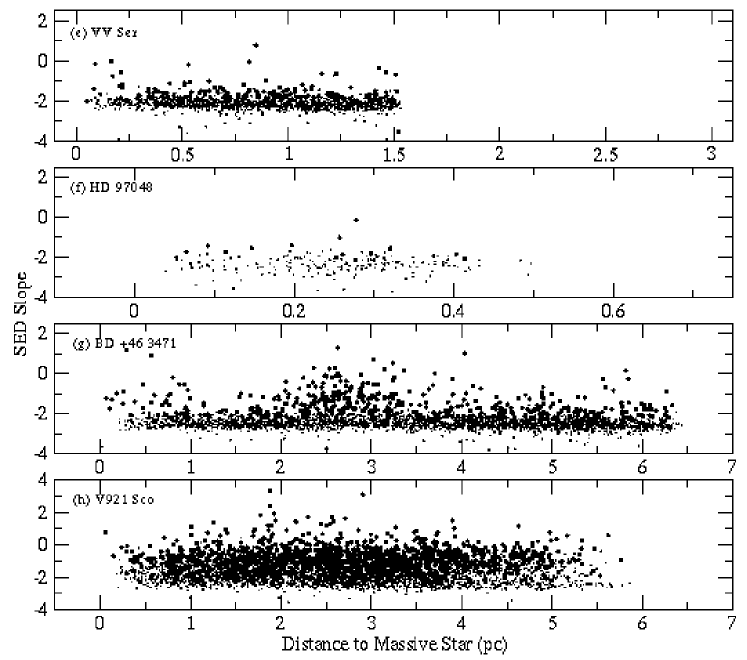
In order to investigate the relationship between massive stars and low mass young stars, we plot the SED slope of YSO candidates vs. radial distance from HAEBEs (Figure 8). The normal stars are also ploted as comparison. If the massive star truncates the circumstellar disks of its companions, stars closer to the massive star might reveal themselves earlier than they would normally. Therefore, these stars might look older than those further away, so there might be a correlation between the youthfulness (SED slope) and the distance to the massive stars. From Figure 8, we can see that there is a young population near the HAEBE star differing from the large-scale, uniform distribution, especially for BD40, VV Ser, and BD46. However, there is no obvious trend between the SED slope (youthfulness of young stars) and the distance from massive star. This suggests that at the scale of our study, the clustering of young stars dominates over the effect of massive stars on the low-mass stars. Indeed, the range showing the existence of proplyds in Orion is 0.3 pc (Vicente & Alves, 2005). Because Orion is a much more massive cluster than our sample, any similiar effect from HAEBEs would probably occur on scales much less than 0.3 pc. However, for our sample, within this range, there are typically 5 YSO candidates because of the resolution of Spitzer and the saturation of the HAEBEs, so it is unlikely to detect any effect from massive stars.
5.2 YSOs in Group vs. Isolation Within the Same Cloud
Although there is no obvious trend between the SED slope and the distance to HAEBE of the YSO candidates in groups, Figure 8 shows a possible age dispersion of YSO candidates throughout the molecular clouds, especially between inside and outside the group. Indeed, from Figure 8, the YSO candidates in groups around HAEBEs tend to have larger SED slopes than those outside. This means that there is an enhancement of not only number but also the youthfulness of YSOs within groups compared to those outside. Actually, this is not unexpected, especially for low mass clusters, which often show hierarchical structures within the natal molecular cloud. Previous observations of the giant molecular cloud, Lynds 1641, suggest that there exist not only aggregates of mainly low mass protostars, but also a distributed population of young stars throughout the whole cloud (e.g, Strom et al., 1993; Allen, 1995). Strom et al. (1993) found more young stars are within the aggregates than distributed. Allen (1995) found stars within the aggregates have average ages less than those distributed. In our sample, a similar picture to Lynds 1641 is seen. Allen (1995) suggested that this is because there is a constant star forming rate within the aggregates that constantly disperses forming stars outward, that produce those isolated young stars. Another explanation for isolated young stars outside the aggregates is that they formed isolated within the cloud initially so that the observational result is showing a primordial age dispersion throughout the cloud.
However, these results may be biased by the extinction, which would redden stars to make them seem younger, especially in the regions near the group center. According to the extinction estimation, extinction would affect the SED slopes by 1 at most with A 10. This is still less than the difference ( 2) of SED slopes between the majority of YSO candidates inside and outside the group. Therefore, we can conclude the deviation of SED slopes due to extinction is not significant so that there is indeed a trend showing YSOs in the groups are younger.
As a group of young stars can be defined using the surface number density ( from Figure 7), it can alternatively be defined by the aggregates on the age dispersion from Figure 8. They do not necessary have to be the same as the spatial distribution can be different from the age distribution of young stars. For example, assuming a single star forming epoch, if is smaller than the aggregates on the age dispersion, some stars formed together in the beginning may have escaped out of the boundary of clusters; on the contrary, if is larger than the aggregates on the age dispersion, the impact from massive stars may have dominated the inner region of clusters. Applying the estimated into Figure 8 shows that the sizes of the groups around HAEBEs based on Figure 8 are consistent with . This consistency may suggest that the escape of YSOs from the group is not yet significant for our sample. In other words, the primordial fragmentation of the molecular cloud may still dominate the young stellar population outside the group in our sample.
Again, there is a group of YSO candidates around the HAEBE younger than those outside the group, especially for , NGC 7129, VY Mon, VV Ser, , and . Possible explanations of this trend are: there is a higher star forming rate and continuous star formation within the group than outside the group (as suggested in the Lynds 1641 study, Allen, 1995), groups tend to form after isolated low mass stars because they need more time to collect enough material to initial the formation, or stars in group form slower than isolation due to the competition of material with group members that delay the collapse of clumps in the beginning. Similar studies are needed for massive clusters or low mass clusters for further investigation.
6 Conclusions
We present the NIR and MIR observations of eight embedded young stellar groups around Herbig Ae/Be stars (3-20 M at age a few Myrs) using the 2MASS point source catalog and the Spitzer archive. By using published infrared photometry data to obtain intrinsic colors of stars in the nearby cluster IC 348 and comparing to Taurus, we conclude that the color-color diagram of J - [3.6] vs. Ks - [4.5] is the most suitable tool to identify young stars for our sample. We do not use colors of [5.8] and [8.0] because of their intrinsic difficulties at nebulosity confusion and sensitivity. Moreover, YSO loci can be derived because all dereddened disk stars are located within narrow bands in the diagrams of J - [3.6] vs. Ks - [4.5] and H - [3.6] vs. Ks - [4.5]. These loci are useful to estimate the extinction of young stars.
With identified YSO candidates, we can study the cluster environment and cluster formation by examining their spatial distribution and infrared properties (such as SED slopes), compared with the position and mass of the HAEBEs. Some results are summarized as follows.
-
•
Six of the sources show bright diffuse emission at [8.0], which traces the dust illuminated by the HAEBEs. The other two are the lowest mass groups, VV Ser and HD 97048, which may not be energetic enough to illuminate the surroundings.
-
•
The HAEBEs are not always located at the center of the dust emission. is at the intersection of two branches of dust. VY Mon and NGC 7129 are at the edge of the dust nebulae. Others are located at the center of symmetric dust nebulae.
-
•
There are indeed young groups, containing 10-50 young stars, around HAEBEs to form a relatively isolated system separated from the other regions within the large-scale molecular cloud. The HAEBEs are always near the center of young stars.
-
•
The groups around HAEBEs seem to be the sub-structure of a large young population within the cloud. The sizes of groups based on the spatial population of young stars are similar to sub-cluster structures found in more massive clusters. Further comparison between these small groups and massive clusters are needed.
-
•
There is no obvious trend between SED slopes and the distance to the HAEBEs, that suggests that the effect of clustering on young stars dominates over the effect of massive stars, at the scale of our study.
-
•
Young stars in groups around HAEBEs tend to show larger SED slopes than those outside the groups. It suggests that young stars in groups are even younger than those outside. Some possible explanations are: (1) there is a higher star forming rate and a continuous star formation rate within the group than outside the group (2) massive stars form later than low mass stars within the large-scale molecular cloud, or (3) low mass stars in the group form slower than isolated ones due to the effect of clustering or the massive stars. Comparisons with more massive clusters are needed in the future.
References
- Adams & Myers (2001) Adams, F. C. & Myers, P. C. 2001, ApJ, 553, 744
- Adams et al. (2006) Adams, F. C., Proszkow, E. M., Fatuzzo, M., & Myers, P. C. 2006, ApJ, 641, 504
- Allen (1995) Allen, L. E. 1995, Ph.D. Thesis
- Allen et al. (2004) Allen, L. E., Calvet, N., D’Alessio, P., Merin, B., Hartmann, L., Megeath, S. T., Gutermuth, R. A., Muzerolle, J., Pipher, J. L., Myers, P. C., & Fazio, G. G. 2004, ApJS, 154, 363
- Allen et al. (2006) Allen, L. E., Megeath, S. T., Gutermuth, R. A., Myers, P. C., Wolk, S., Adams, F. C., Muzerolle, J., Young, Y., & Pipher, J. L. 2006, astro-ph/0603096
- Benjamin et al. (2003) Benjamin, R. A., Churchwell, E., Babler, B. L., Bania, T. M., Clemens, D. P., Cohen, M., Dickey, J. M., Indebetouw, R., Jackson, J. M., Kobulnicky, H. A., Lazarian, A., Marston, A. P., Mathis, J. S., Meade, M. R., Seager, S., Stolovy, S. R., Watson, C., Whitney, B. A., Wolff, M. J., & Wolfire, M. G. 2003, PASP, 115, 953
- Carpenter (2000) Carpenter, J. M. 2000, AJ, 120, 3139
- Caswell & Haynes (1987) Caswell, J. L. & Haynes, R. F. 1987, A&A, 171, 261
- Clarke et al. (2000) Clarke, C. J., Bonnell, I. A., & Hillenbrand, L. A. 2000, Protostars and Planets IV, 151
- Drew et al. (1997) Drew, J. E., Busfield, G., Hoare, M. G., Murdoch, K. A., Nixon, C. A., & Oudmaijer, R. D. 1997, MNRAS, 286, 538
- Edwards & Snell (1983) Edwards, S. & Snell, R. L. 1983, ApJ, 270, 605
- Elmegreen et al. (2000) Elmegreen, B. G., Efremov, Y., Pudritz, R. E., & Zinnecker, H. 2000, Protostars and Planets IV, 179
- Evans et al. (2003) Evans, II, N. J., Allen, L. E., Blake, G. A., Boogert, A. C. A., Bourke, T., Harvey, P. M., Kessler, J. E., Koerner, D. W., Lee, C. W., Mundy, L. G., Myers, P. C., Padgett, D. L., Pontoppidan, K., Sargent, A. I., Stapelfeldt, K. R., van Dishoeck, E. F., Young, C. H., & Young, K. E. 2003, PASP, 115, 965
- Fazio et al. (2004) Fazio, G. G., Hora, J. L., Allen, L. E., Ashby, M. L. N., Barmby, P., Deutsch, L. K., Huang, J.-S., Kleiner, S., Marengo, M., Megeath, S. T., Melnick, G. J., Pahre, M. A., Patten, B. M., Polizotti, J., Smith, H. A., Taylor, R. S., Wang, Z., Willner, S. P., Hoffmann, W. F., Pipher, J. L., Forrest, W. J., McMurty, C. W., McCreight, C. R., McKelvey, M. E., McMurray, R. E., Koch, D. G., Moseley, S. H., Arendt, R. G., Mentzell, J. E., Marx, C. T., Losch, P., Mayman, P., Eichhorn, W., Krebs, D., Jhabvala, M., Gezari, D. Y., Fixsen, D. J., Flores, J., Shakoorzadeh, K., Jungo, R., Hakun, C., Workman, L., Karpati, G., Kichak, R., Whitley, R., Mann, S., Tollestrup, E. V., Eisenhardt, P., Stern, D., Gorjian, V., Bhattacharya, B., Carey, S., Nelson, B. O., Glaccum, W. J., Lacy, M., Lowrance, P. J., Laine, S., Reach, W. T., Stauffer, J. A., Surace, J. A., Wilson, G., Wright, E. L., Hoffman, A., Domingo, G., & Cohen, M. 2004, ApJS, 154, 10
- Fuente et al. (2002) Fuente, A., Martın-Pintado, J., Bachiller, R., Rodrıguez-Franco, A., & Palla, F. 2002, A&A, 387, 977
- Fuente et al. (2001) Fuente, A., Neri, R., Martín-Pintado, J., Bachiller, R., Rodríguez-Franco, A., & Palla, F. 2001, A&A, 366, 873
- Gutermuth et al. (2004) Gutermuth, R. A., Megeath, S. T., Muzerolle, J., Allen, L. E., Pipher, J. L., Myers, P. C., & Fazio, G. G. 2004, ApJS, 154, 374
- Habart et al. (2003) Habart, E., Testi, L., Natta, A., & Vanzi, L. 2003, A&A, 400, 575
- Hartmann et al. (2005) Hartmann, L., Megeath, S. T., Allen, L., Luhman, K., Calvet, N., D’Alessio, P., Franco-Hernandez, R., & Fazio, G. 2005, ApJ, 629, 881
- Harvey et al. (2006) Harvey, P. M., Chapman, N., Lai, S.-P., Evans, II, N. J., Allen, L. E., Jørgensen, J. K., Mundy, L. G., Huard, T. L., Porras, A., Cieza, L., Myers, P. C., Merín, B., van Dishoeck, E. F., Young, K. E., Spiesman, W., Blake, G. A., Koerner, D. W., Padgett, D. L., Sargent, A. I., & Stapelfeldt, K. R. 2006, ApJ, 644, 307
- Harvey et al. (1984) Harvey, P. M., Wilking, B. A., & Joy, M. 1984, ApJ, 278, 156
- Herbig (1960) Herbig, G. H. 1960, ApJS, 4, 337
- Herbig & Dahm (2002) Herbig, G. H. & Dahm, S. E. 2002, AJ, 123, 304
- Hillenbrand et al. (1995) Hillenbrand, L. A., Meyer, M. R., Strom, S. E., & Skrutskie, M. F. 1995, AJ, 109, 280
- Hillenbrand et al. (1992) Hillenbrand, L. A., Strom, S. E., Vrba, F. J., & Keene, J. 1992, ApJ, 397, 613
- Indebetouw et al. (2005) Indebetouw, R., Mathis, J. S., Babler, B. L., Meade, M. R., Watson, C., Whitney, B. A., Wolff, M. J., Wolfire, M. G., Cohen, M., Bania, T. M., Benjamin, R. A., Clemens, D. P., Dickey, J. M., Jackson, J. M., Kobulnicky, H. A., Marston, A. P., Mercer, E. P., Stauffer, J. R., Stolovy, S. R., & Churchwell, E. 2005, ApJ, 619, 931
- Lada & Lada (2003) Lada, C. J. & Lada, E. A. 2003, ARA&A, 41, 57
- Lada et al. (2006) Lada, C. J., Muench, A. A., Luhman, K. L., Allen, L., Hartmann, L., Megeath, T., Myers, P., Fazio, G., Wood, K., Muzerolle, J., Rieke, G., Siegler, N., & Young, E. 2006, AJ, 131, 1574
- Looney et al. (2006a) Looney, L. W., Tobin, J. J., & Fields, B. D. 2006a, ApJ, 652, 100
- Looney et al. (2006b) Looney, L. W., Wang, S., Hamidouche, M., Safier, P. N., & Klein, R. 2006b, ApJ, 642, 330
- Luhman et al. (2003) Luhman, K. L., Stauffer, J. R., Muench, A. A., Rieke, G. H., Lada, E. A., Bouvier, J., & Lada, C. J. 2003, ApJ, 593, 1093
- Megeath et al. (2004) Megeath, S. T., Allen, L. E., Gutermuth, R. A., Pipher, J. L., Myers, P. C., Calvet, N., Hartmann, L., Muzerolle, J., & Fazio, G. G. 2004, ApJS, 154, 367
- Meyer et al. (2000) Meyer, M. R., Adams, F. C., Hillenbrand, L. A., Carpenter, J. M., & Larson, R. B. 2000, Protostars and Planets IV, 121
- Meyer et al. (1997) Meyer, M. R., Calvet, N., & Hillenbrand, L. A. 1997, AJ, 114, 288
- Morris et al. (2004) Morris, P. W., Noriega-Crespo, A., Marleau, F. R., Teplitz, H. I., Uchida, K. I., & Armus, L. 2004, ApJS, 154, 339
- Muench et al. (2003) Muench, A. A., Lada, E. A., Lada, C. J., Elston, R. J., Alves, J. F., Horrobin, M., Huard, T. H., Levine, J. L., Raines, S. N., & Román-Zúñiga, C. 2003, AJ, 125, 2029
- Palla et al. (1995) Palla, F., Testi, L., Hunter, T. R., Taylor, G. B., Prusti, T., Felli, M., Natta, A., & Stanga, R. M. 1995, A&A, 293, 521
- Pfalzner et al. (2006) Pfalzner, S., Olczak, C., & Eckart, A. 2006, astro-ph/0604018
- Rho et al. (2006) Rho, J., Reach, W. T., Lefloch, B., & Fazio, G. G. 2006, ApJ, 643, 965
- Ridge et al. (2003) Ridge, N. A., Wilson, T. L., Megeath, S. T., Allen, L. E., & Myers, P. C. 2003, AJ, 126, 286
- Rieke & Lebofsky (1985) Rieke, G. H. & Lebofsky, M. J. 1985, ApJ, 288, 618
- Shu et al. (1987) Shu, F. H., Adams, F. C., & Lizano, S. 1987, ARA&A, 25, 23
- Skrutskie et al. (2006) Skrutskie, M. F., Cutri, R. M., Stiening, R., Weinberg, M. D., Schneider, S., Carpenter, J. M., Beichman, C., Capps, R., Chester, T., Elias, J., Huchra, J., Liebert, J., Lonsdale, C., Monet, D. G., Price, S., Seitzer, P., Jarrett, T., Kirkpatrick, J. D., Gizis, J. E., Howard, E., Evans, T., Fowler, J., Fullmer, L., Hurt, R., Light, R., Kopan, E. L., Marsh, K. A., McCallon, H. L., Tam, R., Van Dyk, S., & Wheelock, S. 2006, AJ, 131, 1163
- Störzer & Hollenbach (1999) Störzer, H. & Hollenbach, D. 1999, ApJ, 515, 669
- Strom et al. (1993) Strom, K. M., Strom, S. E., & Merrill, K. M. 1993, ApJ, 412, 233
- Surace et al. (2004) Surace, J. A., Shupe, D. L., Fang, F., Lonsdale, C. J., Gonzalez-Solares, E., Baddedge, T., Frayer, D., Evans, T., Jarrett, T., Padgett, D. L., Castro, S., Masci, F., Domingue, D., Fox, M., Rowan-Robinson, M., Perez-Fournon, I., Olivier, S., Poletta, M., Berta, S., Rodighiero, G., Vaccari, M., Stacey, G., Hatziminaoglou, E., Farrah, D., Siana, B., Smith, H. E., Franceschini, A., Owen, F., Pierre, M., Xu, C., Afonso-Luis, A., Davoodi, P., Dole, H., Pozzi, F., Salaman, M., & Waddington, I. 2004, VizieR Online Data Catalog, 2255, 0
- Testi et al. (1998) Testi, L., Palla, F., & Natta, A. 1998, A&AS, 133, 81
- Vicente & Alves (2005) Vicente, S. M. & Alves, J. 2005, A&A, 441, 195
- Wang & Looney (2007) Wang, S. & Looney, L. W. 2007, in prep.
- Wilking et al. (1989) Wilking, B. A., Lada, C. J., & Young, E. T. 1989, ApJ, 340, 823
| TargetaaName of the cluster system used here. | Distance | MassivebbMassive stars that are included within the same cluster system or within the same molecular cloud. | RA. | Dec. | M | Spectral | Age | Refs. |
|---|---|---|---|---|---|---|---|---|
| (kpc) | Star | (2000) | (2000) | (M⊙) | Type | (Myrs) | ||
| BD40 | 1.00 | 20 20 28.25 | +41 21 51.3 | 13.0 | B2e | 0.06 | 1,2 | |
| V1686 Cyg | 20 20 29.34 | +41 21 27.6 | 4.5 | B5e | 0.6 | 1,2 | ||
| V1318 Cyg-S | 20 20 30.56 | +41 21 25.4 | - | mid A-Fe | 0.6 | 1,2 | ||
| NGC 7129 | 1.00 | 21 42 50.18 | +66 06 35.2 | 9.2 | B3e | - | 1 | |
| LkHa 234 | 21 43 06.68 | +66 06 54.6 | 8.5 | B3e | 0.1 | 1 | ||
| 21 43 | +66 06 | - | B2 | - | 3 | |||
| MWC 297 | 0.45 | MWC 297 | 18 27 39.60 | -03 49 52.0 | 26.5 | O9e | 0.1-1.0 | 1,4 |
| VY Mon | 0.80 | VY Mon | 06 31 06.94 | +10 26 05.0 | - | B8e | 0.1 | 4 |
| VV Ser | 0.44 | VV Ser | 18 28 47.86 | +00 08 40.0 | 3.3 | B9e | 0.6 | 1,4 |
| HD 97048 | 0.16 | HD 97048 | 11 08 03.32 | -77 39 17.5 | 3.4 | A0e | 5.0 | 1,4 |
| BD46 | 0.90 | 21 52 34.10 | +47 13 43.6 | 7.3 | A0e | 0.1-0.3 | 1,5 | |
| 21 53 28.85 | +47 15 59.9 | - | B0 | 1.0 | 5 | |||
| V921 Sco | 0.8 | V921 Sco | 16 59 06.78 | -42 42 08.4 | - | B0e | 0.1-1.0 | 4 |
| GAL343.49-00.03 | 16 59 23.30 | -42 33 55.0 | - | - | - | 6 |
| Target | Program ID. | Exp. Time | No. of Frames | FOVaaFinal field of view of the data set used for each source. | Refs. |
|---|---|---|---|---|---|
| (Sec. / Frame) | () () | ||||
| BD40 | 6 | 10.4 | 4 | 12.4 14.5 | 1 |
| NGC 7129 | 6 | 10.4 | 4 | 12.4 14.0 | 1 |
| MWC 297 | 6 | 10.4 | 3 | 12.6 14.5 | 1 |
| VY Mon | 6 | 10.4 | 4 | 12.4 14.5 | 1 |
| VV Ser | 174 | 10.4 | 2 | 08.6 23.4 | 2 |
| HD 97048 | 36 | 96.8 | 10 | 13.0 15.0 | 3 |
| BD46 | 6 | 10.4 | 2 | 26.4 28.0 | 1 |
| V921 Sco | 192 | 1.2 | 2 | 19.5 37.8 | 4 |
| Target | J | H | Ks | [3.6]aaThe lower limits at magnitude when the uncertainty criterion is 0.05 mag. | [4.5]aaThe lower limits at magnitude when the uncertainty criterion is 0.05 mag. | [5.8]aaThe lower limits at magnitude when the uncertainty criterion is 0.05 mag. | [8.0]aaThe lower limits at magnitude when the uncertainty criterion is 0.05 mag. | Spectral TypebbThe spectral type of the dimest detected YSO candidates, estimated based on [4.5] from Figure 3. |
|---|---|---|---|---|---|---|---|---|
| BD40 | 17.00 | 15.85 | 15.95 | 15.11 | 15.06 | 13.20 | 12.37 | M4 |
| NGC 7129 | 16.99 | 16.09 | 16.99 | 15.62 | 15.72 | 14.00 | 12.88 | M4 |
| MWC 297 | 16.99 | 16.13 | 15.51 | 14.68 | 14.60 | 13.59 | 12.34 | M5 |
| VY Mon | 16.87 | 15.84 | 14.99 | 13.98 | 13.53 | 13.43 | 12.53 | M4 |
| VV Ser | 16.97 | 16.06 | 16.66 | 15.21 | 15.16 | 13.24 | 12.32 | M6 |
| HD 97048 | 16.73 | 16.08 | 15.10 | 14.89 | 14.17 | 14.09 | 13.83 | M9 |
| BD46 | 16.97 | 16.28 | 16.78 | 15.72 | 15.76 | 13.44 | 12.46 | M5 |
| V921 Sco | 16.00 | 15.34 | 14.95 | 13.31 | 12.73 | 11.11 | 10.29 | M2 |
| Target | Num. of YSOs | Num. of YSOsaaNumber of YSO candidates within . | bbThe radius calculated by pc (Adams et al., 2006), where is the radius and is the number of YSOs within the groups. | ||
|---|---|---|---|---|---|
| (whole field) | (in groups) | (pc) | (pc) | (pc) | |
| BD40 | 134 | 74 | 0.9 | 1.5ccThis value actually includes the two branch of dense dust around this system, which is overestimated for the group itself. | 0.6 |
| NGC 7129 | 106 | 53 | 0.7 | 1.0 | 1.0 |
| MWC 297 | 92 | 24 | 0.5 | 0.6 | 0.5 |
| VY Mon | 42 | 26 | 0.5 | 0.8 | 0.75 |
| VV Ser | 148 | 22 | 0.5 | 0.4 | 0.5 |
| HD 97048 | 16 | 10 | - | - | - |
| 500 | 10 | - | - | 1.3ddIt actually includes two separated nearby small groups of YSO candidates. | |
| 500 | 238 | 1.5 | 2.4 | 1.5 | |
| V921 Sco | 1271 | 33 | 0.6 | 0.7 | - |
| GAL343.49-00.03 | 1271 | 160 | 1.3 | 1.2 | - |