Astronomy Department of Bologna University, Bologna, Italy Sternberg Astronomical Institute of Moscow State University, Moscow, Russia Special Astrophysical Observatory of Russian Academy of Sciences, Russia \PACSes \PACSit95.55.CsGround-based ultraviolet, optical and infrared telescopes \PACSit98.70.RzGamma-ray sources; Gamma-ray bursts
GRBs with optical afterglow and known redshift: a statistical study
Abstract
We present a correlation between two intrinsic parameters of GRB optical afterglows. These are the isotropic luminosity at the maximum of the light curve () and the time-integrated isotropic energy () radiated after the observed maximum. We test the correlation between the logarithms of () and () and finally we value the effect of the different samples of GRBs in according with the first optical observation reduced to proper time.
We analized the -band afterglow light curves of 63 long-duration GRBs/XRFs detected during the time period from February 1997 to October 2006. We obtained a sample with 42 GRBs/XRFs in which the light curves are generally well-sampled until detection of optical afterglow in the host galaxy system, the redshifts of all bursts are measured and the estimates of the optical extinction in the source frame are available. The photometric data of optical afterglow light curves, as well as the values of the redshift, the host magnitude, the spectral slope () and the intrinsic extinction (), were compiled by publications and GCN. Before performing a statistical analysis, the observational data were corrected for extinction (both Galactic and intrinsic) and the flux contribution from the host galaxy was subtracted. Then we converted the magnitudes to fluxes using the normalization given by [1]. To avoid an influence of any model assumptions about the light curve shapes (i.e. re-brightening episodes, jet-breaks) we decided to integrate them numerically by means of trapezoids, without the need to extrapolate the flux to some epoch. Finally the GRB sample was divided into four distinct sub-samples in according with the first optical detection () in the rest frame of the source. The series of temporal ranges , the Pearson correlation coefficients (), the slopes (), and the number of the GRBs/XRFs in the different sub-samples () are given in Table I.

1cmll—c—c—c
Sample features
completed sample 1.43 0.13 0.87 42
(i) 1.08 0.11 0.97 5
(ii) 1.02 0.14 0.96 6
(iii) 0.99 0.08 0.96 13
(iv) 1.04 0.08 0.95 18
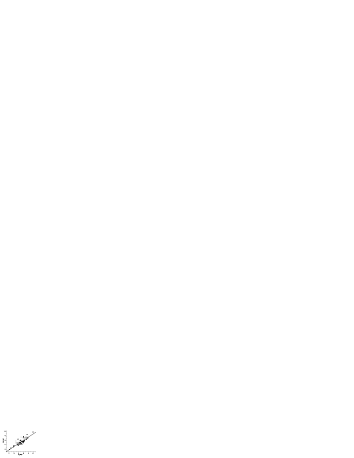
The previous approach reduces the scatter of the data points around the correlation. For the bursts whose () and () are not available yet (marked by open circles in fig. 1) we assumed = 1 and = 0. We did not utilize them for the estimate of the correlation parameters given in table I. Detected correlation for 42 GRBs/XRFs confirms our previous results for 22 ones [2]. We believe using this phenomenological relationship will enable us to constrain the values of the absorption in host galaxy system and the energetic ratios among the different physical processes involved in the observed optical light curves. Because of the small size of this sample, however, this conclusion is tentative. Future observations will provide a larger and less biased sample to test the - correlation in optical range.
Acknowledgements.
This work was supported by grants of RFBR (No. 04-02-17555), Bologna University (Progetti Pluriennali 2003)References
- [1] \BYFukugita, M., et al \INPASP1071995945F
- [2] \BYBartolini, C., et al \INGamma-Ray Bursts in the Afterglow Era: Proc. of the Internat. Workshop Held in Rome. ESO Ap. Symp. Springer12001151B