On a synthetical method to constrain 3-D structure of emission regions of pulsars
Abstract
The main idea and procedure are presented for a new synthetical method on constraining 3-D structure of emission regions of pulsars. With this method the emission regions can be synthetically constrained by fitting multi-wavelength observations features, e.g. pulse widths, phase offsets between radio pulse profiles and high energy light curves, and radio polarization properties. The main technique is based on numerically calculating the emission directions along any open field line via including aberration and retardation effects under a certain magnetic field configuration, e.g. vacuum dipole field. It can be easily extended by involving some further effects or magnetic field line configuration. The role of observed linear polarization properties in the method is discussed. The future application to known X/gamma-ray and radio pulsars will be helpful to test and improve current theoretical models on pulsar emission.
1 Introduction
Although pulsars have been studied for 40 years, the structures of radio and gamma-ray emission regions of pulsars remain controversial. It is known that radio emission heights are usually less than 10% light cylinder radius for normal pulsars (e.g. Cordes 1978, Ranin 1990, Blaskiewicz et al. 1991, Kijak & Gil 1997), but the trans-field structure of radio emission regions, both in polar or azimuthal directions, were not well identified from observations in literature.
Finding out the structure of emission regions is helpful to the study on some theoretical issues, e.g. the structure of radio emission beam and origin of gamma-ray emission. To explain various kinds of radio average pulse profiles, some authors proposed that radio beam is composed of conal and core sub-beams (e.g. Rankin 1983, Gil & Krawczyk 1996), while some others suggested that radio beam is just composed of randomly distributed sources (Manchester 1995, Han & Manchester 2001). Since emission beam is formed by radiation of particles from flux tubes in emission region, the structure of beam is related to the structure of emission region. Therefore, it is not clear yet whether the radio emission region is composed of conal and core-like flux tubes or randomly distributed flux tubes. The controversy for the origin of gamma-rays remains in different models, i.e. the slot gap model (e.g. Muslimov & Harding 2004), the outer gap model (Cheng et al. 2000, Hirotani & Shibata 1999) and the annular gap model (Qiao et al. 2004). These models suggest different kind of particle accelerators and different gamma-ray emission regions. Therefore, determining the 3-D structure of emission regions from observation is necessary to test and improve pulsar emission models.
We are developing a synthetical method to constrain the emission regions from observational properties. The main technique is numerical calculation for the emission directions along any open field line by including aberration and retardation effects under a certain magnetic field configuration, e.g. vacuum dipole field. In this paper we focus on its main idea and some remaining problems.
2 The new synthetical Method
2.1 The main idea and procedure
The method uses three basic assumptions. (1) In the co-rotation reference frame, the emission direction is assumed to be along the tangent of magnetic field line. The solid angle of emission cone of a relativistic particle is neglected for the purpose of simplifying calculation. (2) The emission patterns are the same at two opposite poles. (3) Vacuum rotating dipolar field is adopted. In the Cartesian coordinate system of which the rotating axis is -axis and -axis locates on the meridian plane, the Cartesian components of the magnetic field vector at any point P() are as follows (Cheng et al. 2000)
| (1) | |||||
where is the magnetic moment of the pulsar, is stellar radius, is the emission radius from stellar center to P, , is the radius of light cylinder, is inclination angle between rotation and magnetic axes.
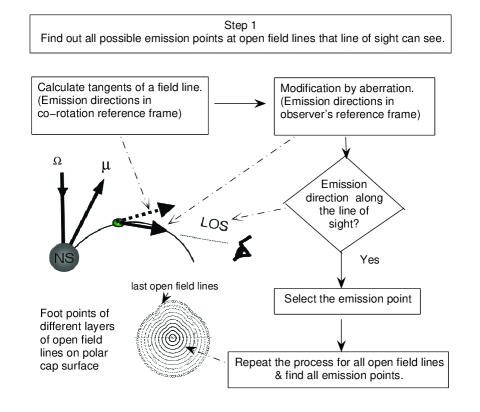
The method runs in two steps as shown schematically in Fig. 1. Step 1, determine geometrical parameters of the pulsar and find out all emission points that can be viewed by our line of sight (hereafter LOS). To perform the calculation, the whole open volume is divided into a number of layers from the last open field lines to the magnetic axis (see Fig. 1 for the shape of foot points of the field lines in each layer on polar cap). (1) Determine or constrain the values of and , where is the viewing angle between line of sight and rotation axis. Definite values of and will greatly reduce calculation. For simplification one can use the values that are obtained by fitting the observed position angle (PA) of linear polarization with rotation vector model (hereafter RVM, Radhakrishnan & Cooke 1969). But strictly to say they should be figured out consistently with the method, because aberration, retardation and non-static dipole field configuration all influence position angle. (2) Calculate tangents of field lines and then modify emission direction by involving aberration effect. To do the modification the initial emission direction (tangential to field line) in the co-rotation reference frame is converted to the direction in laboratory reference frame via Lorentz transform. (3) Select all the emission points where the emission direction is aligned with our LOS.
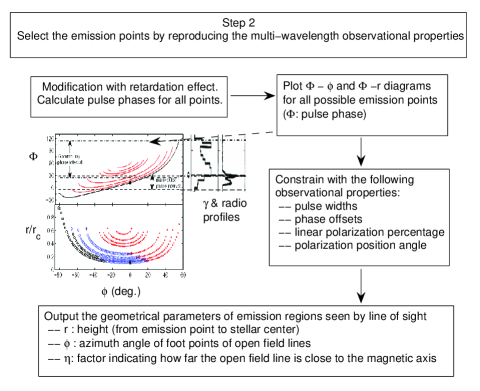
Step 2, find out the emission points that contribute to emission by fitting the observed multi-wavelength properties. The way to do this is based on diagram, in which the curves for different layers of field lines are plotted, where is the pulse longitude of the emission from a point on a field line and is azimuthal angle of the foot point of the field line. After figuring out the diagram, one can place the observed multi-wavelength pulse windows on the diagram, and then finds out which field lines may contribute to the pulse (see lower panel in Fig.1). In some cases linear polarization percentage may provides further constraints on the emission region. The role of polarization properties in this method is discussed in next section.
For a typical pulsar that has radio and high energy emission the observed properties used include (a) the radio and high-energy pulse widths, (b) the phase separation between radio main pulse and inter-pulse (in the case that inter-pulse is observed), (c) the phase offset between radio and high energy pulses, (d) radio polarization properties, viz. linear polarization percentage and PA sweep, (e) viewing angle determined from the elliptical shape of torus or rings in nebula for some pulsars, e.g the Crab and Vela pulsars.
2.2 Comparison with conventional methods
Comparing with conventional geometrical and relativistic models to constrain emission altitudes, our new method has three advantages. (1) It can apply to high emission altitudes and complex magnetic field configuration. (2) It can reveal asymmetrical structure of emission regions. (3) It is more synthetical. Details are as follows.
Geometrical methods (Rankin 1990, Kijak & Gil 1997, Wu et al. 2002) and relativistic methods (Blaskiewicz et al. 1991, Dyks et al. 2004, Gangadhara 2005) are two main conventional approaches to constrain the radio emission heights. In geometrical methods geometry relations of emission beam and pure dipole field are used, while in relativistic model the phase-delay-to-radius relation is used by considering the aberration and retardation effects in static dipolar field. But geometrical relations and approximations of aberration and retardation effects are only valid when emission heights are not too large. However, in numerical method such limitation vanishes, because reduction of aberration and retardation effects in complex field line configuration can be easily done by vector operations. Therefore, numerical method can be used to constrain the gamma-ray emission region and radio emission region of some young pulsars where the emission height may be close to light cylinder.
A common feature of conventional geometrical and relativistic methods is that the emission region is assumed to be symmetrical with respect to the meridian that contains the rotation and magnetic axes. However, the effects of aberration, retardation and sweeping back of magnetic fields probably make the emission region seen by LOS asymmetrical to the meridian. In our method the assumptions are relaxed, so that asymmetrical properties of emission regions may be revealed.
From intuition, more information may be revealed by constraining emission regions synthetically with multi-wavelength emission properties than with only radio or gamma-ray properties. It has been shown that some interesting results can be obtained for radio and gamma-ray emission regions of PSR B1055-52 by synthetically reproducing the radio and gamma-ray properties, even with a modified geometrical method (Wang et al. 2006). The new synthetical method is hopeful to go further.
3 Discussion
Besides the pulse width and phase offsets, linear polarization is another key factor in this synthetical method. What results one finally gets depend on how to use the polarization data. The polarization can be used in two ways. First, the PA data should be self-consistently fitted with the method to solve or constrain , and the range of layers of open field lines. For some pulsars with nebulae, e.g. the Crab and Vela pulsars, the viewing angle can be determined from the torus and ring-like structure near pulsar. In this case the uncertainty in geometry is much reduced. Second, linear polarization percentage (hereafter LPP) can be used to constrain the polar and azimuthal scales of emission region. (1) In the cases of nearly 100% LPP, the emission region should be limited within a thin layer of flux tube, otherwise the superposition of radio waves from different layers, which have different PAs, may cause significant depolarization. (2) In the case that LPP is much less than 100%, it can not be simply concluded that the emission region is thick in polar scale, because depolarization may be caused by either superposition of emissions with scattered PAs or superposition of orthogonal modes (Stinebring et al. 1984). Detailed studies on PA distribution of single pulses may be helpful to distinguish them.
A realistic magnetic field is different from the vacuum rotating dipole field. Both magnetospheric current and general relativistic effect can influence the field configuration. It would be interesting to test how the constrained results depends on field configuration.
Our future work includes constraining (1) gamma-ray, X-ray and radio emission regions of gamma-ray pulsars, (2) X-ray and radio emission regions for X-ray pulsars, (3) radio emission regions for radio pulsars with high linear polarized percentage and good-quality data of position angle.
Acknowledgements.
We are grateful to R.N. Manchester for his valuable discussion. This work is supported by NSF of China (10373002, 10403001, 10573002)References
- [1] Blaskiewicz M., Cordes J.M., Wasserman I., 1991, ApJ 370, 643
- [2] Cheng K.S., Ruderman M.A. & Zhang L., 2000, ApJ 537, 964
- [3] Cordes J.M., 1978, ApJ, 222, 100
- [4] Dyks J., Rudak B. & Harding A.K., 2004, ApJ 607, 939
- [5] Gangadhara R. T., 2005, ApJ 628, 923
- [6] Gil J. & Krawczyk A., 1996, MNRAS 280, 143
- [7] Han J.L. & Manchester R.N., 2001, MNRAS 320, L35
- [8] Hirotani K. & Shibata S., 1999, MNRAS 308, 54
- [9] Kijak J. & Gil J.A., 1997, MNRAS 288, 631
- [10] Manchester R.N., 1995, JA&A 16, 107
- [11] Muslimov A.G. & Harding A.K., 2004, ApJ 606, 1143
- [12] Qiao G.J., Lee K.J., Wang H.G., Xu R.X. & Han J.L., 2004, ApJ 606, L49
- [13] Radhakrishnan V. & Cooke D.J., 1969, Astrophys. Lett. 3, 225
- [14] Rankin J.M., 1983, ApJ 274, 333
- [15] Rankin J.M., 1990, ApJ 352, 247
- [16] Stinebring D.R., Cordes J.M., Rankin J.M. et al., 1984, ApJS 55, 247
- [17] Wang H.G., Qiao G.J., Xu R.X. & Liu Y., 2006, MNRAS 366, 945
- [18] Wu X.J., Huang Z.K. & Xu X.B., 2002, ChJAA 2, 454