H i 21 cm emission as a tracer of gas during the evolution from protoplanetary to debris disks
Abstract
We present models for the HI 21 cm emission from circumstellar disks and use them to convert observed upper limits on the H i 21 cm flux to limits on the total disk gas mass. The upper limits we use come from earlier Australia Telescope Compact Array observations of the debris disk around Pictoris as well as fresh Giant Meterwave Radio Telescope observations of HD 135344, LkCal15 and HD 163296. Our observations and models span a range of disk types, from young proto-planetary disks to old debris disks. The models self-consistently calculate the gas chemistry (H/H2 balance) and the thermal structure of UV irradiated disks. Atomic hydrogen production is dominated by UV irradiation in transition phase objects as well as debris disks, but for very young disks, HI production by stellar X-rays (which we do not account for) is important. We use a simple radiative transfer approach to convert the model disk parameters into predicted H i 21 cm line maps and spectral profiles. This allows a direct comparison of the observations to the model. We find that the H i traces the disk surface layers, and that the H i emission, if detected, could be used to study the effects of irradiation and evaporation, in addition to the kinematics of the disk. Our models cover massive protoplanetary disks, transition phase disks and dusty debris disks. In massive protoplanetary disks, UV produced H i constitutes less than 0.5% of the total disk mass, while X-rays clearly dominate the chemistry and thus the H i production. For the two such disks that we have observed, viz. those around LkCa 15 and HD 163296, the predicted 21 cm flux is below the current detection limit. On the other hand, transition phase disks at distances of 100 pc have predicted 21 cm fluxes that are close to the detection limit. Finally, in debris disks, hydrogen is mainly molecular since the high dust-to-gas mass ratio leads to warmer disks, thus increasing the formation rate of H2. This, in conjunction with the small total gas mass, makes the predicted flux to fall below our detection limit. However, future telescopes like the SKA should be able to image the H i 21 cm emission from nearby transition phase disks, while a radio telescope with only the area of the SKA should be able to detect the emission from such disks. Such 21 cm line observations would probe both disk evaporation as well as disk kinematics.
1 Introduction
Protoplanetary disk evolution and planet formation are closely intertwined. To understand planet formation, we first need to develop a comprehensive picture of the physical and chemical conditions in protoplanetary disks. While dust has been observed over the entire range of disk evolution — from the very young massive disks out to the old debris disks that contain only a few lunar masses of small dust grains —, gas is much more difficult to detect. Hence our picture of the chemical evolution of the gas phase is very incomplete and mainly restricted to a few prototypes. This is unfortunate, because gas plays an important role in the disk physics. It determines the hydrostatic equilibrium in the early phases, it affects the dust grain growth and dynamics as well as planet migration, and eventually its dispersal ends the planet formation process.
Hydrogen is the most abundant element in molecular clouds and in the protoplanetary disks that are a byproduct of the star formation process. Most of the disk mass is in the form of either atomic or molecular hydrogen. Depending on the number of photons capable of ionizing hydrogen (i.e. photons with energies larger than 13.6 eV), there will be a low density layer of ionized hydrogen at the surface of the disks. In the following, we ignore this layer as its contribution to the disk mass is negligible. Underneath this H ii layer, there will be a layer dominated by far ultraviolet photons from the star where hydrogen is mostly neutral. As the optical depth becomes large enough to shield this radiation, molecular hydrogen dominates. Even though molecular hydrogen dominates the disk mass in early phases of disk evolution, it is difficult to detect; due to the lack of dipole transitions, its ro-vibrational lines are very weak and the line-to-continuum ratio in the near-IR limits the sensitivity. Atomic hydrogen has electronic transitions, which need typical excitation temperatures in excess of 5000 K and therefore originate only in the surface layers very close to the central star, where the gas can be that hot. In this paper we study the role of the H i 21 cm line — a hyperfine transition of atomic hydrogen — for detecting the gas in various evolutionary stages of protoplanetary disks.
The H i line could be an important tool to study the surface layers of young protoplanetary disks. By simultaneous observations of the H i 21 cm line and ro-vibrational lines of molecular hydrogen, we can observationally determine the H i/H2 fraction and compare it to predictions from disk models. This constrains both the photochemistry in the disk surface and the strength of the dissociating stellar (and surrounding) radiation field. The H i line is also a very important tool in tracing disk dispersal and in particular photoevaporation processes. Hollenbach & Gorti (2006) have proposed that the FUV photoevaporation from the star itself is one of the main processes of disk dispersal. The FUV radiation can penetrate much deeper into the disk than the EUV radiation and it heats the gas up to temperatures of a few 100 K. Adams et al. (2004) have shown that photoevaporation can already start at temperatures much lower than the virial temperature, . The critical temperature is given by
| (1) |
where G is the gravitational constant, the stellar mass, the mass of an hydrogen atom, the Boltzmann constant and the radial distance from the star. Typical values for are in the range of 180 to 10 000 K for our T Tauri disk models. This means, that the FUV radiation field can drive a photoevaporative wind from layers much deeper in the disk than the EUV and hence this wind would be more massive than the EUV wind and dominate the mass loss of the disk. H i observations could thus be used to trace this mass loss and to derive photoevaporation rates, which can be compared to the theory.
The rest of this paper is organised as follows. The Australia Telescope National Facility (ATNF) and the Giant Meterwave Radio Telescope (GMRT) H i 21 cm line observations are described in Sect. 2. In Sect. 3 we derive approximate estimates of the fraction of atomic hydrogen in circumstellar disks at different stages of evolution. Detailed models of each evolutionary stage ranging from protoplanetary disks to debris disks are presented in Sect. 4 while in Sect. 5 we outline the details of the H i 21 cm line radiative transfer. In Sect 6 we compare the model predictions with the observations, and finally in Sect. 7 we assess the prospects of using future radio telescopes to observe H i 21 cm line emission to trace gas in circumstellar disks at various evolutionary stages.
2 Observations
Atomic hydrogen 21 cm line emission has never been detected in circumstellar disks. The only case for which upper limits are available in the literature is Pictoris, which has been observed at ATCA by Freudling et al. (1995, F95). This program was set up as a pilot survey. Our sample was hence selected to include disks from which HI was likely to be detectable (based on the presence of detectable amounts of molecular gas), while at the same time trying to cover a wide range of stellar and disk types.
We have carried out 21 cm line observations of the disks around HD 135344, LkCa15 and HD 163296 at the Giant Metrewave Radio Telescope operated by the National Centre for Radio Astrophysics, India. The stellar and disk classification and properties are summarized in Table 1. The observations were conducted on August 29 and 30, 2004. The total integration time on each source was 4 hours. We used a 1 MHz bandpass with 128 channels, which results in a channel width of 1.6 km/sec. The standard calibrators 3C 232 and 3C 286 were observed at the start and end of the observing run and used to calibrate the visibility amplitudes and the bandpass shape. Phase calibration was carried out with continuum sources 1522-275, 0431+206 and 1751-253 for HD 135344, LkCa15 and HD 163296, respectively. For each disk, separate maps were produced at angular resolutions of 2”3” and 7”9” using appropriate UV ranges and tapers. The spectra at the position of the disks were in each case closely inspected for any signs of H i emission. Finally, all spectra were also smoothed with a 3 channel boxcar function. No evidence of any line emission was found in either the smoothed or unsmoothed spectra. One upper limits are listed in Table 2.
| star | classification | d | i | Teff | R∗ | M∗ | Mdisk(1.3mm) | Mdisk(CO) | LX |
|---|---|---|---|---|---|---|---|---|---|
| [pc] | [∘] | [K] | [R⊙] | [M⊙] | M⊙ | M⊙ | [erg s-1] | ||
| Pictoris | A5V debris disk | 19.31 | 06 | 82001 | 1.471 | 1.751 | 0.0034 | … | 7 |
| HD163296 | A1Ve pre-MS | 1222 | 653 | 92302 | 2.72 | 2.43 | 6.54 | 0.0564 | 8 |
| HD135344 | F4Ve pre-MS | 842 | 603 | 62002 | 1.32 | 1.33 | 0.284 | 0.000214 | … |
| LkCa15 | K5 pre-MS | 1404 | 605 | 39804 | 3.34 | 0.0144 | 9 |
| star | beamsize | v | limit | source |
|---|---|---|---|---|
| [” ”] | [km/sec] | [mJy/beam] | ||
| Pictoris | 27 25 | 1.7 | 3.7 | F95 |
| 27 25 | 8.3 | 1.7 | F95 | |
| 68 65 | 1.7 | 10.8 | F95 | |
| 68 65 | 8.3 | 4.7 | F95 | |
| HD163296 | 3 2 | 1.6 | 3.2 | this work |
| 9 7 | 1.6 | 13.7 | this work | |
| 3 2 | 4.8 | 2.0 | this work | |
| 9 7 | 4.8 | 10.1 | this work | |
| HD135344 | 3 2 | 1.6 | 4.6 | this work |
| 9 7 | 1.6 | 12.5 | this work | |
| 3 2 | 4.8 | 2.6 | this work | |
| 9 7 | 4.8 | 10.6 | this work | |
| LkCa15 | 3 2 | 1.6 | 7.6 | this work |
| 9 7 | 1.6 | 20.0 | this work | |
| 3 2 | 4.8 | 5.1 | this work | |
| 9 7 | 4.8 | 11.6 | this work |
3 Estimates of the H i mass fraction
In the following we do not attempt to generate disk models that fit all the observed stellar and disk properties (see Table 1), but rather use generic representative disk models for T Tauri disks, Herbig Ae disks, transition phase and debris disks to interpret the observed upper limits and to help plan future observations.
Detailed chemo-physical disk models (Kamp & Dullemond, 2004; Jonkheid et al., 2004; Nomura & Millar, 2005) have shown that the chemical structure of the surfaces of UV dominated protoplanetary disks resembles that of photon dominated regions seen at the surfaces of molecular clouds. The surface layers are dominated by far ultraviolet photons (6 - 13.6 eV) and contain mostly atomic hydrogen, and other atomic and ionized species. The transition to molecular species and thus to H2 occurs roughly around a UV continuum optical depth . This transition occurs very close to the disk surface and thus the mass in this surface layer will naturally be small compared to the total disk mass. At very high gas temperatures (few 1000 K) however, the H/H2 balance is dominated by H2 destruction via collisions with neutral oxygen.
In the case of young active stars with high X-ray luminosity ( erg s-1, Glassgold et al., 1997), the chemistry and thus the depth of the surface layer is dominated by X-rays. Close to the star, X-ray heating dominates the disk energy balance, thus driving the chemistry that sets the H/H2 balance. In the outer disk, secondary ionization from X-rays determines the optical depth at which the transition from atomic to molecular hydrogen occurs.
Before we go into the details of the complicated chemo-physical disk models in the next section, we outline the basic physics governing the H/H2 balance and hence the H i mass fraction in the various evolutionary stages from young protoplanetary to very old debris disks.
3.1 Flaring protoplanetary disks
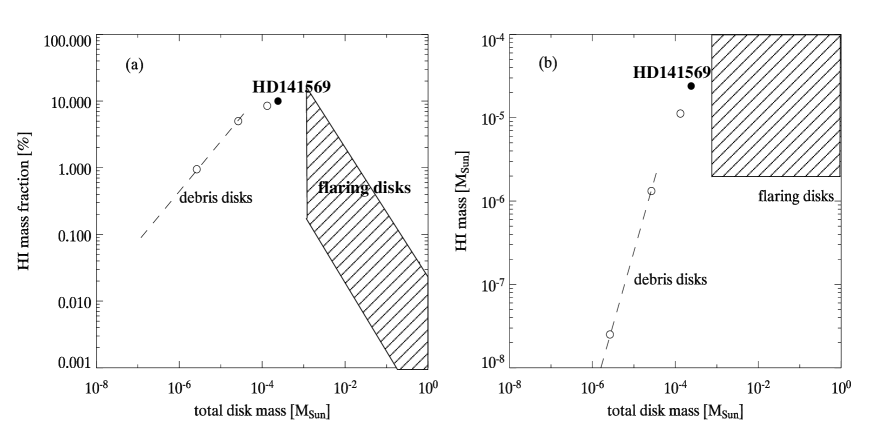
Where X-rays can be neglected, the hydrogen chemistry is driven by UV irradiation. We can estimate the H i mass in the disk by assuming that the optically thin surface layer of the disk contains only atomic hydrogen and that the transition to molecular hydrogen occurs around . This might slightly overestimate the mass of atomic hydrogen as we do not take into account H2 self-shielding. However, we do take into account the flaring angle of the incoming radiation. Given the UV absorption cross section of our disk models, cm-2 (H-atom)-1 and a typical flaring angle of (appropriate for the typical luminosity of T Tauri stars, L⊙), we obtain a total column density of
| (2) |
for the optically thin surface layer. Assuming that the disk extends from 5 to 300 AU, this translates into a total mass of M⊙. Adding mass to an optically thick disk simply adds mass to the interior, while the surface layer remains mostly unchanged. This makes the H/H2 fraction of the disk diminish with increasing disk mass (Fig. 1). Herbig Ae stars are generally more luminous and hence their typical flaring angle is up to % larger than that of the T Tauri stars. This increases the H/H2 mass fraction by the same amount.
The pure UV case presents a lower limit to the estimated H i mass in the disk. In the presence of X-rays, the column density of atomic hydrogen in the disk surface increases substantially. Glassgold et al. (2006) assumed a typical X-ray luminosity for T Tauri stars of erg s-1. They find a total column density of cm-2 for the H i surface. This number is fairly constant over the 5-20 AU range and hence we use it as an upper limit for the H i mass increase in the presence of X-rays. Such X-ray luminosities may lead to a significantly larger H/H2 mass fractions compared to the pure UV case. The shaded area in Fig. 1 indicates thus the possible range of atomic hydrogen masses ranging from the pure UV to the UV plus X-ray case.
3.2 Transition phase disks
Massive protoplanetary disks are believed to evolve through a transition phase into debris disks. These transition phase disks are usually characterized by an absence of near-IR excess and thus large inner holes. The outer disks however, are still optically thick. Observations of the very few known transition phase disks reveal that they generally have a very complex structure (e.g. rings, spirals, clumps Mouillet et al., 2001; Grady et al., 2001; Fukagawa et al., 2004), which is difficult to treat analytically.
We will use later in this paper a disk model for the transition phase object HD 141569A (Jonkheid et al., 2006) to fill the gap between the optically thick young disks and the optically thin debris disks. This model has been constructed to fit the dust scattered light and CO line observations of HD 141569A.
An UV only model predicts a relatively large H i flux. In fact, Fig. 1 shows that the H i mass fraction peaks around the regime of transitional objects such as HD 141569A. This is partly due to the fact that such transition phase disks are more tenuous than massive disks and hence UV photons penetrate deeper.
3.3 Debris disks
In very low mass disks, the H i mass fraction becomes 100% as the disk becomes totally optically thin even to UV line photons. However, such disks are very unrealistic, because generally dust grain growth and gas dispersal go along with a decreasing disk mass. Hence, there is a natural transition from protoplanetary disks to debris disks.
In the next section, we compute debris disk models which apply to the UV only case and the predicted H i presents a lower limit for very active stars such as AU Mic, which have a significant X-ray luminosity. These models use gas-to-dust mass ratios varying between 100 (i.e. value typical of molecular clouds) and 2. This affects the formation of molecular hydrogen as the increasing dust surface area per gas changes the gas thermal balance and hence the temperature dependent H2 formation rate. The H2 formation time scale is generally faster than 1000 yr even in the very low mass debris disks and equilibrium chemistry is thus a valid assumption.
In debris disks, we generally have a size distribution of dust grains with a minimum and maximum grain size, and . However, the H2 formation depends to first order only on the grain surface per hydrogen atom . A distribution of grain sizes, can hence to first order be replaced by grains with a fixed size , where is given by (Krügel, 2003, p.276). In the following, we have chosen a fixed grain size m.
Since the dust surface area per hydrogen atom stays constant in our models, the main impact of a decreasing gas-to-dust mass ratio is an increasing gas temperature and thus larger thermal velocities . This increases the collision rate between hydrogen atoms and grains and hence the H2 formation rate. The photodissociation of H2 is not affected by the gas-to-dust mass ratio. So, the H/H2 balance shifts towards molecular hydrogen as the gas-to-dust ratio decreases. We use the detailed results from our models described in Sect. 4 to approximate the H i mass fraction as a function of the gas-to-dust mass ratio . Fig. 1 shows that the H i mass fraction scales approximately as (dashed line) for the debris disks.
4 Detailed Disk Models
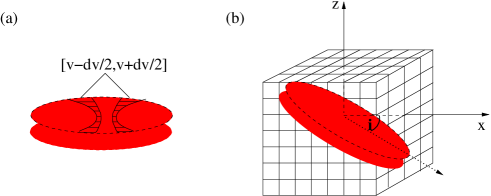
This section describes the numerical models which we construct for the circumstellar disks. In a later section we use these models to predict the H i 21 cm line emission. We use two different types of disk models here for the optically thin and thick systems. Our models do not include X-rays and deal with the pure UV case. The debris disks are typically optically thin and thus we solve the chemistry and heating/cooling along radial rays starting in the top disk layers and moving down to the midplane. In the case of optically thick models, we divide the disk in vertical slices and calculate the coupled chemistry and heating/cooling in each slice. The different geometries are shown schematically in Fig. 2. These two different approaches are necessary, because in the debris disk systems, the main source of energy input is the direct stellar irradiation, while in the younger optically thick flaring systems, the irradiation is scattered from the surface into the disk. In the following, we summarize these two disk modeling approaches and the free parameters entering the disk models.

4.1 Disk physics and chemistry of optically thin disks
The basic physics and chemistry of these models is described in Kamp & Bertoldi (2000), Kamp & van Zadelhoff (2001). Here we only briefly summarize the salient features of these models. The disk density structure is assumed to be, , where we further assume that the scaleheight scales linearly with radius, and . The radial power law exponent is set to 2.5. The chemistry is modelled using a network consisting of 48 different species covering the elements H, He, C, O, S, Mg, Si, and Fe. We use typical IS abundances for these elements (Table 3). These species are connected through 281 reactions, including also cosmic ray chemistry, photochemistry and the chemistry of excited H2. The dust temperature is derived from the assumption of large black body grains in radiative equilibrium around the star, m, g cm-3. The gas temperature is derived from a detailed energy balance including the most relevant heating and cooling processes (Kamp & van Zadelhoff, 2001). Table 4 lists the basic parameters of the computed disk models.
| element | abundance | element | abundance |
|---|---|---|---|
| H | 12.00 | S | 6.90 |
| He | 11.00 | Mg | 6.00 |
| C | 8.15 | Si | 5.90 |
| O | 8.51 | Fe | 5.40 |
H2 photodissociation occurs in the wavelength range between 912 and 1110 Å. We calculate the photodissociation rate from
| (3) |
where is the integrated stellar radiation field between 912 and 1110 Å normalized to the Habing field (Habing, 1968). The stellar radiation field is an ATLAS9 model (Kurucz, 1992) with stellar effective temperatures as listed in Tab. 4. An interstellar radiation field with in units of the Habing field is added to the stellar one. The H2 self shielding is approximated by Eq.(37) of Draine & Bertoldi (1996) for radial () and vertical directions (). We assume here that radiative decay of vibrationally excited H2 is faster than direct photodissociation out of these levels. This approximation is valid for (Shull, 1978), a limit that holds for all models, except the inner 5-10 AU of the T Tauri disk and the inner 1.4-2 AU of the Herbig Ae disk. Even though the H/H2 fraction in those areas might change if direct photodissociation from vibrationally excited levels is included, the mass of those inner disks is negligible compared to the total disk mass. The predicted H i line profiles and fluxes will hence not be significantly affected.
The H2 formation rate is
| (4) |
where is the hydrogen number density, is the dust grain number density, is the dust grain cross section, the thermal velocity, the recombination efficiency of hydrogen atoms on the surface and a temperature dependent sticking coefficient for atomic hydrogen on the grain surface. Higher gas temperatures lead to larger thermal velocities and hence to more H-grain collisions. The recombination efficiency depends on the details of the H2 formation mechanism. Cazaux & Tielens (2002) approximate the recombination efficiency as a function of grain temperature. While at low grain temperatures nearly every incoming H-atom recombines with a surface H-atom to form H2, this process becomes much less efficient at higher temperatures (50-100 K), where direct re-evaporation of pysisorbed H-atoms competes with H2 formation. The sticking probability can in principle depend on temperature, but here we assume it to be equal to one.
The models for Pictoris are calculated assuming a constant dust mass of M⊙ derived from fitting the infrared spectral energy distribution (Chini et al., 1991). Since the total gas mass in the disk around this star is not yet well constrained, we assume here different gas-to-dust mass ratios ranging from the canonical value of 100 down to 2. Fig. 3 shows the H and H2 abundances for two vertical cuts at 50 and 200 AU in the three disk models. This quantitatively illustrates what has been stated in Sect. 3.3: the gas temperature increases as the gas-to-dust mass ratio decreases. The heating/cooling balance shifts, because the line cooling decreases with decreasing gas densities, while the photoelectric heating stays constant.

| type | R∗ | M∗ | Mdisk | Mgas/Mdust | Rin | Rout | a | (UV) | LUV | |
|---|---|---|---|---|---|---|---|---|---|---|
| [K] | [R⊙] | [M⊙] | [M⊙] | [AU] | [AU] | [m] | [cm2/(H-atom)] | [erg s-1] | ||
| debris disk | 8250 | 1.7 | 2.0 | 100 | 40 | 500 | 3 | |||
| 20 | 40 | 500 | 3 | |||||||
| 2 | 40 | 500 | 3 | |||||||
| HD 141569A | 10 000 | 1.7 | 2.0 | 100 | 80 | 500 | 0.1 | |||
| Herbig Ae | 9500 | 2.4 | 2.5 | 0.01 | 100 | 1.4 | 300 | 0.1 | ||
| T Tauri | 4000 | 2.5 | 0.5 | 0.01 | 100 | 5.0 | 300 | 0.1 |
4.2 Disk physics and chemistry of optically thick disks
For the massive optically thick disk models we follow a similar approach as for the optically thin models. However, the underlying equilibrium density structure is very different; it is taken from two-dimensional hydrostatic equilibrium models (Dullemond et al., 2002). In these models, the gas temperature is first approximated by the dust temperature found from detailed continuum radiative transfer. We then re-evaluate the gas temperature in the context of the coupled chemistry and heating/cooling balance (Kamp & Dullemond, 2004). Another difference from the hydrostatic equilibrium models is need to account for the flaring angle, that is the grazing angle under which the stellar irradiation hits the disk surface (see Fig. 2).
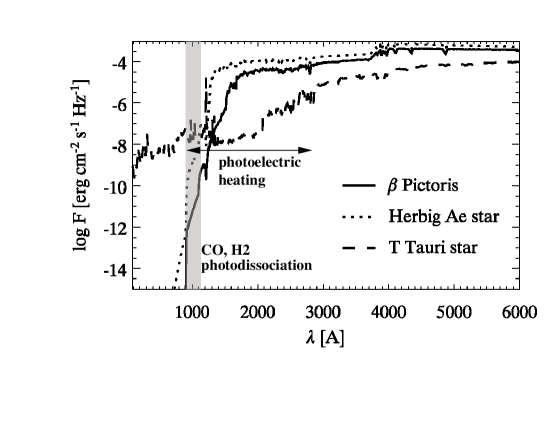
The stellar radiation field for a T Tauri star is a combination of an ATLAS9 model and a scaled solar chromosphere model as outlined in Kamp & Dullemond (2004). Even though the chromospheric UV excess contributes little to the total luminosity and hence the flaring of the disk, it is relevant for the photodissociation of molecules and the photoelectric heating of the disk. In the case of the Herbig Ae star, we used a pure ATLAS9 photospheric model with K and . Fig. 4 compares the various UV and optical radiation fields used in the disk models. Diffuse interstellar UV irradiation is not relevant for young disks at radii smaller than 300 AU.
The chemical network and heating/cooling processes are the same as for optically thin disks. The dust properties however are different reflecting a much younger evolutionary stage. We use the same grain properties and opacities as used in the underlying continuum radiative transfer models by Dullemond et al. (2002) , m, cm2/H-atom. The protoplanetary disk models described in Table 4 have been previously published in Kamp & Dullemond (2004) and Kamp et al. (2006) as a typical T Tauri and Herbig Ae star respectively.
5 H i 21 cm line radiative transfer
We assume here that the level population numbers are in LTE, i.e. T Tgas, which is a valid approximation for n. Given typical particle densities and gas temperatures of cm-3 and 10–10 000 K, this assumption is fullfilled throughout the entire disk. We thus assume a ratio of for the level population numbers, a good approximation for K (error smaller than 1%). Even though the gas temperature does not play a role in the H i level populations, it is still crucial for the determination of the H/H2 chemical balance and hence the total number density of atomic hydrogen.
The line emission and absorption coefficients and are derived from
| (5) | |||||
| (6) |
The absorption coefficient is corrected for stimulated emission assuming LTE level population numbers and using the first order term of the expansion of the exponential. The basic atomic parameters for the line are s-1, GHz, and . The total emission per velocity bin is derived from an integration along the optical path within the beam area and within the respective velocity bin []
| (7) |
The optical depth is derived from the absorption coefficient
| (8) |
The typical ’beam averaged’ optical depth are smaller than for the Herbig Ae disk seen edge-on and for the pole-on model. Even though the column densities are smaller in the pole-on model, the velocities in the line of sight are zero; hence the optical depth contribution at is maximized.
The optical depth is – in the case of a rotating disk – defined as a function of velocity, . Hence, the corresponding column density to derive the optical depth is the averaged column density of all H-atoms falling in the velocity bin averaged over the beam. We assume that the disk is in keplerian rotation around the star with central mass . The velocity profile for an inclined disk (the inclination angle is defined between the line of sight and the disk midplane, so that denotes an edge-on disk ) is given by
| (9) |
where is the azimutal angle in the disk.
To calculate observed 21 cm line fluxes, the disk is projected onto a Cartesian grid with the z-axis in the direction of the line of sight. A separate cube is created for each velocity bin (see Fig.5). For each of the cubes, the emission and optical depth are integrated along the line of sight.
The intensity arriving at Earth is given by
| (10) |
Converting to more common units of erg cm-2 s-1 Hz-1 is done by using
| (11) |
We use the beamwidth given in Table 2 as a FWHM to convolve the resulting images in each velocity channel assuming a gaussian beam profile . This leads to the final intensity in observers units, mJy per beam, extracted at the center
| (12) |
6 Predictions for H I disk emission
We will constrain disk parameters, especially the total disk gas mass, by comparing the observed upper limits for the H i 21 cm line presented in Sect. 2 to predicted emission from the individual disk models. In Sect. 3 we presented rough estimates of the H i mass in the various disks based on various simplifications. In this section we take a more quantitative approach involving detailed disk models as well as stellar parameters, inclinations and distances appropriate for the individual sources. We apply the models described in Sect. 4 to predict H i line maps and intensities based on the observed beam sizes. Table 5 summarizes the basic H i characteristics of those disk models.
| type | Mdisk | H i mass | beam size | peak intensity | peak surface brightness |
|---|---|---|---|---|---|
| [M⊙] | [MEarth] | [AU] | [mJy] | [Jy/arcsec2] | |
| debris disk | 4.0 | 1280 | 18.0 | 480 | |
| 0.4 | 1280 | 1.8 | 40 | ||
| 1280 | 1 | ||||
| HD 141569A | 13.0 | 1100 | 1.6 | 290 | |
| Herbig Ae | 0.01 | 0.3 | 980 | 0.05 | 110 |
| T Tauri | 0.01 | 1.3 | 1120 | 0.24 | 400 |
6.1 Pictoris
The disk around Pictoris is the best studied example of a debris disk. O vi line emission has been detected with FUSE (Deleuil et al., 2001) indicating some level of stellar activity. A followup search for the O vii line with XMM-Newton has revealed a very low flux of erg cm-2 s-1 (Hempel et al., 2005). This results in a X-ray to UV luminosity ratio of . The impact of such an X-ray flux on the chemistry of debris disks (gas-to-dust mass ratios smaller than 1) is yet unknown. We can therefore not rule out the possibility that the disk around Pictoris contains additional atomic hydrogen produced by X-rays.
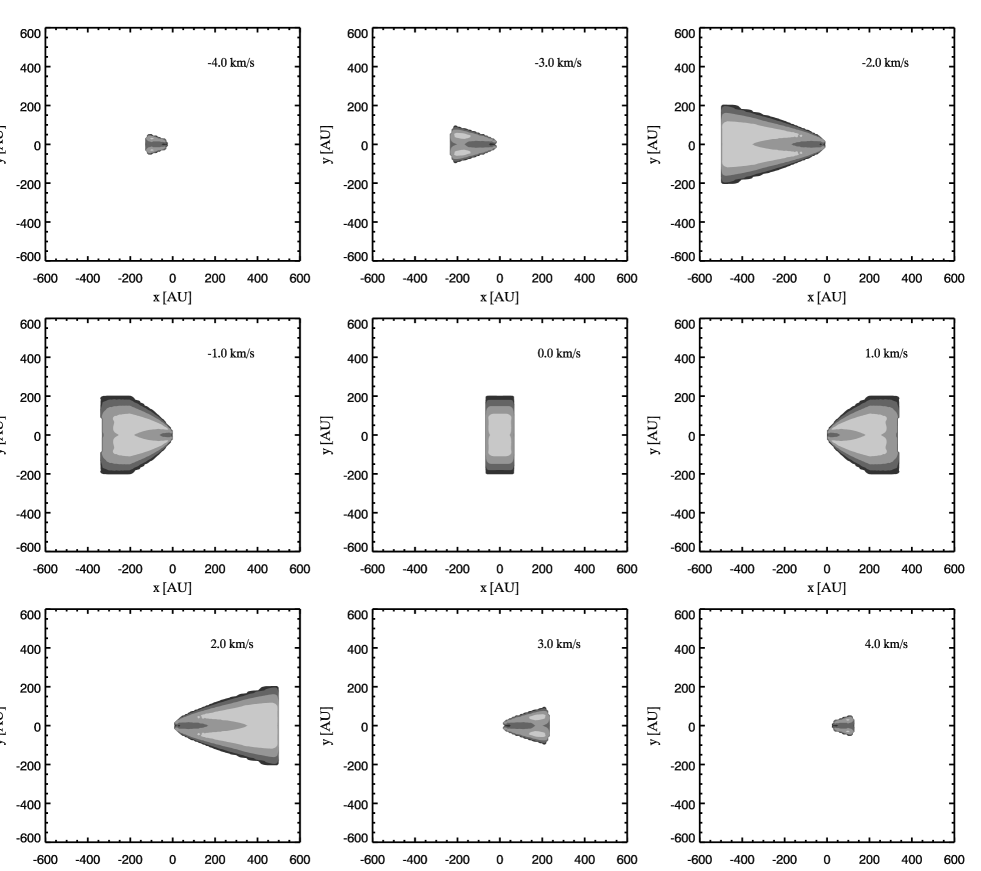
The dust mass in the Pictoris disk is well known from previous observations and we assume in this paper a fixed dust mass of 0.44 MEarth (see Sect. 4.1). We computed models with gas-to-dust mass ratios from 100 to 2. Fig. 6 shows the distribution of atomic hydrogen in the disk for individual velocity channels ( km/s). The atomic hydrogen is located in a thin layer on top of the entire disk. The disk towards the midplane looks filled by atomic hydrogen, but this is due to the projection of the three dimensional disk model into the plane of observations. It stems from H i in the disk surface outside of the observing plane. This can be seen in Fig. 7, where we plot the integrated H i 21 cm line image on top of the WFPC2 dust scattererd light image of Al Schultz and his team (private communication). As expected, the maximum of the H i emission occurs at the surface of the gaseous disk. Note also that the HI emission lies well within the region from which scattered light from dust grains can be detected. Recent imaging of the disk in the Na i D lines indicates scaleheights of (Brandeker et al., 2004), a factor 2 higher than what our models actually use. It is currently unclear which processes lead to such large scaleheights, but one reason might be higher gas temperatures in case of a very low gas-to-dust mass ratio. As explained in Sect. 4.1, this is due to a shift in the thermal balance between photoelectric effect and fine structure line cooling. The distribution of the micron sized dust grains responsible for the scattered light is sustained by collisions among dust grains and/or larger bodies within the disk and is not coupled to the gas.
We checked the resulting line intensities for the different beam sizes used in the observations. The beams were always centered on the stellar position. It turns out that the 66.5” (1280 AU) beam includes most of the H i emission of Pictoris, which is not surprising given our disk model extension of AU (see Fig. 8). The smaller beams miss a large fraction of the emission at intermediate velocities ( km/s), which is located in the outer regions of the disk (Fig. 6). Given the density law of the underlying disk model, most of the disk mass — and hence also the H i mass — resides in the outer parts of the disk. The maximum H i intensity of the 44 MEarth disk model, 18 mJy, is larger than the observed upper limit of 4.7 mJy. The ATCA observations (F95) therefore imply an upper limit of MEarth on the total gas mass (H i+H2) in the disk around Pictoris (Fig. 9).


6.2 LkCa15
For modeling the H i emission from this star, we used the T Tauri disk model by Kamp & Dullemond (2004). This model extends from 5 to 300 AU and has a mass of 0.01 M⊙. The distance to the star is 140 pc and Qi et al. (2003) have shown from modeling CO and HCO+ that the inclination is . LkCa 15 has not been detected in the ROSAT All Sky Survey (RASS). Neuhäuser et al. (1995) put an upper limit of erg s-1 on the X-ray luminosity for this source. The resulting upper limit to the X-ray to UV luminosity ratio is 0.02.
The H i observations with a beam of 8" comprised the entire disk as opposed to the smaller beam of 2.5", which contains only the inner 125 AU of the disk. Using the larger beam, we predict a 21 cm line flux of 0.24 mJy, two orders of magnitude lower than the upper limit derived from GMRT observations. For the smaller beam size, we obtain fluxes of 0.13 mJy. The observed upper limit of 20 mJy to the 21cm flux corresponds to an upper limit of M⊙ for the atomic hydrogen mass.
Since we have not accounted for the H i production by X-rays, in young active stars which are strong X-ray emitters, the H i mass would be much higher than what we obtain. As can be seen in Fig. 1 for such stars in nearby (50-100 pc) young associations, the 21 cm line flux might be detectable.
6.3 HD 163296
For modeling the H i emission from this star, we used the Herbig Ae disk model by Kamp et al. (2006). The stellar effective temperature in this model of 9750 K is only marginally higher than the value quoted in Table 4 and the stellar mass is 2.5 M⊙. HD 163296 is a weak X-ray source with erg s-1 (Swartz et al., 2005), corresponding to an X-ray to UV luminosity ratio of 0.6. Therefore, the predicted H i mass from our model should be considered as a lower limit.
The model extends from 1.7 to 300 AU and has a mass of 0.01 M⊙. We use a distance of 122 pc and an inclination angle of 65∘ from Jayawardhana et al. (2001) and Dominik et al. (2003) respectively. As in the case of LkCa15, we used the larger beam of 8", so that the beam contains the entire disk. The peak H i 21 cm flux for this model is 0.05 mJy. The fluxes are lower than for LkCa15, because the H i fraction in the model is about an order of magnitude lower ( %). This is due to a weaker UV radiation field. While we assumed a chromospheric UV excess for the T Tauri star, we chose a pure photospheric model in the case of the Herbig Ae star; chromospheric activity is mostly restricted to solar-type stars. The observed upper limit of 13.7 mJy corresponds to an H i mass upper limit of M⊙.
6.4 HD 141569A
Our estimates of atomic hydrogen fractions in disks suggested that the fraction would be maximal in transition phase objects. HD 141569A which has been modeled extensively by Jonkheid et al. (2006) is such a transition phase disk. This star has not yet been observed in the 21 cm line, but given that it is an excellent candidate for future observations, we present here predictions for the H i 21 cm flux.
The parameters for the dust phase of the model have been derived from scattered light observations of Mouillet et al. (2001), while the gas phase constraints come from a fit to the CO rotational emission (J=3-2) from Dent et al. (2005). The dust is mostly confined in two rings located at 185 AU and 325 AU. The gas follows a smooth surface density profile extending all the way in to 80 AU. This star has two M-type companions at distances of and AU that are most likely the source of the X-rays measured in the ROSAT All Sky Survey. The X-ray luminosity is erg s-1 (Weinberger et al., 2000). Given the distance of the X-ray source from the disk around the primary star, the X-ray flux is a factor lower than the UV flux at 40 AU. Thus, X-rays will not affect the chemical processes around HD 141569A.
The maximum emission is 1.6 mJy using a beam diameter of 11” (1100 AU). With the current instrument sensitivity, this would translate into a 1 signal. However, given the caveats of the above presented disk model, we cannot exclude that there might be more H i than anticipated from CO observations. A different gas density profile or an underestimation of the UV radiation field of this star may lead to an even higher fraction of atomic hydrogen and hence to a larger signal. Clearly, this is the most promising candidate to look for atomic hydrogen.
7 Discussion
In the following, we summarize the main results of the H i modeling and discuss them in the light of present and future observing possibilities.
7.1 Gas in the disk around Pictoris
The gas mass upper limit from the H i observations is MEarth. This amounts to a H i midplane column density of cm-2. However, the same model predicts H2, O i, C i, and C ii midplane column densities of , , , and cm-2. These values are much larger than those derived from UV absorption measurements by Lecavelier des Etangs et al. (2001) and Roberge et al. (2006). The latter paper compares the elemental composition in the stable Pictoris gas to the composition of the Sun, meteorites and comets; it leads to the conclusion that the gas in the disk around this star is extremely carbon overabundant, raising the interesting question of the origin of this peculiar chemical composition.
Current H i 21 cm line observations cannot rule out the presence of enough atomic hydrogen in the disk around Pictoris to obtain a solar gas composition - in terms of hydrogen versus metals; metals here comprise all elements besides hydrogen and helium. More sensitive radio observations are needed to determine the true hydrogen content of this disk. Since current facilities such as the GMRT and ATCA are limited to sensitivities of the order of 1-2 mJy, we have to wait for the Square Kilometer Array (SKA) to address this question (Schilizzi, 2004). The SKA will have a roughly 10 times larger collecting area than current telescopes and a spatial resolution of up to 1 mas for imaging. The sensitivity of the SKA is expected to be at least a factor of above the one of current interferometers over a wide range of resolutions.
Our models, however, suggest that the dominant form of hydrogen in debris disks is molecular and not atomic hydrogen (Sect. 3.3 and Sect. 4.1). Thus the FUSE non-detection of H2 in the Pictoris UV spectrum puts the most stringent upper limit on the disk hydrogen mass (Lecavelier des Etangs et al., 2001). The H2 column density from these observations is lower than cm-2; this leads to an upper disk mass limit of MEarth ( MMoon), if we apply the same underlying disk structure we used in our debris disk models.
7.2 Future Observations using H i as a tracer
Our models show that the non-detection of the H i 21 cm line is not due to the absence of atomic hydrogen in these disks, but rather due to the weakness of the signal as compared to the sensitivities of current telescopes. However, our models also show that the SKA will be able to detect H i 21 cm emission from protoplanetary disks around stars in nearby star forming regions. These observations would yield a number of interesting constraints on the properties and evolution of these disks.
In massive disks, the H i 21 cm line traces the thin layer of the disk surface that is directly exposed to X-ray and UV irradiation; the H/H2 mass fraction depends mainly on the strength of the radiation field impinging the disk surface. More stringent upper limits would hence give an independent check of the irradiation environment of the star. In addition, the velocity information in the line profile provides an independent measurement of the stellar mass, disk extension and evaporative flow from the disk surface. Typical velocities for the evaporative flow are larger than 20% of the local sound speed (Adams et al., 2004),
| (13) |
Such an outflow should be detectable at the typical line resolutions of 1 km/s used in the radio regime.
At later stages, e.g. in the transition phase disk around HD 141569A, the mass fraction of atomic hydrogen is of the order of 10%. This makes H i indeed a good probe of total disk mass in such transition phase disks. (See Fig. 1b for the dependence of H i mass on total disk mass). These disks are the best candidates for 21 cm line detection; our models indicate that existing telescopes may be able to detect emission from disks at distances smaller than 100 pc.
Debris disk systems often have a very low gas-to-dust mass ratio, which drives the hydrogen into its molecular form. In such debris disks, the H i fraction is very low, smaller than 10%. The integrated H i flux is therefore significantly lower than for the transitional phase disk. This scenario therefore predicts hugely different total H i emission for the different types of disks which can in principle be tested observationally.
Finally, we note that we have ignored H i production by X-rays, which means that our models underestimate the H i 21cm flux. Self consistent modeling of the X-ray chemistry as well as X-ray heating will hence probably lead to an even more optimistic prediction for the detectability of the 21cm emission from circumstellar disks by next generation radio telescopes.
References
- Adams et al. (2004) Adams, F. C., Hollenbach, D., Laughlin, G., and Gorti, U. ApJ, 611, 360
- Brandeker et al. (2004) Brandeker, A., Liseau, R., Olofsson, G., Fridlund, M. 2004, A&A 413, 681
- Cazaux & Tielens (2002) Cazaux, S., Tielens, A.G.G.M. 2002, ApJ 575, L29
- Chini et al. (1991) Chini, R., Kruegel, E., Kreysa, E., Shustov, B., Tutukov, A. 1991, A&A 252, 220
- Crifo et al. (1997) Crifo, F., Vidal-Madjar, A., Lallement, R., Ferlet, R., Gerbaldi, M. 1997, A&A 320, L29
- Deleuil et al. (2001) Deleuil, M., Bouret, J.-C., Lecavelier des Etangs, A., et al. 2001, ApJ 557, L67
- Dent et al. (2005) Dent, W. R. F., Greaves, J. S., Coulson, I. M. 2005, MNRAS, 359, 663
- Dominik et al. (2003) Dominik, C., Dullemond, C. P., Waters, L. B. F. M., Walch, S. 2003, A&A, 398, 607
- Draine & Bertoldi (1996) Draine B.T., Bertoldi F., 1996, ApJ, 468, 269
- Dullemond et al. (2002) Dullemond, C. P., van Zadelhoff, G. J., Natta, A. 2002, A&A 389, 464
- Freudling et al. (1995) Freudling, W., Lagrange, A.-M., Vidal-Madjar, A., Ferlet, R., Forveille, T. 1995, A&A, 301, 231 (F95)
- Fukagawa et al. (2004) Fukagawa, M., Hayashi, M., Tamura, M., Itoh, Y., Hayashi, S.S. et al. 2004, ApJ 605, L53
- Glassgold et al. (2006) Glassgold, A.E., Najita, J.R., Igea, J. 2006, ApJ in press
- Glassgold et al. (1997) Glassgold, A.E., Najita, J., Igea, J. 1997, ApJ 480, 344
- Grady et al. (2001) Grady, C.A., Polomski, E.F., Henning, Th., Stecklum, B., Woodgate, B.E., et al. 2001, AJ 122, 3396
- Habing (1968) Habing H.J. 1968, Bull. Astr. Inst. Netherlands, 19, 421
- Hempel et al. (2005) Hempel, M., Robrade, J., Ness, J.-U., Schmitt, J.H.M.M. 2005, A&A 440, 727
- Hollenbach & Gorti (2006) Hollenbach, D., Gorti, U. 2006, in preparation
- Jayawardhana et al. (2001) Jayawardhana, R., Fisher, R. S., Telesco, C. M., Pina, R. K., Barrado y Navascués, D., Hartmann, L. W., Fazio, G. G. 2001, AJ, 122, 2047
- Jonkheid et al. (2004) Jonkheid, B., Faas, F.G.A., van Zadelhoff, G.-J., van Dishoeck, E.F. 2004, A&A 428, 511
- Jonkheid et al. (2006) Jonkheid, B., Kamp, I., Augereau, J.-C., van Dishoeck, E.F. 2006, A&A in press
- Kamp & Bertoldi (2000) Kamp, I., & Bertoldi, F. 2000, A&A, 353, 276
- Kamp & van Zadelhoff (2001) Kamp, I., and van Zadelhoff, G.-J. 2001, A&A 373, 641
- Kamp & Dullemond (2004) Kamp, I., Dullemond, C.P. 2004, ApJ, 615, 991
- Kamp et al. (2006) Kamp, I., Dullemond, C.P., Hogerheijde, M., Enriquez, J.E. 2006, proceedings of the IAU Symposium 231 “Astrochemistry Throughout the Universe”, eds. D.C. Lis, G.A. Blake, E. Herbst, p.377
- Krügel (2003) Krügel, E. 2003, The Physics of Interstellar Dust (Bristol, UK: IOP Publishing)
- Kurucz (1992) Kurucz R.L. 1992, Rev. Mex. Astron. Astrofis. , 23, 181
- Lecavelier des Etangs et al. (2001) Lecavelier des Etangs, A., Vidal-Madjar, A., Roberge, A., Feldman, P. D., Deleuil, M., et al. 2001, Nature, 412, 706
- Mouillet et al. (2001) Mouillet, D., Lagrange, A. M., Augereau, J. C., Ménard, F. 2001, A&A 372, L61
- Neuhäuser et al. (1995) Neuhäuser, R., Sterzik, M.F., Schmitt, J.H.M.M., Wichmann, R., Krautter, J. 1995, A&A 297, 391
- Nomura & Millar (2005) Nomura, H., Millar, T. 2005, A&A 438, 923
- Qi et al. (2003) Qi, C., Kessler, J.E., Koerner, D.W., Sargent, A.I., Blake, G.A. 2003, ApJ, 597, 986
- Roberge et al. (2006) Roberge, A., Feldman, P.D., Weinberger, A.J., Deleuil, M., Bouret, J.-C. 2006, Nature in press
- Schilizzi (2004) Schilizzi, R.T. 2004, proceedings of the SPIE, Volume 5489, pp. 62-71
- Shull (1978) Shull, J.M. 1978, ApJ 219, 877
- Smith & Terrile (1984) Smith, B.A. & Terrile, R.J. 1984, Science, vol. 226, p.1421
- Swartz et al. (2005) Swartz, D.A., Drake, J.J., Elsner, R.F., Ghosh, K.K., Grady, C.A., Wassell, E., Woodgate, B.E., Kimble, R.A. 2005, ApJ 628, 811
- Thi et al. (2001) Thi, W. F., van Dishoeck, E. F., Blake, G. A., van Zadelhoff, G. J., Horn, J., et al. 2001, ApJ, 561, 1074
- Weinberger et al. (2000) Weinberger, A.J., Rich, R.M., Becklin, E.E., Zuckerman, B., Matthews, K. 2000, ApJ 544, 937