The INTEGRAL Galactic bulge monitoring program: the first 1.5 years
Abstract
Aims. The Galactic bulge region is a rich host of variable high-energy point sources. Since 2005, February 17 we are monitoring the source activity in the Galactic bulge region regularly and frequently, i.e., about every three days, with the instruments onboard INTEGRAL. Thanks to the large field of view, the imaging capabilities and the sensitivity at hard X-rays, we are able to present for the first time a detailed homogeneous (hard) X-ray view of a sample of 76 sources in the Galactic bulge region.
Methods. We describe the successful monitoring program and show the first results from the start of the monitoring up to 2006, April 21, i.e., for a period of about one and a half year, during three visibility seasons. We focus on the short (hour), medium (month) and long-term (year) variability in the hard X-ray bands, i.e., 20–60 keV and 60–150 keV. When available, we discuss the simultaneous observations in the soft X-ray, 3–10 keV and 10–25 keV, bands.
Results. Almost all the sources in the Galactic bulge region we detect in the 20–60 keV and 60–150 keV bands are variable. During the last two and a half weeks of the third visibility season most of the known persistent (hard) X-ray sources in the Galactic Center region were not detected. Of our sample of sources, per visibility season we detect 32/33 sources in the 20–60 keV band and 8/9 sources in the 60–150 keV band above a signal to noise of 7. On average, we find per visibility season one active bright (100 mCrab, 20–60 keV) black-hole candidate X-ray transient and three active weaker (25 mCrab, 20–60 keV) neutron star X-ray transients.
Most of the time a clear anti-correlation can be seen between the soft and hard X-ray emission in some of the X-ray bursters. Hard X-ray flares or outbursts in X-ray bursters, which have a duration of the order of weeks are accompanied by soft X-ray drops. On the other hand, hard X-ray drops can be accompanied by soft X-ray flares/outbursts.
During the course of our program we found a number of new sources, IGR J173543255, IGR 174532853, IGR J174542703, IGR J174562901b, IGR J175362339, and IGR J175412252. We report here on some of the high-energy properties of these sources.
Conclusions. The high-energy light curves of all the sources in the field of view, and the high-energy images of the region, are made available through the WWW, as soon as possible after the observations have been performed, at http://isdc.unige.ch/Science/BULGE/.
Key Words.:
Accretion, accretion disks – binaries: close – binaries: general – Stars: neutron – Galaxy: bulge – X-rays: binaries1 Introduction
The bulge of our Galaxy hosts a variety of hard X-ray and -ray point sources (e.g., Knight et al. 1985, Skinner et al. 1987, Churazov et al. 1994; see, e.g., Bird et al. 2006, Bélanger et al. 2006, Revnivtsev et al. 2004a, for observations made by INTEGRAL, the International Gamma-Ray Astrophysics Laboratory; Winkler et al. 2003). Among them are persistent and transient neutron-star and black-hole (candidate) binaries, as well as magnetic cataclysmic variables and AGN. Due to the variability these sources possess on time scales of milliseconds to days (quasi-periodic oscillations, pulsations, [absorption] dips, eclipses, type I and type II X-ray bursts, orbital variations, flares) and weeks to years (orbital variations, outburst cycles, on/off states), the region never looks exactly the same.
Hard X-ray (20 keV) emission emerging from the Galactic bulge sources mainly comes from highly energetic processes occurring in the course of accretion from a donor star on to the compact object, i.e., a white dwarf, neutron star or black hole. Since most of the emission comes from the region close to these compact objects, studying the hard X-ray and -ray emission will give us more insight into the accretion processes under extreme conditions, as well as possibly identifying the nature of the compact accretor.
From 17 February 2005 onwards, whenever the Galactic bulge region was visible by INTEGRAL, we have been monitoring this region approximately every 3 days. This paper serves mainly as a description of this program in more detail and we show the first results, spanning times scales between half an hour and one and a half year. Preliminary announcements of some of these results were made by Bodghee et al. (2005), Brandt et al. (2005), Chenevez et al. (2006a,b), Kretschmar et al. (2005), Kuulkers et al. (2005a,b, 2006a), Mowlavi et al. (2005), Shaw et al. (2005a,b,c, 2006) and Turler et al. (2006). A preliminary report of our program was presented by Kuulkers et al. (2006b).
2 INTEGRAL and the Galactic bulge monitoring program
Since X-rays typically above 10 keV are difficult to focus using currently known reflecting material, one has to revert to other means of imaging techniques when investigating crowded regions. Coded masks are effective imagers in this energy range, as, e.g., shown by the first hard X-ray (20–30 keV) images of the region around the Galactic Center (Skinner et al. 1987).
INTEGRAL is an ESA scientific mission dedicated to fine spectroscopy (500; SPI; Vedrenne et al. 2003) and fine imaging (angular resolution: 12’ FWHM, source location accuracy: 1–3’; IBIS; Ubertini et al. 2003) of celestial -ray sources in the energy range 15 keV to 10 MeV with simultaneous monitoring in the X-ray (3–35 keV, angular resolution: 3’; JEM-X; Lund et al. 2003) and optical (V-band, 550 nm; OMC; Mas-Hesse et al. 2003) energy ranges. All the instruments onboard INTEGRAL, except the OMC, have coded masks.
INTEGRAL has already spent a considerable amount of observing time on the Galactic bulge region, providing a deep insight (see, e.g., Bélanger et al. 2006). Our program, however, was initiated to monitor, for the first time with INTEGRAL, this region frequently on a regular basis at hard X-rays and -rays. The main aim is to investigate the source variability and transient activity on time scales of hours to days to weeks to months simultaneously at relatively soft (10 keV) and hard (10 keV) energies. One complete hexagonal dither pattern (7 pointings of 1800 s each, i.e., 1 on-axis pointing, 6 off-source pointings in a hexagonal pattern around the nominal target location, each 2∘ apart) is performed during each INTEGRAL revolution (orbit) around the earth, i.e., roughly every 3 days. This yields a total coverage around the Galactic Center of 29∘ with IBIS/ISGRI and about 6∘ with JEM-X for a total exposure of 12.6 ks. With the fully and partially coded field of view we cover about half of the Galactic bulge X-ray binary population with IBIS/ISGRI (see also, e.g., in ’t Zand 2001, in ’t Zand et al. 2004).
The hexagonal dither pattern is done whenever the region is visible by INTEGRAL (about two times per year for a total period of about 4 months). We refer to each visibility period as ‘season’; in this paper we report on observations made during three seasons. As a service to the scientific community, the JEM-X light curves (3–10 keV and 10–25 keV) and the IBIS/ISGRI light curves (20–60 keV and 60–150 keV) are made publicly available as soon as possible after the observations are performed, both in graphic and in ASCII form. In addition, IBIS/ISGRI and JEM-X mosaic images (i.e., composite images made of overlapping images) of each hexagonal dither observation are provided, with information on the detected sources. Finally, all IBIS/ISGRI 20–60 keV mosaic images per revolution are stacked into a movie, showing the ever-changing hard X-ray/-ray sky. The results, as well as more information about the program, can be retrieved from the INTEGRAL Galactic bulge Monitoring WWW page hosted at the INTEGRAL Science Data Center (ISDC) in Switzerland: http://isdc.unige.ch/Science/BULGE/.
Similar Galactic bulge monitoring programs at various soft and hard X-ray energies have been performed (see, e.g., in ’t Zand 2001). For example, GRANAT/SIGMA (30 keV–1 MeV) performed regular observations of the Galactic Center region between 1990 and 1994 in comparable energy ranges, i.e., above 35 keV, and with comparable visibility periods throughout the year (see, e.g., Churazov et al. 1993). The sensitivity, angular resolution and source location accuracy of GRANAT/SIGMA (respectively, 5 detection level of 10 mCrab at 40–100 keV for an exposure time of 9 Ms at the Galactic Center, 15’ and 2–3’; see Revnivtsev et al. 2004b) are, however, not as good as INTEGRAL/IBIS (5 detection level of 1 mCrab at 40–100 keV for an exposure time of 1.5 Ms at the Galactic Center, see Bird et al. 2006).
Some monitoring programs are currently ongoing, such as the RXTE Galactic bulge Scans (Swank & Markwardt 2001; Markwardt 2006). However, the RXTE/PCA (2–60 keV) and HEXTE (15–250 keV) do only have a 2∘ collimator and no imaging resolution, providing only information on a given source for a short time when the instrument scans over it; moreover, in the Galactic Center region itself there is significant source confusion. There are currently other instruments in operation at similar energy ranges as those covered by IBIS/ISGRI, such as Swift/BAT (15–150 keV with a field-of view of 2 steradians; Barthelmy 2000). However, they have a worse imaging capability, again leading to source confusion in the Galactic Center region (Swift/BAT PSF angular resolution is 22’), and a lower sensitivity (3 detection level of 27 mCrab at 15–50 keV for an exposure of 736 s; see Krimm et al. 2006).
In this paper we show the results of three full seasons of our AO-3 monitoring, about 1.5 years, i.e., from 2005, February 18 – April 19 (INTEGRAL revolutions 287–307; MJD 53419–53479), 2005, August 16 – October 26 (revolutions 347–370; MJD 53598–54034), and 2006, February 9 – April 21 (revolutions 406–429; MJD 53775–53846). We note that the program continues in INTEGRAL AO-4 (see Kuulkers et al. 2006c), and we intend to extend this program into further Announcement of Opportunities with INTEGRAL. In the next Section we explain how the data analysis is done (Sect. 3). We then summarize the observations per season by focusing on the averaged (or mosaiced) images and corresponding source fluxes and detection significances (Sect. 4.1). The long-term hard X-ray (20 keV) light curves of the monitoring program are shown in Sect. 4.2. In Sect. 4.3 we focus on an interesting period when there was almost no activity in the region around the Galactic center. New INTEGRAL sources found by our program are discussed in Sect. 4.4. Results from the monitoring with the OMC are given in Sect. 4.5. Finally, we summarize and make our concluding remarks in Sect. 5.
3 Data analysis
In the current paper we only consider data from IBIS/ISGRI (Lebrun et al. 2003), JEM-X and OMC. We do not consider the data from IBIS/PICsIT (Labanti et al. 2003) or SPI instruments: either the angular resolution is limited (SPI: 2.5∘) and therefore the various sources in the Galactic bulge region close to each other complicate the analysis (see, e.g., Bouchet et al. 2005), or the sources are too weak to be detected (IBIS/PICsIT, which operates at 175 keV).
The INTEGRAL IBIS and JEM-X data reduction is performed using the Off-line Scientific Analysis (OSA; see Courvoisier et al. 2003), v5.1. In our analysis we use an input source catalog, containing a total of 76 sources (see Table 1). Most of these sources had been previously detected by IBIS/ISGRI (see, e.g., Revnivtsev et al. 2004a; Bird et al. 2006). To these sources we added (transient) sources that have been detected in the mean time, as well as those found in the pre-INTEGRAL era but currently not detected (yet) by INTEGRAL. To make sure that our results do not depend on the selected input catalogue, we compared our results with the ones obtained using the full ISDC Reference Catalog (version 23.0) which contains all known high-energy sources (see Ebisawa et al. 2003); the imaging and light curve results were consistent. The classifications of the sources are mainly based on the information given by Bird et al. (2006), with updates where noted (Table 1). The black-hole (candidate) binaries were selected from McClintock & Remillard (2006) and Remillard et al. (2006a), except for the new transient source XTE J1817330 (see Remillard et al. 2006b). The X-ray burster list is based on the list given by in ’t Zand et al. (2004), except for XTE J1739285 (Brandt et al. 2005) and IGR J172543257 (Brandt et al. 2006). SLX 1744299 and SLX 1744300 are separated by only 3’ (Skinner et al. 1990) and therefore inseparable with current hard X-ray instruments like IBIS/ISGRI. 3’ is at the resolution limit of JEM-X and the soft X-ray emission from the two sources is seen to be different from a point source by JEM-X. However, it is not able to separate the emission confidently, when both sources are active. We therefore regard them as one source, SLX 1744299/300. IGR J174603047 was a source reported by Bird et al. (2004), that turned out to be an artefact (Bird et al. 2006). For the time being this source has been included in our list. We can confirm that in our monitoring program it was never detected by either IBIS/ISGRI or JEM-X (see Sect. 4.1).
| Source | Type | Ref. | Fig. | lII | bII | R.A. | Dec | Comment |
|---|---|---|---|---|---|---|---|---|
| GX 17+2 | LMXB, B, Z | 1 | 7 | 16.432 | 0.710 | 18 16 01.4 | 14 02 11 | |
| SAX J1818.61703 | ?,T | 1 | 14.078 | 0.710 | 18 18 39 | 17 03.1 | ||
| GX 13+1 | LMXB, B, A | 1 | 7 | 13.517 | +0.106 | 18 14 31.55 | 17 09 26.7 | |
| PKS 1830211 | AGN, QSO | 1 | 12.166 | 5.712 | 18 33 39.89 | 21 03 39.8 | ||
| SGR 180620 | SGR | 1 | 9.996 | 0.242 | 18 08 39.32 | 20 24 39.5 | ||
| SAX J1805.52031 | ?,T | 2 | 9.554 | +0.340 | 18 05 34 | 20 30.8 | ||
| IGR J180272016 | HMXB, T, XP | 1 | 9.417 | +1.044 | 18 02 39.9 | 20 17 13 | SAX J1802.72017 | |
| GS 182624 | LMXB, B | 1 | 7,11 | 9.272 | 6.088 | 18 29 28.2 | 23 47 49 | Ginga 182624 |
| GX 9+1 | LMXB, A | 1 | 10 | 9.077 | +1.154 | 18 01 32.3 | 20 31 44 | |
| GX 9+9 | LMXB, A | 1 | 8.513 | +9.038 | 17 31 44.2 | 16 57 42 | 3A 1728169 | |
| 1RXS J175113.3201214 | ? | 1 | 8.145 | +3.408 | 17 51 13.4 | 20 12 14 | ||
| H1745203 | LMXB, G, B | 1,3 | 7.729 | +3.798 | 17 48 53.40 | 20 21 43.0 | in NGC 6440 | |
| IGR J175972201 | LMXB, B, D | 1 | 7.581 | +0.775 | 17 59 46 | 22 00.9 | XTE J1759220 | |
| XTE J1818245 | LMXB?, T | 4 | 10 | 7.441 | 4.196 | 18 18 25.2 | 24 32 31 | |
| 1RXS J174607.8213333 | ? | 5 | 6.367 | +3.734 | 17 46 07.80 | 21 33 33.0 | ||
| GX 51 | LMXB, Z | 1 | 10,12,13 | 5.077 | 1.019 | 18 01 08.2 | 25 04 45 | |
| V1223 Sgr | CV | 1 | 4.958 | 14.355 | 18 55 02.24 | 31 09 48.5 | 1H 1853312 | |
| GRS 1758258 | LMXB, BHC | 1 | 6 | 4.508 | 1.361 | 18 01 12.3 | 25 44 36 | |
| IGR J175442619 | HMXB?, T | 1 | 10,17 | 3.235 | 0.338 | 17 54 25.7 | 26 19 58 | |
| H1820303 | LMXB, G, B, A | 1 | 7 | 2.788 | 7.913 | 18 23 40.45 | 30 21 40.1 | 4U 1820303; in NGC 6624 |
| IGR J173312406 | ?,T | 6 | 2.607 | +4.927 | 17 33 08 | 24 06.8 | ||
| GX 3+1 | LMXB, B, A | 1 | 7 | 2.294 | +0.794 | 17 47 56.0 | 26 33 49 | |
| GX 1+4 | Symb, XP | 1,7 | 10,11 | 1.937 | +4.795 | 17 32 02.16 | 24 44 44.0 | |
| XTE J1807294 | LMXB, T, XP | 1 | 1.935 | 4.273 | 18 06 59.8 | 29 24 30 | ||
| AX J1749.22725 | HMXB, XP | 5 | 1.699 | +0.108 | 17 49 11.6 | 27 25 36 | ||
| AX J1749.12733 | HMXB? | 8 | 1.585 | +0.051 | 17 49 09.0 | 27 33 14 | ||
| XB 1832330 | LMXB, G, B, T | 1 | 7 | 1.531 | 11.372 | 18 35 44.1 | 32 59 29 | in NGC 6652 |
| SLX 1735269 | LMXB, B | 1 | 7 | 0.785 | +2.398 | 17 38 16.00 | 27 00 16.0 | |
| XTE J1748288 | LMXB, T, BHC | 9 | 0.676 | 0.222 | 17 48 05.06 | 28 28 25.8 | ||
| IGR J174752822 | Mol cloud? | 1 | 0.601 | 0.040 | 17 47 12 | 28 26.6 | ||
| EXMS B1709232 | ? | 10 | 0.594 | +9.269 | 17 12 31 | 23 21.2 | ||
| IGR J175072856 | ?,T | 11 | 0.576 | 0.959 | 17 50 44 | 28 56.3 | ||
| Oph Cluster | Cluster | 1 | 0.564 | +9.272 | 17 12 26.0 | 23 22 33 | ||
| IGR J174192802 | ?,T | 12 | 0.345 | +1.164 | 17 41 56.0 | 28 01 54 | ||
| 1E 1743.12843 | LMXB | 1 | 10 | 0.251 | 0.026 | 17 46 19.20 | 28 44 07.0 | |
| SAX J1747.02853 | LMXB, B, T | 1 | 7 | 0.207 | 0.239 | 17 47 02.60 | 28 52 58.9 | |
| IGR J174072808 | ?,T | 13 | 0.115 | +1.341 | 17 40.7 | 28 08 | ||
| SLX 1737282 | LMXB, B | 1 | 7 | 359.995 | +1.201 | 17 40 57.00 | 28 18 36.0 | |
| IGR J174562901 | ? | 1 | 359.930 | 0.048 | 17 45 38.5 | 29 01 15 | AX J1745.62900, Sgr A* | |
| V2400 Oph | CV | 1 | 359.867 | +8.739 | 17 12 36.45 | 24 14 44.6 | RX J1712.62414 | |
| XTE J1817330 | LMXB, T, BHC | 14 | 6 | 359.817 | 7.996 | 18 17 43.54 | 33 01 07.8 | |
| XTE J1739285 | LMXB, T, B | 1,15 | 7 | 359.714 | +1.298 | 17 39 53.95 | 28 29 46.8 | |
| GRS 1741.92853 | LMXB, T, B | 5,16,17 | 7 | 359.612 | +0.734 | 17 41 50 | 28 52 42 | AX J1745.0-2855 |
| SAX J1744.72916 | ? | 18 | 359.600 | 0.009 | 17 44 42 | 29 16.9 | ||
| KS 1741293 | LMXB, T, B | 1 | 7 | 359.584 | 0.087 | 17 44 58 | 29 20.2 | |
| 1A 1742294 | LMXB, B | 1 | 7,9 | 359.559 | 0.389 | 17 46 05.5 | 29 30 55 | |
| SLX 1744299/300 | LMXB, B | 1 | 7 | 359.296 | 0.889 | 17 47 25.9 | 29 59 58 | |
| 1E 1740.72942 | LMXB, BHC | 1 | 6 | 359.116 | 0.106 | 17 43 54.83 | 29 44 42.6 | |
| GRS 1734292 | AGN, Sy1 | 1 | 358.844 | +1.395 | 17 37 24.3 | 29 10 48 | GRS 1734294 in [1] | |
| GRS 1747312 | LMXB, G, T, B | 1,19 | 358.555 | 2.168 | 17 50 45.5 | 31 17 32 | in Terzan 6 | |
| IGR J174603047 | ? | 1 | 358.494 | 1.094 | 17 46 19 | 30 47.5 | Artefact in [26] | |
| IGR J173913021 | HMXB, NS, Be?, T | 1 | 358.068 | +0.445 | 17 39 11.58 | 30 20 37.6 | XTE J1739302 | |
| IGR J172852922 | BHC?, T | 1 | 357.630 | +2.923 | 17 28.5 | 29 22 | ||
| H1743322 | LMXB, T, BHC | 1 | 6 | 357.255 | 1.833 | 17 46 15.61 | 32 13 59.9 | IGR J174643213 |
| Table 1. (continued) | ||||||||
|---|---|---|---|---|---|---|---|---|
| Source | Type | Ref | Fig. | lII | bII | R.A. | Dec | Comment |
| IGR J174883253 | ? | 1 | 356.962 | 2.662 | 17 48 54.71 | 32 54 44.0 | ||
| 3A 1822371 | LMXB, XP, D | 1,20 | 10 | 356.850 | 11.291 | 18 25 46.8 | 37 06 19 | |
| SLX 1746331 | LMXB?, BHC | 5,9 | 356.807 | 2.973 | 17 49 48.50 | 33 12 18.3 | ||
| XTE J1710281 | LMXB, T, B | 1 | 356.357 | +6.922 | 17 10 12.3 | 28 07 54 | ||
| 4U 172230 | LMXB, G, B, A | 1 | 7 | 356.320 | +2.298 | 17 27 33.2 | 30 48 07 | XB 172430; in Terzan 2 |
| IGR J172003116 | ?,T | 1 | 355.022 | +3.346 | 17 20 06.10 | 31 17 02.0 | 1RXS J172006.1311702 | |
| MXB 1730335 | LMXB, G, B, T | 1 | 7 | 354.841 | 0.158 | 17 33 24.10 | 33 23 16.0 | The Rapid Burster; in Liller 1 |
| XTE J1720318 | LMXB, T, BHC | 1 | 354.597 | +3.087 | 17 19 58 | 31 46.8 | ||
| GX 3540 | LMXB, B, A | 1 | 7,8 | 354.302 | 0.150 | 17 31 57.4 | 33 50 05 | 4U 1728337 |
| IGR J172543257 | LMXB?, B | 1,21 | 354.280 | +1.472 | 17 25 25.50 | 32 57 17.5 | 1RXS J172525.5325717 | |
| 1A 1744361 | LMXB, T, B, A? | 1,22 | 354.140 | 4.204 | 17 48 19.22 | 36 07 16.6 | XTE J1748361 | |
| 1H 1746370 | LMXB, G, B, A | 1 | 353.531 | 5.005 | 17 50 12.7 | 37 03 08 | in NGC 6441 | |
| XTE J1743363 | ?,T | 1 | 10 | 353.392 | 3.402 | 17 43 00.0 | 36 20 41 | |
| 4U 170532 | LMXB, B | 1 | 352.794 | +4.681 | 17 08 54.40 | 32 18 57.5 | ||
| IGR J172523616 | HMXB, XP, T | 23,24 | 10 | 351.510 | 0.356 | 17 25 14 | 36 16.4 | EXO 1722363 |
| IGR J170983628 | ?,T | 25 | 10,11 | 349.555 | +2.066 | 17 09 48 | 36 28.2 | |
| IGR J170913624 | BHC? | 1 | 349.519 | +2.215 | 17 09 06 | 36 24.7 | ||
| GX 349+2 | LMXB, Z | 1 | 10 | 349.104 | +2.748 | 17 05 44.5 | 36 25 23 | Sco X-2 |
| SAX J1712.63739 | LMXB, T, B | 1 | 348.935 | +0.928 | 17 12 34.00 | 37 38 36.0 | ||
| 4U 1700377 | HMXB | 1 | 10,11 | 347.754 | +2.173 | 17 03 56.77 | 37 50 38.9 | |
| GRO J165540 | LMXB, T, BH, D | 9 | 6 | 344.982 | +2.456 | 16 54 00.14 | 39 50 44.9 | |
| OAO 1657415 | HMXB, XP | 1 | 10 | 344.354 | +0.311 | 17 00 47.9 | 41 40 23 | |
The data from IBIS/ISGRI are processed until the production of images in the 20–60 and 60–150 keV energy ranges per single pointing.111A single pointing with INTEGRAL is often refered to as a Science Window, or ScW for short. We force the flux extraction of each of the catalogue sources, regardless of the detection significance of the source. This method is essential in order to clean the images from the ghosts of all the active sources in the field, but does not make any threshold selection and all the positive fluxes are recorded (see Goldwurm et al. 2003 for a detailed description of the IBIS analysis software). In order to detect fainter sources, we then mosaic the images from the seven single pointings (i.e., one hexagonal dither observation) and search for all catalog sources, as well as possible new ones. In the case a new source is found, it can be added to the input catalogue, and a re-analysis is necessary to extract its source fluxes. To achieve even higher sensitivity, we also produced one mosaic image per season as well as a global (3 seasons) mosaic image from the whole AO-3 monitoring program.
For JEM-X the analysis is run through the imaging step to the light-curve step. Light curves with a time bin of the same length as each single pointing are produced for every catalog source inside a radius of 5∘. The analysis software used to extract light curves has a known problem in crowded fields like the Galactic bulge, as the contribution from bright sources (such as GX 51) is not modeled in sufficient detail which affects the results for weak sources (typically less than about 100 mCrab) close to very bright ones. Although no detailed quantitative analysis has been done yet, comparisons with the results from JEM-X imaging as well as with results from other X-ray instruments in the same energy range, leads us to the conclude that there is an uncertainty in the fluxes by up to a factor of 2. Again, the images from the seven single pointings are mosaiced in order to create the final image. No further automatic source detection is done for the moment at the mosaic level; however, the images are visually examined for possible new sources.
Type I X-ray bursts (see, e.g., Strohmayer & Bildsten 2006) are mainly seen in the soft X-ray band, since the observed black-body temperatures are 1–3 keV. We use JEM-X to search for such events. Per single pointing we compute the average detector count rate and the corresponding standard deviation. Whenever the difference between the count rate in a 1-second bin and the average count rate exceeds four times the standard deviation value, we flag it as a potential start of a burst. Recontructed images and source light curves are generated within the good-time interval covering the burst event, and are visually checked in order to identify the originating source of the event. The light curves are also visually checked to see whether they adhere to the basic characteristics of a type I X-ray burst, i.e., emitting mainly at the lowest energies (e.g., to exclude solar flares), with a light-curve shape consistent with a fast rise – with respect to the decay – and exponential-like decay. Whenever the statistics do allow we also check whether the events show evidence for a spectral softening, due to cooling of the neutron surface, during the decay. In the present paper we only briefly mention the occurrence of type I X-ray bursts, for those sources which were in the field of view of JEM-X, when discussing the long-term light curves. A more detailed (time-resolved) burst analysis is in progress (Sanchez-Fernandez et al., in preparation). We here note that an account of type I X-ray bursts, including those seen from sources in the Galactic bulge region, in earlier INTEGRAL data based on IBIS/ISGRI was reported by Chelovekov et al. (2006).
All fluxes used in this paper are given with respect to the Crab count rate in the respective energy ranges (see Appendix A), i.e., in units of mCrab. Our sensitivity for one hexagonal dither observation (i.e., all seven single pointings per revolution combined) is typically between 5 and 15 mCrab (5) for both JEM-X and IBIS/ISGRI. The actual sensitivity depends on factors such as source position (fully or partially coded field of view), background (instrument systematics, solar activity), number of pointings actually performed and usable, and energy (instrument response). We refer to Appendix B for more details. Errors in this paper are quoted at the 1 level. When a source is not detected, we provide 3 upper limits, whenever appropriate. The latter are calculated by determining the variance value in the mosaic maps at a given source position, taking the square root of this value and multiply it by 3. Note that the variances respresent statistical values, and do not include any systematics.
From the end of August up to mid September 2005 (revolutions 349–357; MJD 53605–53630) there was a high solar activity and various solar flares hampered the observations. During some of the observations the instruments were even off (revolutions 349, 355 and 356; MJD 53605, 53624, 53626, respectively). Note that in a few revolutions no monitoring was done, either due to Crab calibration (see Appendix A) or target-of-opportunity observations (revolutions 300, 352, 422–423; MJD 53458–53460, MJD 53613–53616, MJD 53823–53828, respectively). Some single pointings were lost due to other reasons, such as ground station outages. The total net observing time was 727 ks.
| Source | OMC identifier | Period |
|---|---|---|
| GRS 1758258 | IOMC 6846000121 | II |
| IGR J175442619 | IOMC 6849000050 | II |
| GX 3+1 | IOMC 6836000093 | II |
| SLX 1735269 | IOMC 6835000362 | I,II |
| XTE J1748288 | IOMC 6840000094 | II |
| IGR J174752822 | IOMC 6840000103 | II |
| 1E 1743.12843 | IOMC 6840000034 | I,II |
| SAX J1747.02853 | IOMC 6840000039 | II |
| IGR J174072808 | IOMC 6839000184 | I,II |
| SLX 1737282 | IOMC 6839000170 | II |
| IGR J174562901 | IOMC 6840000098 | I,II |
| SAX J1744.72916 | IOMC 6840000084 | I,II |
| KS 1741293 | IOMC 6840000085 | I,II |
| 1A 1742294 | IOMC 6840000080 | I,II |
| SLX 1744299 | IOMC 6840000042 | II |
| 1E 1740.72942 | IOMC 6840000077 | I,II |
| GRS 1734292 | IOMC 6839000175 | I,II |
| IGR J174603047 | IOMC 7377000086 | II |
| IGR J173913021 | IOMC 7376000097 | I,II |
| IGR J172852922 | IOMC 6838000560 | I,II |
| H1743322 | IOMC 7381000052 | II |
| IGR J174883253 | IOMC 7381000160 | II |
| SLX 1746331 | IOMC 7381000150 | II |
| 4U 172230 | IOMC 7375000273 | I,II |
For each INTEGRAL pointing, the OMC monitors the sources in its field of view by means of shots of variable integration time. Typical values in the range 10 to 200 s (currently 10, 50 and 200 s) are used to optimize sensitivity, and to minimize read-out noise and cosmic-ray effects. For the faintest objects, several 200 s exposures in the same pointing can be combined during data analysis on the ground. Telemetry constraints do not allow to download the entire OMC image. For this reason, windows are selected around the proposed X-ray/-ray targets as well as other targets of interest in the same field of view. Only sub-windows of the CCD with a size of 11x11 pixels (3.2’x3.2’) containing those objects are transmitted to ground. For extended sources or sources with poor precision in their coordinates, a mosaic of such sub-windows are set around the source position to cover the entire error circle. The sources in the Galactic bulge region being monitored by the OMC are indicated in Table 2. Since revolution 421 (March 25, 2006; MJD 53819) onwards, the OMC instrument is operating with a new Input Catalogue (version 0005). Using this catalogue, OMC monitors all sources detected by IBIS/ISGRI (Bird et al. 2006) in the Galactic bulge which fall in its field of view.
The OMC data of the whole period has been processed with an updated OMC Off-line Scientific Analysis software.222The updated software will be included in OSA 6.0. The full analysis has been working in an automatic way since the third season of the Galactic bulge monitoring, i.e., revolutions 406–429 (February to April 2006; MJD 53775–53846). Light curves are produced in a short period of time, usually less than 24 hr after the observation is performed. Since the Galactic bulge region is a very crowded field for the OMC, in the flux extraction process we force the photometric aperture to be centred at the source coordinates, which are taken from the OMC Input Catalogue. This allows us to monitor not only the sources already detected by OMC, but also those previously undetected that could show, for example, bright flares detectable occasionally by OMC. Obviously, having accurate source coordinates is very important to obtain reliable results.
OMC’s typical limiting magnitude in the Galactic bulge observations is between V=15 and 16 mag (3). The actual value depends on sky background and source contamination, which can be very important in this region. We obtain one photometric point per OMC shot for each source. To increase the signal to noise of weak sources, we combine the individual photometric points in the hexagonal dither observation.
4 Results
The results we present in this Section are organized in two main subsections, one focussing on the seasonal and overall source behaviour of all sources in our sample and another on the source variability.
4.1 IBIS/ISGRI and JEM-X mosaic images
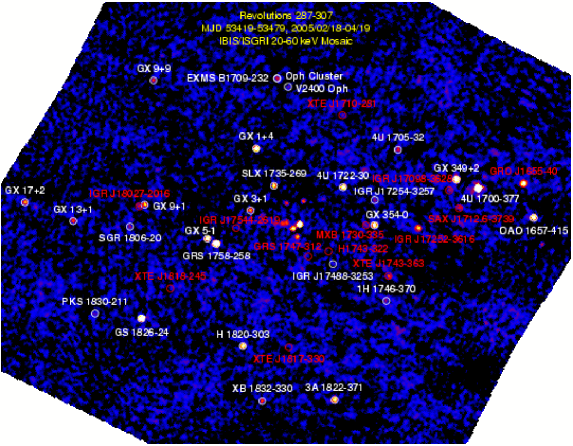
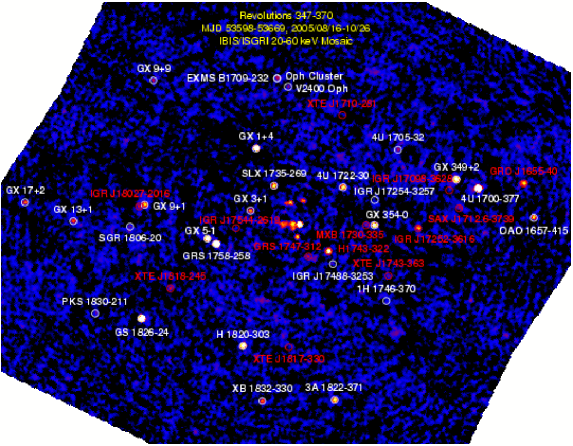
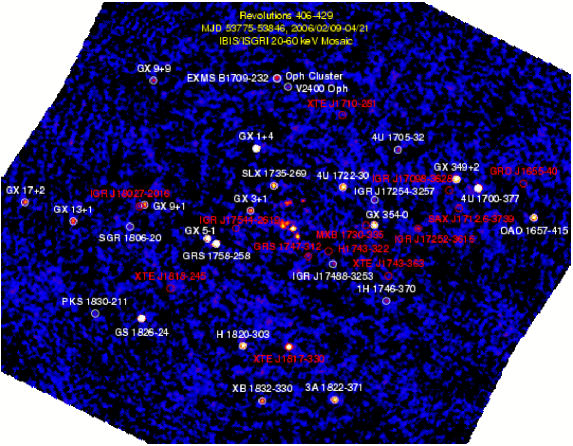
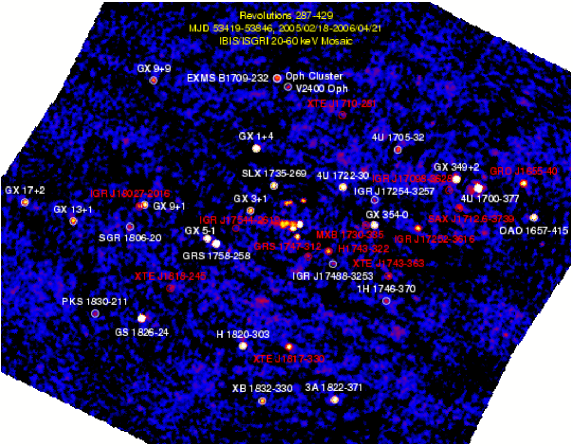
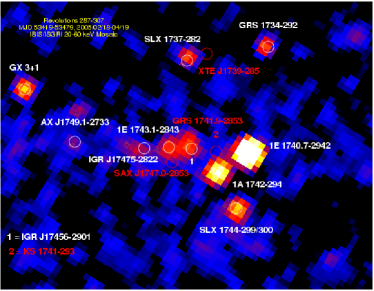
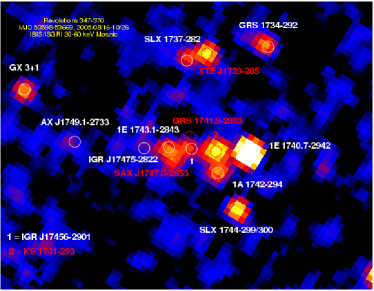
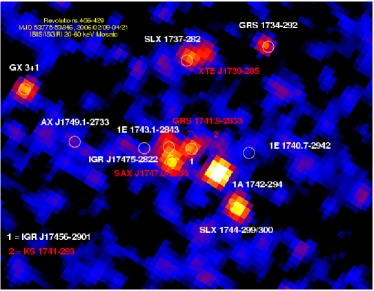
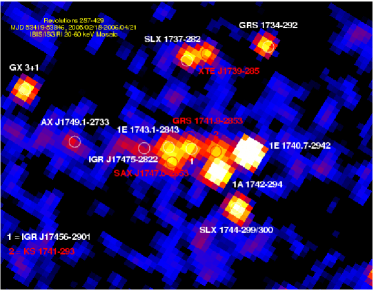
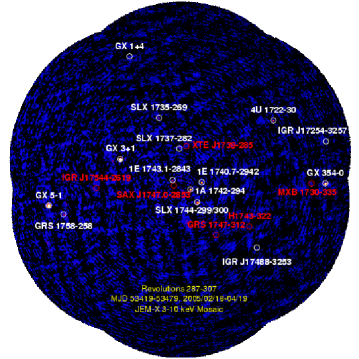
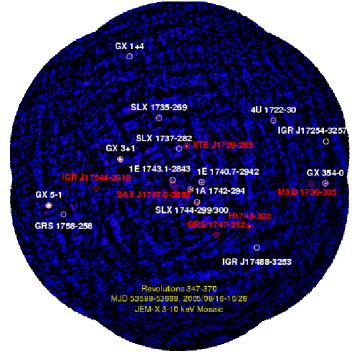
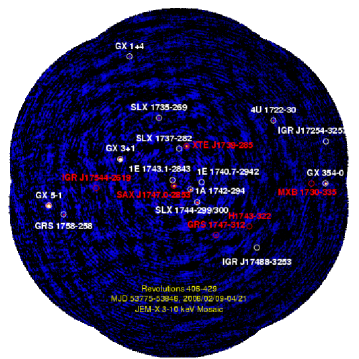
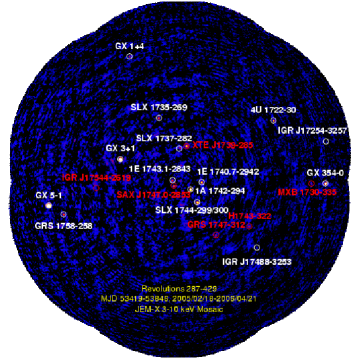
We show four IBIS/ISGRI (20–60 keV) mosaic significance images, one for each season and a total one, i.e., of all the pointings together, in Figs. 1 and 2. Since the Galactic Center region (in the middle of the figure) contains a considerable amount of hard X-ray sources close together, we zoom in on this region in Fig. 3. Similarly, JEM-X (3–10 keV) significance mosaic images for the three seasons and all the pointings together are shown in Fig. 4. Since annotating all the sources in our sample on the IBIS/ISGRI and JEM-X images would make them unreadable, we chose to label only the sources with a significance of 7 or higher in the 20–60 keV data during either a single hexagonal dither observation, during one season, or during all seasons combined (see Table 3). This results in the inclusion of fast transients that only appear within one or a couple of hexagonal dither observations, transients which show outbursts on week to month time scales, and all persistent sources. To avoid crowdedness of source names in the JEM-X images near the Galactic center we did not annotate all sources in that region.
The source detection significances and corresponding average fluxes are given in Tables 3 (20–60 keV) and 4 (60–150 keV). When a source is not detected we provide 3 upper limits. We additionally give the highest detection significance reached of all the single hexagonal dither observations; these are used to determine whether long-term light curves are shown or not (see Sect. 4.2). In Table 4 we show information only for those sources which were detected above a significance level of 7 in the 60–150 keV band, either in a single hexagonal dither observation, in the average mosaic per season, or in the mosaic of all observations. In Table 5 we give some information for each of the JEM-X mosaic images, such as raw and effective exposure time at the center of the images and which sources are visible above a detection limit of 3. Unfortunately, the current JEM-X analysis software does not allow us to extract accurate flux information from the mosaic images as is the case for IBIS/ISGRI.
| Sigrev,max | Sigs1 | Sigs2 | Sigs3 | Sigall | |||||
|---|---|---|---|---|---|---|---|---|---|
| Source | (mCrab) | (mCrab) | (mCrab) | (mCrab) | |||||
| GX 17+2 | 12.2 | 21.2 | 52.4 2.5 | 17.7 | 41.5 2.3 | 20.1 | 45.7 2.3 | 33.0 | 46.3 1.4 |
| SAX J1818.61703 | 5.5 | — | 2.6 | — | 2.6 | — | 2.6 | — | 1.5 |
| GX 13+1 | 7.2 | 13.2 | 10.4 0.8 | 10.9 | 8.5 0.8 | 16.7 | 13.4 0.8 | 24.0 | 11.0 0.5 |
| PKS 1830211 | 4.7 | 5.6 | 4.3 0.8 | 5.6 | 4.3 0.7 | 5.2 | 4.3 0.8 | 8.6 | 3.7 0.4 |
| SGR 180620 | 4.7 | 6.6 | 3.0 0.4 | 5.7 | 2.4 0.4 | 5.1 | 2.4 0.5 | 9.6 | 2.4 0.2 |
| SAX J1805.52031 | — | — | 1.3 | — | 1.3 | — | 1.3 | — | 0.8 |
| IGR J180272016 | 5.5 | 9.4 | 4.3 0.5 | 8.1 | 3.7 0.5 | 7.1 | 3.0 0.4 | 15.9 | 3.7 0.2 |
| GS 182624 | 45.4 | 136.5 | 72.0 0.5 | 162.3 | 86.6 0.5 | 153.8 | 81.1 0.5 | 259.2 | 79.9 0.3 |
| GX 9+1 | 9.6 | 26.7 | 11.0 0.4 | 18.9 | 7.9 0.4 | 22.5 | 9.1 0.4 | 40.7 | 9.8 0.2 |
| GX 9+9 | 6.4 | 14.2 | 9.8 0.7 | 8.7 | 6.1 0.7 | 11.2 | 7.9 0.7 | 19.8 | 7.9 0.4 |
| 1RXS J175113.3201214 | — | 5.8 | 2.4 0.4 | — | 1.3 | 5.4 | 2.4 0.4 | 6.6 | 1.8 0.2 |
| H1745203 | — | — | 1.2 | — | 1.2 | — | 1.2 | — | 0.7 |
| IGR J175972201 | 6.1 | — | 1.1 | — | 1.1 | 4.9 | 1.8 0.4 | — | 0.6 |
| XTE J1818245 | 15.6 | — | 1.2 | 10.6 | 4.3 0.4 | — | 1.2 | 8.8 | 1.8 0.2 |
| 1RXS J174607.8213333 | — | — | 1.1 | — | 1.2 | — | 1.1 | — | 0.7 |
| GX 51 | 48.7 | 73.9 | 23.2 0.3 | 104.9 | 33.5 0.3 | 108.6 | 34.8 0.3 | 166.8 | 30.5 0.2 |
| V1223 Sgr | 4.5 | 5.3 | 10.4 2.0 | — | 5.6 | 4.5 | 7.9 1.8 | 5.8 | 6.7 1.1 |
| GRS 1758258 | 68.5 | 212.6 | 65.2 0.3 | 230.2 | 72.6 0.3 | 182.4 | 56.1 0.3 | 361.7 | 64.6 0.2 |
| IGR J175442619 | 15.3 | — | 0.9 | — | 0.9 | — | 0.9 | — | 0.5 |
| H1820303 | 50.9 | 48.5 | 20.1 0.4 | 70.7 | 29.3 0.4 | 54.0 | 22.0 0.4 | 100.0 | 23.8 0.2 |
| IGR J173312406 | — | — | 1.0 | — | 1.0 | — | 1.0 | — | 0.6 |
| GX 3+1 | 7.4 | 22.3 | 6.7 0.3 | 18.9 | 5.5 0.3 | 20.4 | 6.1 0.3 | 35.2 | 6.1 0.2 |
| GX 1+4 | 56.2 | 84.8 | 26.8 0.3 | 110.0 | 35.4 0.3 | 170.9 | 55.5 0.3 | 210.4 | 39.0 0.2 |
| XTE J1807294 | — | — | 0.9 | — | 1.0 | — | 1.0 | — | 0.6 |
| AX J1749.22725 | — | — | 0.9 | 4.9 | 1.2 0.3 | — | 0.9 | — | 0.5 |
| AX J1749.12733 | 6.8 | 5.6 | 1.8 0.3 | — | 0.9 | 3.8 | 1.2 0.3 | 7.4 | 1.2 0.2 |
| XB 1832330 | 7.6 | 14.3 | 7.9 0.5 | 15.6 | 9.1 0.5 | 19.9 | 11.0 0.5 | 28.8 | 9.8 0.3 |
| SLX 1735269 | 11.9 | 42.8 | 12.2 0.3 | 39.0 | 11.6 0.3 | 36.7 | 11.0 0.3 | 68.8 | 11.6 0.2 |
| XTE J1748288 | — | — | 0.9 | — | 0.9 | — | 0.9 | — | 0.5 |
| IGR J174752822 | 5.2 | 9.0 | 2.4 0.3 | — | 0.9 | 4.5 | 1.2 0.3 | 8.8 | 1.2 0.1 |
| EXMS B1709232 | 6.4 | 9.3 | 3.7 0.4 | 7.9 | 3.0 0.4 | — | 1.2 | 15.1 | 3.7 0.2 |
| IGR J175072856 | — | — | 0.9 | — | 0.8 | — | 0.9 | — | 0.5 |
| Oph Cluster | 4.4 | — | 1.2 | — | 1.3 | 10.2 | 4.3 0.4 | — | 0.7 |
| IGR J174192802 | 5.0 | — | 0.9 | — | 0.9 | 5.0 | 1.2 0.2 | — | 0.5 |
| 1E 1743.12843 | 8.0 | — | 0.9 | 16.5 | 4.3 0.2 | — | 0.8 | 24.4 | 4.3 0.2 |
| SAX J1747.02853 | 15.2 | — | 0.9 | — | 0.8 | 21.8 | 6.1 0.3 | — | 0.5 |
| IGR J174072808 | 4.6 | — | 0.9 | — | 0.9 | — | 0.9 | — | 0.5 |
| SLX 1737282 | 7.0 | 14.1 | 4.3 0.3 | — | 0.9 | 15.2 | 4.3 0.3 | 23.5 | 3.7 0.2 |
| IGR J174562901 | 5.9 | — | 0.9 | — | 0.8 | 14.5 | 4.3 0.3 | — | 0.5 |
| V2400 Oph | 5.3 | 6.2 | 2.4 0.4 | 6.1 | 2.4 0.4 | 7.1 | 3.0 0.4 | 11.2 | 2.4 0.2 |
| XTE J1817330 | 53.2 | — | 1.0 | — | 1.2 | 79.6 | 29.9 0.4 | 47.7 | 10.4 0.2 |
| XTE J1739285 | 13.7 | — | 0.9 | 22.3 | 6.1 0.3 | — | 0.9 | — | 0.5 |
| GRS 1741.92853 | 9.6 | — | 0.9 | — | 0.8 | — | 0.9 | 13.9 | 2.4 0.2 |
| SAX J1744.72916 | 5.1 | — | 0.9 | — | 0.9 | 4.9 | 1.2 0.2 | — | 0.5 |
| KS 1741293 | 19.3 | 5.3 | 1.2 0.2 | 28.1 | 7.9 0.3 | — | 0.9 | 19.7 | 3.0 0.2 |
| 1A 1742294 | 25.5 | 41.5 | 11.6 0.3 | 12.6 | 3.7 0.3 | 63.1 | 18.3 0.3 | 68.0 | 11.0 0.2 |
| SLX 1744299/300 | 9.8 | 20.1 | 6.1 0.3 | 26.6 | 7.9 0.3 | 26.8 | 7.9 0.3 | 42.0 | 7.3 0.2 |
| 1E 1740.72942 | 47.1 | 162.4 | 45.7 0.3 | 139.5 | 39.6 0.3 | — | 0.8 | 173.1 | 28.7 0.2 |
| GRS 1734292 | 6.6 | 15.3 | 4.3 0.3 | 16.9 | 4.9 0.3 | 15.5 | 4.3 0.3 | 28.0 | 4.9 0.2 |
| GRS 1747312 | 6.0 | — | 0.9 | 9.0 | 2.4 0.3 | 9.2 | 2.4 0.3 | 11.5 | 1.8 0.2 |
| IGR J174603047 | — | — | 0.9 | — | 0.9 | — | 0.9 | — | 0.5 |
| IGR J173913021 | 4.3 | — | 0.9 | — | 0.9 | — | 0.9 | — | 0.5 |
| IGR J172852922 | 4.0 | — | 0.9 | — | 0.9 | — | 0.9 | — | 0.5 |
| H1743322 | 49.7 | — | 0.9 | 50.4 | 15.2 0.3 | — | 0.9 | 27.9 | 4.9 0.2 |
| IGR J174883253 | 4.4 | — | 0.9 | — | 0.9 | 8.5 | 2.4 0.3 | 9.4 | 1.8 0.2 |
| 3A 1822371 | 14.1 | 39.3 | 22.6 0.5 | 31.8 | 18.3 0.6 | 35.1 | 20.1 0.5 | 61.8 | 20.1 0.3 |
| SLX 1746331 | — | — | 0.9 | — | 0.9 | — | 0.9 | — | 0.5 |
| XTE J1710281 | 5.6 | 6.5 | 2.4 0.4 | — | 1.2 | 5.6 | 2.4 0.4 | 8.5 | 1.8 0.2 |
| 4U 172230 | 18.0 | 60.3 | 18.3 0.3 | 36.8 | 11.6 0.3 | 41.5 | 12.8 0.3 | 80.1 | 14.0 0.2 |
| IGR J172003116 | — | 6.3 | 1.8 0.3 | — | 1.0 | — | 1.0 | 6.6 | 1.2 0.2 |
| MXB 1730335 | 12.2 | 6.5 | 1.8 0.3 | 6.4 | 1.8 0.3 | — | 1.0 | 7.9 | 1.2 0.2 |
| Table 3 (continued). | |||||||||
|---|---|---|---|---|---|---|---|---|---|
| Sigrev,max | Sigs1 | Sigs2 | Sigs3 | Sigall | |||||
| Source | (mCrab) | (mCrab) | (mCrab) | (mCrab) | |||||
| XTE J1720318 | — | — | 1.0 | — | 1.0 | — | 1.0 | — | 0.6 |
| GX 3540 | 48.1 | 69.2 | 22.0 0.3 | 71.1 | 23.2 0.3 | 83.0 | 26.8 0.3 | 128.8 | 24.4 0.2 |
| IGR J172543257 | — | 6.7 | 1.8 0.3 | — | 1.0 | 6.2 | 1.8 0.3 | 8.0 | 1.2 0.2 |
| 1A 1744361 | — | — | 1.1 | — | 1.1 | — | 1.1 | — | 0.6 |
| 1H 1746370 | 5.5 | 6.2 | 2.4 0.4 | — | 1.2 | 6.5 | 2.4 0.4 | 9.0 | 1.8 0.2 |
| XTE J1743363 | 9.1 | 14.4 | 5.5 0.4 | 6.0 | 2.4 0.4 | — | 1.2 | 13.1 | 3.0 0.2 |
| 4U 170532 | 5.1 | 10.3 | 4.3 0.4 | 6.8 | 3.0 0.4 | 8.0 | 3.0 0.4 | 13.7 | 3.0 0.2 |
| IGR J172523616 | 36.2 | 28.7 | 11.6 0.4 | 23.9 | 9.8 0.4 | 10.3 | 4.3 0.4 | 36.8 | 8.5 0.2 |
| IGR J170983628 | 23.8 | 8.7 | 4.3 0.5 | — | 1.5 | — | 1.5 | 7.4 | 2.4 0.3 |
| IGR J170913624 | — | — | 1.5 | — | 1.5 | — | 1.5 | — | 0.9 |
| GX 349+2 | 24.5 | 70.7 | 36.6 0.5 | 51.7 | 28.0 0.5 | 57.9 | 30.5 0.5 | 103.3 | 31.7 0.3 |
| SAX J1712.63739 | 5.6 | 10.1 | 5.5 0.5 | 6.4 | 3.7 0.5 | — | 1.6 | 11.6 | 3.7 0.3 |
| 4U 1700377 | 194.5 | 344.5 | 214.0 0.6 | 268.9 | 174.4 0.7 | 216.9 | 137.2 0.6 | 481.5 | 176.2 0.4 |
| GRO J165540 | 71.7 | 55.9 | 59.8 1.0 | 24.3 | 27.4 1.2 | — | 3.3 | 47.9 | 29.9 0.6 |
| OAO 1657415 | 26.9 | 62.2 | 87.8 1.4 | 27.2 | 39.6 1.5 | 42.8 | 58.5 1.3 | 75.9 | 62.8 0.9 |
| Sigrev,max | Sigs1 | Sigs2 | Sigs3 | Sigall | |||||
|---|---|---|---|---|---|---|---|---|---|
| Source | (mCrab) | (mCrab) | (mCrab) | (mCrab) | |||||
| GS 182624 | 11.0 | 29.5 | 12.2 0.4 | 33.7 | 13.4 0.4 | 30.2 | 12.2 0.4 | 53.6 | 12.8 0.2 |
| GRS 1758258 | 28.9 | 95.3 | 23.8 0.2 | 103.4 | 26.2 0.2 | 79.5 | 19.5 0.2 | 161.3 | 23.2 0.1 |
| GX 1+4 | 9.3 | 14.1 | 3.7 0.2 | 18.1 | 4.9 0.2 | 23.3 | 6.1 0.2 | 31.8 | 4.9 0.1 |
| XB 1832330 | 4.3 | 6.2 | 3.0 0.4 | 4.1 | 1.8 0.4 | 8.0 | 3.7 0.4 | 10.2 | 2.4 0.2 |
| SLX 1735269 | 5.2 | 10.0 | 2.4 0.2 | 9.8 | 2.4 0.2 | 10.0 | 2.4 0.2 | 16.7 | 2.4 0.1 |
| XTE J1817330 | 11.1 | — | 3.4 | — | 3.4 | 22.1 | 6.7 0.3 | 12.6 | 2.4 0.2 |
| 1A 1742294 | 5.0 | 6.1 | 1.2 0.2 | — | 2.8 | 9.4 | 2.4 0.2 | 7.6 | 1.2 0.2 |
| SLX 1744299/300 | 4.4 | — | 2.7 | 6.7 | 1.8 0.2 | 5.4 | 1.2 0.2 | 8.2 | 1.2 0.1 |
| 1E 1740.72942 | 19.8 | 58.8 | 14.0 0.2 | 50.1 | 11.6 0.2 | — | 2.7 | 61.9 | 8.5 0.1 |
| H1743322 | 13.2 | — | 2.7 | 15.4 | 3.7 0.2 | — | 2.8 | 9.6 | 1.2 0.1 |
| 4U 172230 | 5.4 | 11.7 | 3.0 0.2 | 7.1 | 1.8 0.2 | 6.9 | 1.8 0.2 | 15.2 | 2.4 0.1 |
| IGR J170983628 | 10.0 | — | 4.2 | — | 4.5 | — | 4.3 | — | 2.5 |
| 4U 1700377 | 33.7 | 48.0 | 22.0 0.4 | 40.0 | 19.5 0.5 | 28.4 | 13.4 0.5 | 67.7 | 18.3 0.2 |
| GRO J165540 | 21.4 | 23.0 | 17.1 0.7 | 9.4 | 7.3 0.8 | — | 8.7 | 18.6 | 7.9 0.4 |
| Season | 1 | 2 | 3 | all |
|---|---|---|---|---|
| Revs | 287–307 | 347–370 | 406–429 | 287–429 |
| # ScWs | 132 | 118 | 141 | 391 |
| (ks) | 200 | 180 | 195 | 578 |
| (ks) | 135 | 122 | 130 | 379 |
| Source | Detection significances [3–10]/[10–25] keV | |||
| GX 51 | 150/62 | 174/82 | 158/79 | 276/97 |
| GRS 1758258 | 8.4/14 | 8.4/14 | 8.5/12 | 14/17 |
| GX 3+1 | 150/71 | 135/57 | 154/76 | 259/94 |
| GX 1+4 | 3.8/6.9 | 7.5/10 | 8.6/11.1 | 11/15 |
| SLX 1735269 | 8.3/9.9 | 11/8.4 | 7.3/15 | 15/11 |
| 1E 1743.12843 | 9.0/7.7 | 10/8.6 | 5.6/4.1 | 14/9.2 |
| SAX J1747.02853 | –/– | 9.0/– | 23/14 | 16/7.4 |
| SLX 1737282 | 4.7/4.0 | –/– | 3.9/5.1 | 7.3/6.6 |
| XTE J1739285 | –/– | 20/13 | 21/12 | 24/10 |
| 1A 1742294 | 28/24 | 39/28 | 25/31 | 57/38 |
| SLX 1744229/300 | 18/12 | 15/11 | 12/10 | 26/15 |
| 1E 1740.72942 | 20/24 | 19/32 | –/– | 22/29 |
| GRS 1747312 | –/– | 7.6/4.4 | 5.7/4.0 | 8.0/3.9 |
| GRS 1734292 | –/– | –/– | –/– | 4.6/5.3 |
| H1743322 | –/– | 18/8.9 | –/– | 9.3/3.7 |
| 4U 172230 | 14/13 | 14/11 | 11/7.0 | 23/14 |
| MXB 1730335 | 4.4/– | 5.1/3.4 | –/– | 5.7/– |
| GX 3540 | 44/29 | 32/20 | 41/28 | 72/35 |
Most of the bright well-known persistent and transient X-ray binaries are easily detected in either or all of the four JEM-X and IBIS/ISGRI 20–60 keV mosaic images. Note that 1E 1740.72942, normally one of the brightest sources in the Galactic center region, turned off during the whole third season (see Sects. 4.3 and 6). Some of the fast transients were not detected in the mosaics per season or for the whole period (such as IGR J175442619). Some of the weaker sources are detected during every season’s average (e.g., IGR J180272016, GX 9+9, GRS 1734292); some are only detected during one or two season averages (e.g., 1E 1743.12843, IGR 174562901). The latter is also true for some of the transient sources, such as IGR J174752822, GRS 1747312 [in Terzan 6], and SAX J1712.63739. We note that IGR 174562901 (or a source coincident with it) was detected during the third season when the 1E 1740.72942 and neighbouring sources were off (see Sect. 4.3). Sources detected only in the average over the whole monitoring period include various kinds of sources, such as PKS 1830211 (AGN), V2400 Oph (cataclysmic variable), XTE J1710281 (low-mass X-ray binary).
From Table 4 we see that only about a dozen sources are visible at 60–150 keV. Different kinds of sources are detected at these energies, such as 1E 1740.72942 (black-hole candidate), GRO J165540 (transient black-hole binary), GS 182624 (X-ray burster), and 4U 1700377 (high-mass X-ray binary).
EXMS B1709232 was detected in the first two seasons, while the Oph Cluster was only detected in the third season. These two sources are only 1.7’ apart and can, therefore, not be resolved by IBIS/ISGRI. For this reason we attribute the observed flux from only one source which we label Oph Cluster (see also Bird et al. 2006).
Of the weak sources mentioned above, only the persistent sources 1E 1743.12843 (low-mass X-ray binary) and GRS 1734292 (AGN), and the transient low-mass X-ray binary GRS 1747312, are detected by JEM-X (see Table 5). GRS 1747312 was also seen in JEM-X mosaics of our individual hexagonal dither observations near the start of the third season (Chenevez et al. 2006a), consistent with the fact that it shows outbursts roughly every 4.5 months (in ’t Zand et al. 2003). It was barely detected in the IBIS/ISGRI mosaic of the individual hexagonal dither observation at the same time (at 6, 11 mCrab, 20–60 keV).
4.2 Source variability

To further explore the overall hard X-ray variability of the sources we computed the mean flux over the whole program, as well as the error in the mean and standard deviation, both for the 20–60 keV and the 60–150 keV bands. They are given in Table 6. The mean flux is calculated by averaging the flux values (weighted by their errors) from all the single pointings. This approach allows us to evaluate the source variability that is expressed in the standard deviation given in Table 6. Note that in this case the mean flux is not the same as the average value obtained from the mosaic image of the three seasons together, discussed in Sect. 4.1 and shown in Table 3. They are slightly overestimated with respect to the values obtained from the mosaic image, as discussed in Appendix C.
In general, Table 6 shows that the standard deviation values () strongly correlate with the mean fluxes (). It is, therefore, more appropriate to evaluate the relative standard deviations (/). In Fig. 5 we plot the relative standard deviation versus the mean flux in the 20–60 keV band () for those sources which reached a significance higher than 7 in either one or more single hexagonal pointing, or in one season, or in all three seasons together (see Table 3). We grouped the sources among source type: black-hole (candidate) binaries, X-ray bursters, X-ray pulsars, other low-mass X-ray binaries (i.e., those which are not members of the former groups), and other, miscellaneous, sources. The different source types are shown with different symbols. All types of sources span more or less the same variability range. The transient sources are the most variable sources (i.e., /1). Most bright (20 mCrab) persistent sources have / values of around 0.5. Two persistent bright sources are outliers and vary little on long time scales; they have /0.15. These are GRS 1758258, a black-hole candidate, and GS 182624, an X-ray burster.
| Source | (mCrab) | (mCrab) | ||
|---|---|---|---|---|
| GX 17+2 | 55.9 1.9 | 32.0 | 44.3 6.9 | 42.8 |
| SAX J1818.61703 | 11.1 0.9 | 13.5 | 29.0 2.5 | 31.7 |
| GX 13+1 | 15.8 0.7 | 14.1 | 30.7 2.3 | 34.8 |
| PKS 1830211 | 11.1 0.7 | 12.1 | 30.0 2.2 | 35.4 |
| SGR 180620 | 7.1 0.4 | 7.0 | 17.8 1.3 | 14.6 |
| SAX J1805.52031 | 5.2 0.5 | 4.8 | 17.0 1.2 | 13.6 |
| IGR J180272016 | 7.6 0.4 | 6.2 | 17.6 1.3 | 19.4 |
| GS 182624 | 84.2 0.4 | 13.3 | 53.5 1.1 | 27.0 |
| GX 9+1 | 12.2 0.3 | 8.2 | 16.0 1.2 | 24.7 |
| GX 9+9 | 11.8 0.6 | 11.6 | 24.5 2.0 | 27.4 |
| 1RXS J175113.3201214 | 6.2 0.4 | 4.8 | 16.2 1.3 | 15.8 |
| H1745203 | 4.9 0.5 | 4.6 | 15.7 1.3 | 17.8 |
| IGR J175972201 | 5.5 0.4 | 4.1 | 14.1 1.1 | 14.0 |
| XTE J1818245 | 8.6 0.4 | 10.4 | 18.4 1.2 | 17.2 |
| 1RXS J174607.8213333 | 4.5 0.4 | 7.0 | 15.3 1.2 | 14.2 |
| GX 51 | 34.2 0.2 | 21.6 | 13.1 1.0 | 10.7 |
| V1223 Sgr | 15.1 1.7 | 11.3 | 45.6 4.9 | 26.0 |
| GRS 1758258 | 71.0 0.2 | 11.0 | 97.9 0.7 | 21.6 |
| IGR J175442619 | 4.9 0.3 | 6.0 | 11.8 1.0 | 10.2 |
| H1820303 | 26.3 0.3 | 15.6 | 17.1 1.2 | 18.4 |
| IGR J173312406 | 4.4 0.3 | 4.0 | 13.4 1.0 | 16.6 |
| GX 3+1 | 7.9 0.2 | 4.6 | 11.1 1.0 | 9.8 |
| GX 1+4 | 44.0 0.2 | 20.4 | 26.0 0.8 | 15.7 |
| XTE J1807294 | 4.4 0.3 | 8.2 | 12.9 1.0 | 11.7 |
| AX J1749.22725 | 3.6 0.3 | 3.1 | 8.6 1.0 | 10.4 |
| AX J1749.12733 | 4.8 0.3 | 4.7 | 10.0 1.1 | 24.0 |
| XB 1832330 | 11.8 0.5 | 9.0 | 25.9 1.5 | 22.4 |
| SLX 1735269 | 12.7 0.2 | 5.5 | 15.7 0.8 | 17.2 |
| XTE J1748288 | 4.1 0.3 | 5.4 | 9.7 1.0 | 12.9 |
| IGR J174752822 | 4.5 0.3 | 3.9 | 11.3 1.0 | 11.4 |
| EXMS B1709232 | 7.3 0.4 | 5.5 | 17.7 1.4 | 15.8 |
| IGR J175072856 | 4.2 0.3 | 3.5 | 11.1 1.0 | 9.0 |
| Oph Cluster | 5.4 0.5 | 4.2 | 10.3 2.0 | 10.3 |
| IGR J174192802 | 4.2 0.3 | 3.9 | 12.0 1.0 | 10.3 |
| 1E 1743.12843 | 5.1 0.3 | 4.4 | 9.9 1.0 | 11.2 |
| SAX J1747.02853 | 7.5 0.3 | 6.8 | 10.3 0.9 | 11.8 |
| IGR J174072808 | 4.2 0.3 | 3.8 | 10.0 1.0 | 10.6 |
| SLX 1737282 | 5.4 0.3 | 4.1 | 10.7 1.0 | 10.8 |
| IGR J174562901 | 5.4 0.4 | 4.5 | 7.0 1.4 | 8.6 |
| V2400 Oph | 6.7 0.4 | 4.9 | 15.1 1.2 | 12.8 |
| XTE J1817330 | 35.2 0.5 | 25.7 | 34.9 1.6 | 21.5 |
| XTE J1739285 | 7.9 0.3 | 6.2 | 12.2 1.0 | 13.0 |
| GRS 1741.92853 | 4.7 0.3 | 5.6 | 10.4 1.0 | 10.0 |
| SAX J1744.72916 | 4.3 0.4 | 5.0 | 10.7 1.2 | 12.5 |
| KS 1741293 | 7.9 0.3 | 9.7 | 12.3 1.0 | 19.4 |
| 1A 1742294 | 15.7 0.2 | 11.5 | 14.8 0.8 | 12.9 |
| SLX 1744299/300 | 8.6 0.2 | 5.0 | 13.7 0.9 | 12.4 |
| 1E 1740.72942 | 38.8 0.2 | 20.2 | 46.9 0.7 | 26.3 |
| GRS 1734292 | 6.2 0.2 | 4.4 | 12.7 0.9 | 17.0 |
| IGR J174603047 | 3.6 0.3 | 3.5 | 10.9 1.0 | 9.2 |
| GRS 1747312 | 5.3 0.5 | 3.8 | 12.9 1.5 | 9.8 |
| IGR J173913021 | 4.3 0.3 | 5.3 | 11.2 1.0 | 11.4 |
| IGR J172852922 | 4.1 0.3 | 3.2 | 12.7 1.0 | 10.2 |
| H1732322 | 12.8 0.3 | 20.2 | 17.1 0.9 | 19.2 |
| IGR J174883253 | 4.4 0.3 | 3.6 | 12.9 0.9 | 10.8 |
| 3A 1822371 | 22.3 0.4 | 10.5 | 20.1 1.6 | 17.9 |
| SLX 1746331 | 4.6 0.3 | 4.1 | 13.5 0.9 | 10.9 |
| XTE J1710281 | 6.0 0.4 | 8.5 | 14.9 1.2 | 17.1 |
| 4U 172230 | 16.3 0.2 | 6.8 | 15.9 0.8 | 10.5 |
| IGR J172003116 | 4.4 0.4 | 4.7 | 12.0 1.3 | 14.0 |
| MXB 1730335 | 5.7 0.3 | 5.5 | 14.2 1.0 | 15.0 |
| Table 6 (continued). | ||||
|---|---|---|---|---|
| Source | (mCrab) | (mCrab) | ||
| XTE J1720318 | 4.4 0.4 | 4.2 | 12.6 1.0 | 10.2 |
| GX 3540 | 27.0 0.2 | 18.4 | 14.5 1.0 | 12.3 |
| IGR J172543257 | 4.5 0.4 | 3.7 | 11.7 1.2 | 12.7 |
| 1A 1744361 | 5.0 0.4 | 3.9 | 12.9 1.2 | 11.5 |
| 1H 1746370 | 6.3 0.4 | 4.6 | 14.3 1.3 | 26.4 |
| XTE J1743363 | 6.9 0.3 | 6.3 | 14.1 1.2 | 21.9 |
| 4U 170532 | 6.7 0.4 | 5.6 | 16.4 1.2 | 12.8 |
| IGR J172523616 | 13.1 0.3 | 12.6 | 16.6 1.2 | 12.5 |
| IGR J170983628 | 7.7 0.5 | 11.3 | 16.7 1.6 | 19.9 |
| IGR J170913624 | 4.8 0.5 | 5.4 | 15.1 1.5 | 19.9 |
| GX 349+2 | 34.8 0.4 | 17.4 | 17.8 1.7 | 17.1 |
| SAX J1712.63739 | 8.5 0.5 | 7.3 | 21.0 1.5 | 21.1 |
| 4U 1700377 | 191.9 0.5 | 197.8 | 91.0 1.4 | 84.1 |
| GRO J165540 | 50.2 1.0 | 72.8 | 70.9 2.6 | 79.4 |
| OAO 1657415 | 75.5 1.1 | 49.4 | 47.0 3.5 | 45.1 |
In the following subsections we describe our results for individual sources in more detail. We focus mainly on light curves in the 20–60 keV band; wherever appropriate we also give information on the 60–150 keV results. A study of the long-term soft X-ray (20 keV) behaviour can be far better done with, e.g., data from the RXTE/ASM or PCA. In this paper we discuss the long-term JEM-X results for the few sources that are detected by both JEM-X and IBIS/ISGRI during either all or at least most single pointings.
Only sources that exceed a 20–60 keV detection significance of 7 in one or more single hexagonal dither observations are considered here. This level was chosen in order to assure that the long-term light curves reveal significant variations. Note that the light curves display all data points, including those where the detection significance was lower than 7. For most of the sources we show the mean intensities averaged per hexagonal dither observation. Only when sources are highly variable within an observation are the results from the single pointings displayed.
We again grouped the 20–60 keV light-curve figures and results according to source type, i.e., black-hole (candidate) binaries, X-ray bursters, X-ray pulsars, other low-mass X-ray binaries, and miscellaneous sources. To each group of sources we devote a separate subsection. Wherever possible, a comparison to previous hard X-ray monitoring results is done; these comprise mainly observations made by MIT/OSO 7 (1971–1974, Markert et al. 1979), GRANAT/SIGMA (1989–1998, see, e.g., Churazov et al. 1994; Revnivtsev et al. 2004b) and CGRO/BATSE (1991–2000, see, e.g., Harmon et al. 2004).
4.2.1 Black-hole (candidate) binaries


1E 1740.72942. Normally, the most dominant source within the few degrees of the Galactic Center is the black-hole candidate 1E 1740.72942. It is therefore not surprising that earlier hard X-ray/-ray (20 keV) measurements of the region could only focus on this source, given the poor spatial resolution of the instruments (see, e.g., Cook et al. 1991, Bazzano et al. 1992, Churazov et al. 1994). Variability in the hard X-ray flux of 1E 1740.72942 was already evident from observations with different experiments (see, e.g., Bazzano et al. 1992). In 2005 1E 1740.72942 slowly varied on a monthly time scale between 35–65 mCrab and 30–90 mCrab, in the 20–60 keV and 60-150 keV bands, respectively (Fig. 6). Similar flux levels were observed previously by GRANAT/SIGMA (see Mandrou et al. 1994; Churazov et al. 1994) and INTEGRAL/IBIS (Del Santo et al. 2005). In spring 2006 (MJD 53775–53846) the source went below the detection limits of JEM-X (4 mCrab, 3–25 keV) and IBIS/ISGRI (1 mCrab, 20–60 keV; (see Fig. 6, Table 3; see also Sect. 4.3). Similar ‘switch-offs’ at hard X-rays occurred in 1991/1992 (e.g., Mandrou et al. 1994; Harmon et al. 2004), 1994/1995 (Harmon et al. 2004) and 2004 (Grebenev et al. 2004b; Del Santo et al. 2005). They seem to occur every 600 days (Smith et al. 2002).
GRS 1758258. This persistent black-hole candidate, located 40’ away from GX 51 (Sect. 4.2.3) varies between 60–95 mCrab and 60–140 mCrab in the 20–60 keV and 60–150 keV energy bands, respectively, on weekly to monthly time scales. The source is more variable at higher energies, especially during the third season (Fig. 6). The count rates in the two energy bands show that the source is harder than the Crab. Previous INTEGRAL observations (Pottschmidt et al. 2006), as well as observations with GRANAT/SIGMA (Gilfanov et al. 1993; Mandrou et al. 1994; Kuznetsov et al. 1999) and RXTE and CGRO/BATSE (Smith et al. 2001, 2002) showed the source had similar variability, disappearing at various times below the detection limits during a whole season, indicating variability by more than a factor of 10. Note that this is similar to that seen in 1E 1740.72942, as described above.
H1743322. In 2003 an outburst of this system was detected by INTEGRAL (Revnivtsev et al. 2003) and it was designated IGR J174643213. The source was soon associated with H1743322 (Markwardt & Swank 2003a,b), from which outbursts had been previously seen (see Kalemci et al. 2006, and references therein). INTEGRAL performed various observations throughout that outburst (Parmar et al. 2003; Lutovinov et al. 2005; Capitanio et al. 2005; Joinet et al. 2005). The source reappeared again in 2004 (Swank 2004) and 2005 (on MJD 53588; Swank et al. 2005). Our program monitored the source from just after the 2005 maximum (Kretschmar et al. 2005; see Fig. 6). The source was clearly seen in both the 20–60 keV and 60–150 keV bands. After a decay with an e-folding time scale of 16 days, the source rebrightened to 70 mCrab, after which it decayed with a shorter e-folding time, i.e., 5 days (20–60 keV).
XTE J1817330. A new bright X-ray transient and black-hole candidate was reported in January 2006, designated XTE J1817330 (Remillard et al. 2006b). INTEGRAL detected it at the start of the third season (see Shaw et al. 2006; Kuulkers et al. 2006a; Goldoni et al. 2006), and showed the source to be quite variable, up to 120 mCrab (see Fig. 6). The hard X-ray spectral shapes were also seen to vary substantially, especially near the beginning of the season (Kuulkers et al. 2006a). The transient was active during the whole third season.
GRO J165540. Precisely at the start of our program the black-hole X-ray transient GRO J165540 was reported to become active (on MJD 53419; Markwardt & Swank 2005). Our INTEGRAL GRO J165540 light curves (Kuulkers et al. 2005a; Shaw et al. 2005c; Fig. 6) nicely complement observations at soft X-ray (RXTE/PCA; see Homan 2005, Shaposhnikov et al. 2006), optical/IR (Buxton et al. 2005, Shaposhnikov et al. 2006) and radio (VLA; see Rupen et al. 2005; Shaposhnikov et al. 2006) wavelengths. The 20–60 keV and 60–150 keV fluxes peaked at 400 and 350 mCrab, respectively. Contemporaneous hard X-ray coverage was also provided by RXTE/HEXTE (see Homan 2005, Shaposhnikov et al. 2006) and Swift/BAT (Brocksopp et al. 2006). The source was still active during our second season; it is known for its multiple rebrightenings after the main one (see, e.g., Harmon et al. 2004).
4.2.2 X-ray bursters


GX 17+2. GX 17+2 is a bright persistent (soft) X-ray source and highly variable on various time scales, one of the characteristics of Z-sources (e.g., Hasinger & van der Klis 1989). Previous IBIS/ISGRI observations showed the hard X-ray flux (22–40 keV) already to be variable on a 10-day time scale between 25–85 mCrab (Paizis et al. 2006). Note that it is on average brighter at hard X-rays than the Z-source GX 51 (Sect. 4.2.3), whereas at soft X-rays GX 51 is the brightest of the “GX”-sources (see, e.g., Hasinger & van der Klis 1989). GX 17+2 can flare up to 110 mCrab (20–60 keV). Similar flaring activity can be discerned from previous observations with IBIS/ISGRI (Piraino et al. 2004). Similarly, the MIT/OSO-7 observations showed variability on a time scale of months from their detection limits up to 300 mCrab (15–40 keV; Markert et al. 1979).
GX 3540. GX 3540 (or 4U 172834) is generally seen with a 20–60 keV flux between 10–30 mCrab in our data (Fig. 7). However, every now and then we see it flaring up to 70–80 mCrab (20–60 keV) for a time scale of about a week (Fig. 7). Comparable flux variations on weekly time scales have been observed earlier by INTEGRAL/IBIS (Bazzano et al. 2004, 20–40 keV; Falanga et al. 2006, 20–100 keV), as well as by GRANAT/SIGMA (Claret et al. 1994; see also Mandrou et al. 1994). Similar variability is also present in the CGRO/BATSE light curves (Harmon et al. 2004; see also Barret et al. 1996). Flux increases up to 200 mCrab (20–60 keV) have been reported during previous INTEGRAL/IBIS observations (Zurita et al. 2004). The MIT/OSO-7 (15–40 keV) observations show that similar flux levels were reached in the early seventies (Markert et al. 1979).

GX 3540 is detectable in both JEM-X and IBIS/ISGRI most of the time (Fig. 8). Also in the 3–10 and 10–25 keV band does the flux vary on typically weekly time scales, between 60–300 mCrab and 20–150 mCrab, respectively. The fluxes in these two bands are clearly correlated. There appears, however, an anti-correlation between the soft (3–10 keV) and hard X-ray (20–60 keV) flux: the highest soft X-ray fluxes are accompanied by low hard X-ray fluxes, while the highest hard X-ray fluxes are accompanied by low soft X-ray fluxes. However, at times both the soft and hard X-ray fluxes can be simultaneously low. Similar behaviour can be discerned from the 3–20 keV and 20–100 keV INTEGRAL/JEM-X and IBIS/ISGRI light curves presented by Falanga et al. (2006). We saw 13 type I X-ray bursts spread over our whole program. They occur at different IBIS/ISGRI flux levels, similar to that found by Falanga et al. (2006).
H1820303 (in NGC 6624). The source generally varies slowly between 10–30 mCrab in the 20–60 keV band (Fig. 7; see also INTEGRAL/IBIS observations presented by Bazzano et al. 2004 in the 20–40 keV band, and Tarana et al. 2006a in the 20–30 keV, 30–60 keV and 60–120 keV bands). This is consistent with the 20–100 keV upper limits derived from CGRO/BATSE (80 mCrab and 30 mCrab for 1-day and 10-day integrations, respectively; Bloser et al. 1996). At the start of our second season (August 2005) the source was bright, i.e., 100 mCrab (20–60 keV) and rather hard (40 mCrab in the 60–150 keV band). It declined within 2 weeks to its normal flux level. The same hard state was recently reported by Tarana et al. (2006a) from other INTEGRAL data taken close in time to our monitoring observations. This can be connected to the soft (20 keV) low-intensity states which occur roughly every 170 days (e.g., Chou & Grindlay 2001). Some evidence for variations on time scales of months can be seen in the MIT/OSO-7 observations too, with 15–40 keV fluxes generally being below 100 mCrab (Markert et al. 1979).
GS 182624. During the first years of CGRO/BATSE (Harmon et al. 2004) GS 182624 was below/near its detection limits; later on it gradually became brighter, reaching up to 70 mCrab near the end of the mission (20–100 keV; Harmon et al. 2004). At the moment, the source is one of the brightest persistent type I X-ray bursters in the Galactic bulge region. During our observations, it slowly varies on monthly and longer time scales between 70 and 100 mCrab at 20–60 keV (Fig. 7). In the 60–150 keV band, however, the source varies more on a weekly time scale between 30 and 80 mCrab, around an average flux of 55 mCrab (Fig. 11).
KS 1741293. KS 1741293 was most of the time not significantly detected during our monitoring observations. However, it was bright, reaching up to 25 mCrab (20–60 keV), for about a month during the first half of the second season (August/September 2005, MJD 53599–53633; Fig. 7). KS 1741293 was earlier seen to be active in March 2003 and March 2004 (Bélanger et al. 2004; Grebenev et al. 2004b; De Cesare et al. 2006). Type I X-ray bursts were previously found with JEM-X (De Cesare et al. 2006); in our program we did not see any.
MXB 1730335 (in Liller 1). We saw MXB 1730335 (better known as The Rapid Burster) turning on at the end of the first season (mid-April 2005; see also Molkov et al. 2005b) and it was turning off at the beginning of the second season (mid-August 2005; Fig. 7; see also Kretschmar et al. 2005). Previous outbursts of MXB 1730335 were already recorded by IBIS/ISGRI, in February (Falanga et al. 2004) and August 2003 (Sunyaev et al. 2003a). This is consistent with the outburst recurrence period being roughly 100 days since 2000 (Masetti 2002). Strong burst activity is seen in our data near the end of the hard X-ray outburst, between 2005 August 25 and September 3 (MJD 53607–53616).
XTE J1739285. In August 2005 (second season), the X-ray transient XTE J1739285 (discovered in 1999, Markwardt et al. 1999) was found by INTEGRAL to be bright at soft and not detected at hard X-ray energies (Bodghee et al. 2005). About a month later the situation had reversed; it was bright at hard and weak at soft X-ray energies (Shaw et al. 2005b). Although at first we attributed the state change to the compact object being a black hole, we proved it to be a neutron star based on the occurrence of type I X-ray bursts detected with JEM-X (Brandt et al. 2005). During the third season the source was still active (Chenevez et al. 2006a). We saw a total of 13 type I X-ray bursts when the source was active.
SAX J1747.02853. SAX J1747.02853 is active at relatively low flux levels for long periods (e.g., Wijnands et al. 2002, Natalucci et al. 2004). True quiescence, however, is reached sometimes (Werner et al. 2004). The source was active (Fig. 7) during the end of the second visibility season (October 2005; see Kuulkers et al. 2005c), as well during most part of the third visibility season (e.g., Chenevez et al. 2006a). It reached a maximum of about 24 mCrab (20–60 keV) during the third season. Previous activity, as seen by INTEGRAL, was reported during March 2004 (Deluit et al. 2004). In our data SAX J1747.02853 showed 6 type I X-ray bursts, 1 during both the first and second season, the rest during the third season (see also Kuulkers et al. 2005c, Chenevez et al. 2006a).
1A 1742294. This X-ray burster is 32’ away from 1E 1740.72942 and well resolved by INTEGRAL/IBIS (see, e.g., Bélanger et al. 2006). We see it clearly varying up to 40 mCrab (20–60 keV) on a monthly time scale (Fig. 7). Similar variability on roughly a half year time scale was earlier reported by Churazov et al. (1995) using GRANAT/SIGMA. This source is the most active type I X-ray burster in our program. We found 36 type I X-ray bursts; most of the bursts were seen when the source was at the highest IBIS/ISGRI flux levels.

Due to the fact that at hard X-ray energies IBIS/ISGRI is able to distinguish the source from neighboring sources, and the simultaneity of the softer X-ray JEM-X information, we are able to study this behaviour for the first time clearly in this source. During most of the pointings we detect 1A 1742294 with JEM-X (Fig. 9). The source shows the same behaviour between 3–10 keV versus 10–25 keV, and 3–10 keV versus 20–60 keV, as is seen for GX 3540 (see above). Again, most of the time there is an anti-correlation between the fluxes in 3–10 keV and 20–60 keV energy bands.
GX 13+1. Previous INTEGRAL observations showed the 20–40 keV flux to be quickly varying from the IBIS/ISGRI detection limits (upper limit typically 5 mCrab) up to 35 mCrab on a 10-day time scale (Paizis et al. 2006). In our program the source varies between the IBIS/ISGRI detection limits and 40 mCrab (20–60 keV) on a revolution to revolution basis (Fig. 7), consistent with that seen previously.
4U 172230 (in Terzan 2). The source 4U 172230 is persistently visible between 10–25 mCrab (20–60 keV). GRANAT/SIGMA saw the source varying between 10–40 mCrab (35–75 keV) on a 200-day time scale (Goldwurm et al. 1995; see also Barret et al. 1991). During the middle of our second season it showed a drop to near IBIS/ISGRI detection levels for a time period of 2 weeks (September/October 2005; Fig. 7). Strong type I X-ray bursts are seen in all seasons, for a total of 5.
GX 3+1. During the February 2003 to May 2004 period the RXTE/ASM 2–12 keV intensity decreased more or less monotonically from about 400 mCrab to about 250 mCrab. The 2-month average hard X-ray flux (22–40 keV) decreased in the same period from about 15 mCrab to about 8 mCrab. Within these 2 months periods the flux varied only weakly on a 10-day time scale (Paizis et al. 2006). Since May 2004 up to August 2004 the source continued to decline to about 150 mCrab in the 2–12 keV band. Thereafter, it varied erratically on a roughly 100 day time scale between 100 and 250 mCrab up to the end of 2005. Over the course of 2006 the 2–12 keV flux has been increasing steadily again; it was about 250 mCrab at the end of our third season. The source is barely detectable in the 20–60 keV band around 10 mCrab in our program (Fig. 7), consistent with the source behaviour in both soft and hard X-rays around May 2004 reported by Paizis et al. (2006). During the whole monitoring program we observed 10 type I X-ray bursts.
SLX 1735269. We see SLX 1735269 between 8–20 mCrab (20–60 keV; Fig. 7), i.e., just above the detection limits. This is typical of the source (Goldwurm et al. 1996), although INTEGRAL observations previous to our monitoring program show that occasionally the hard X-ray flux decreases below 5 mCrab (Molkov et al. 2005a). We saw no type I X-ray bursts during our osbervations with JEM-X.
GRS 1741.92853. GRS 1741.92853 is, similar to SAX J1747.02853, a faint X-ray transient source (e.g., Muno et al. 2003b). A hard X-ray outburst, with a peak of 15 mCrab and a duration of at least a couple of weeks (20–60 keV) was seen near the end of the first visibility season (April 2005, MJD 53464–53479; see Fig. 7). We note that XMM-Newton and Chandra found the source to be still active in soft X-rays (10 keV), respectively, two and three months later (Wijnands et al. 2006). A previous detection at hard energies (40–100 keV) was reported by GRANAT/SIGMA in March/April 1990 (Churazov et al. 1993). No type I X-ray bursts were seen with JEM-X.
SLX 1744299/300. SLX 1744299/300 weakly varies. Fluxes up to 15 mCrab (20-60 keV) were reached during the second season (Fig. 7). A total of 9 type I X-ray bursts were seen in our data to come from them.
SLX 1737282. SLX 1737282 is a weak persistent X-ray source (Skinner et al. 1987, in ’t Zand et al. 2002), and detected in the hard X-ray band (3.40.2 mCrab, 18–60 keV, Revnivtsev et al. 2004a; see also Bird et al. 2004, 2006). We see it varying between the detection limits up to about 12 mCrab on a revolution time scale (20–60 keV; Fig. 7). In our JEM-X data we saw no type I X-ray bursts.
XB 1832330 (in NGC 6652). The globular cluster source XB 1832330 lies far off-axis from the Galactic Center (11.5∘). We see it is a weak hard X-ray source with 20–60 keV fluxes between 10–20 mCrab (Fig. 7). The source was seen at similar flux levels, without strong variability, during several INTEGRAL IBIS/ISGRI observations taken between March 2003 and September 2005 (Tarana et al. 2006b).


4.2.3 Other low-mass X-ray binaries

GX 51. Like GX 17+2 (Sect. 4.2.2), GX 51 is highly variable on various time scales (see Fig. 10). It is one of the brightest persistent sources in the canonical 2–10 keV band (only Sco X-1 and Crab are brighter); it is also a Z source (Hasinger & van der Klis 1985). Thanks to the high angular resolution of IBIS/ISGRI we are able to discriminate clearly its hard-energy radiation from that of the nearby (40’) strong hard X-ray source GRS 1758258 (Sect. 4.2.1). On time scales of half an hour (one pointing) and longer also at harder energies (20–60 keV) the flux changes considerably, from the detection limit up to 100 mCrab (Fig. 10; see also Paizis et al. 2005, 2006 for previous INTEGRAL observations). Markert et al. (1979) do provide 15–40 keV long-term light curves for GX 51, but they are most likely contaminated by GRS 1758258.
GX 51 is the brightest source seen in the JEM-X field-of-view of the Galactic bulge observations (see Fig. 4). It is so bright (700–1600 mCrab and 100–600 mCrab, in the 3–10 keV and 10–25 keV bands, respectively; Fig. 12) that it dominates the JEM-X detector count rates, which considerably influences the image reconstruction and therefore the quality of the observations. GX 51 shows a two-branch behaviour, both in the 3–10 keV versus 10–25 keV and 3–10 keV versus 20–60 keV bands (Fig. 13, left panel). In one branch there is a correlation in the intensities between the lowest X-ray band and the higher X-ray bands. In the other branch, which is connected to the former one at the highest intensities, there is (almost) no correlation: whereas the 3–10 keV intensity varies, the 10–25 keV and 20–60 keV stay (almost) constant. This two-branch behaviour is related to the so-called “Z” branches seen in this source and other Z-sources. GX 51 is mostly seen in the so-called horizontal and normal branch (e.g., Kuulkers et al. 1994). This is also reflected in the hardness versus intensity (flux) diagram (HID; Fig. 13, middle panel). The horizontal branch runs from top left to middle right, the normal branch from middle right to bottom left. The HID is qualitatively similar to that drawn from other (all-sky) monitoring observations (Blom et al. 1993; van der Klis et al. 1991; Paizis et al. 2005). There is no evidence for such branch behaviour in the hardness versus the 20–60 keV flux (Fig. 13, right panel); in that case the hardness just increases linearly with increasing 20–60 keV flux.
GX 349+2. Like GX 51 and GX 17+2, also GX 349+2 is a Z-source (Hasinger & van der Klis 1989). It is highly variable between 15 and 60 mCrab (20–60 keV; Fig. 10). Previous IBIS/ISGRI observations show similar flux variations on a 10-day time scale (22–40 keV; Paizis et al. 2006).
GX 9+1. GX 9+1 varies from revolution to revolution, up to 20 mCrab (20–60 keV; Fig. 10). On a 10-day time scale the source has been seen to weakly vary between 10 and 20 mCrab in the 22–40 keV band, using previous INTEGRAL observations (Paizis et al. 2006).
1E 1743.12843. 1E 1743.12843 is a fairly persistent source in the Galactic Center region with a 20–40 keV flux of 5 mCrab; it only shows marginal variability over a few months time scale (Del Santo et al. 2006). Our monitoring is consistent with this (Fig. 10); 1E 1743.12843 is not significantly detected in the average of the first and third season, but it is during the second season (see Fig. 3, Table 3). The average flux over the second season is 4.40.2 mCrab (20–60 keV), similar to that reported by Del Santo et al. (2006). We note that the high data point near the end of February 2005 (MJD 53428) is instrumental; the source was not significantly detected during that particular revolution (290).


4.2.4 X-ray pulsars
OAO 1657415. The source is a high-mass X-ray binary with a pulse period of 38 s and an orbital period of 10.4 days (Chakrabarty et al. 1993). It is highly variable on monthly and longer time scales as seen by CGRO/BATSE, reaching up to 200 mCrab (20–100 keV; Harmon et al. 2004). Like 4U 1700377, the hard X-ray flux modulates with the orbital period (e.g., Laycock et al. 2003). We see OAO 1657415 far off-axis from the Galactic Center (15.6∘); the 20–60 keV and 60–150 keV fluxes vary on a single pointing basis, and range between the IBIS/ISGRI detection limits and 200 mCrab (Fig. 10) and 100 mCrab, respectively. During the first few weeks of the second season the source was not very active, compared to the rest of the observations.
IGR J172523616. IGR J172523616 was discovered in February 2004 (Walter et al. 2004). It has been found to show a pulse period of 414 s and an orbital period of 9.72 days (Zurita Heras et al. 2006). INTEGRAL/IBIS monitoring of IGR J172523616 indicates a mean 20–60 keV flux of 6.4 mCrab; the source was not detected in the 60–150 keV band with 3 upper limits of typically 7 mCrab. Every now and then IGR J172523616 flares on 1 day time scales up to about 70 mCrab (Zurita Heras et al. 2006). This is consistent with the fact that most of the time we do not see the source, and our detection of a couple of flares, one of which occurred on March 26, 2005 (MJD 53820), with fluxes up to 90 mCrab (20–60 keV; Fig. 10).
GX 1+4. GX 1+4 is a symbiotic binary composed of a giant star and a neutron star (Chakrabarty & Roche 1997, Belczyński et al. 2000), with an orbital period of 304 days (Pereira et al. 1999) and a spin period of about 2 min (e.g., Lewin et al. 1971). INTEGRAL observations between March 2003 and October 2004 showed the source evolving from a weak intensity state in the beginning at about 20 mCrab to a brighter intensity state at the end at about 120 mCrab (20–40 keV). The source showed strong variability by a factor of 10 on a few 1000 s time scale on some occassions (Ferrigno et al. 2006). We detect the source at least up to 150 keV (see also Ferrigno et al. 2006); it clearly varies on weekly and longer time scales from 5–85 mCrab and 5–50 mCrab (20–60 keV and 60–150 keV, respectively; see Figs. 10 and 11). Note that the correlated variability between the 20–60 keV and 60–150 keV bands, present during the first season, is absent during the first part of the second season. GRANAT/SIGMA observations already showed similar variability at energies 40 keV at monthly time scales (Cordier et al. 1993; Mandrou et al. 1994; David et al. 1998) and half-a-year time scales (Goldwurm et al. 1995). CGRO/BATSE shows clearly the 20–100 keV variability on time scales longer than a month with fluxes between below the detection limit to up to 200 mCrab (Harmon et al. 2004). During the MIT/OSO-7 observations the 15–40 keV flux varied mostly within about 200 and 300 mCrab on months time scales, with one possible flaring period up to about 600 mCrab (Markert et al. 1979).
3A 1822371. 3A 1822371 is a 5.57 hr dipping and eclipsing accretion-disk corona source (e.g., White et al. 1981), with a pulse period of 0.59 s (Jonker & van der Klis 2001). It is a persistent source in the 20–60 keV band, and we see it varying on time scales of typically a revolution to a couple of revolutions between 12 and 35 mCrab (20–60 keV; Fig. 10). Previous INTEGRAL/IBIS and BeppoSAX/PDS observations showed that the 15–40 keV flux is clearly modulated with the orbital period (Williams et al. 2004).
4.2.5 Miscellaneous sources
4U 170037. The high-mass X-ray binary 4U 1700377 has an orbital period of 3.41 days (Jones et al. 1973). The nature of the compact object is still unknown (Gottwald et al. 1986, Clark et al. 2002). It shows the strongest flaring activity in our sample, with fluxes from near the IBIS/ISGRI detection limit to generally 500 mCrab (20–60 keV) within one observation. Flares with fluxes up to about 1500 mCrab are seen in our program (Fig. 10). In the 60–150 keV band the source varies generally between the IBIS/ISGRI detection limits and 200 mCrab (Fig. 11), occasionally flaring reaching up to 500 mCrab in single pointings. This is similar to the hard X-ray behaviour seen in previous observations by INTEGRAL, CGRO/BATSE, GRANAT/SIGMA, as well as older experiments; the lowest fluxes are reached during eclipse (Orr et al. 2004, Laycock et al. 2003, Kudryavtsev et al. 2001, Rubin et al. 1996, Laurent et al. 1992, Pietsch et al. 1980, Markert et al. 1979).
IGR J170983628. IGR J170983628 was discovered end of March 2005 (MJD 53453) by INTEGRAL with 18–45 keV and 45–80 keV fluxes of 28 and 39 mCrab, respectively (Grebenev et al. 2005a). Near the peak the source spectrum changed significantly (Grebenev et al. 2005b). Our observations caught the source near the peak and we saw it fading away (Mowlavi et al. 2005). On March 26 (MJD 53455) the source showed considerable variability, up to 65 mCrab (20–60 keV; Fig. 10); on that date a significant detection was also made in the 60–150 keV band, with an average flux of 75 mCrab (Fig. 11; see also Mowlavi et al. 2005).
IGR J175442619. On 17 September, 2003 INTEGRAL discovered IGR J175442619 (Sunyaev et al. 2003b). It flared on time scales of hours with fluxes up to 160 mCrab, 60 mCrab and 15 mCrab in the 18–25, 25–50 and 50–100 keV IBIS/ISGRI bands (Sunyaev et al. 2003b; Grebenev et al. 2003; see also Walter et al. 2006). Earlier activity was seen by IBIS/ISGRI in April 2003; it was found flaring again near the end of February 2004 (Walter et al. 2006), as well as on March 8, 2004 (Grebenev et al. 2004a). On the latter date the source reached 17–45 keV peak fluxes of 160 mCrab (Grebenev et al. 2004a). Walter et al. (2006) reported flux increases from the detection limits up to 1000 mCrab (15–30 keV) within 5 min during the periods of activity in 2003 and 2004. Our monitoring shows that it flared again on October 15, 2005 (MJD 53658), up to 60 mCrab (20–60 keV; Fig. 10). Walter et al. (2006) suggested a period of 1655 days between activity (based on three flaring periods); however, our observations do not support this.
XTE J1818245. On August 12, 2005 (MJD 53594) a new source, XTE J1818245, was reported (Levine et al. 2005). This was just before the start of the second season, and the first observations showed the source to be bright, 30 mCrab (20–60 keV; Shaw et al. 2005). The transient faded more or less monitonically and went below the detection limits within a month (Fig. 10). During the first few monitoring observations of the same period the source was seen at 60–150 keV as well, with fluxes between 30–40 mCrab.
XTE J1743363. This source was first detected in outburst by the RXTE/PCA in 1999 (Markwardt et al. 1999). It was marginally (1.70.2 mCrab) detected by IBIS/ISGRI in September 2003 (Revnivtsev et al. 2004a), but it became active again in September 2004, with a mean flux of 10 mCrab (18–45 keV; Grebenev & Sunyaev 2004a). We see clear activity up to 18 mCrab (20–60 keV) in the period March–April 2005 (MJD 53435–53479), during the first season (Fig. 10).
4.3 April 2006: a quiet Galactic Center region
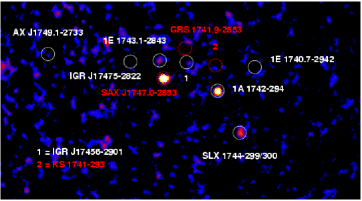
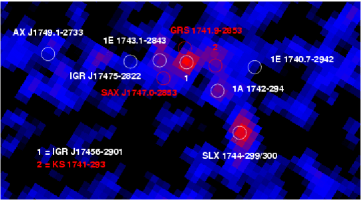
It was already noted (Sect. 4.2.1) that 1E 1740.72942 was not detected during the third monitoring season. A close inspection of the 20–60 keV light curve reveals that most of the other bright and/or transient X-ray sources in the Galactic Center region (1A 1742294, SLX 1744299/300, KS 1741293, GRS 1741.92853, SAX J1747.02853) had faded during our monitoring observations performed on April 3–21, 2006. These observations clearly show the dynamic range in source activity present in the Galactic Center region.
In Fig. 14 we show the average mosaic image of the region in the 3–20 keV and 20–60 keV bands. Clearly, 1A 1742294 and SAX J1747.02853 were in a soft X-ray state during that time, whereas the transients KS 1741293 and GRS 1741.92853 were off. A source in a hard X-ray state is seen (6 mCrab, 3–20 keV; 9, 4.60.5 mCrab, 20–60 keV), positionally coincident in our source sample with IGR J174562901. We derive a position of this source of (J2000.0) RA, Dec = 266.410∘, 29.029∘, with a 90% confidence error of 2.9’. Within the quoted error of this Galactic Center source various (transient) X-ray binaries are known: A1742289 (Eyles et al. 1975), AX J1745.62901 (Sakano et al. 2002), CXOGC J174538.0290022, CXOGC J174541.0290014, CXOGC J174535.5290124 (Muno et al. 2003a), CXOGC J174540.0290005 (Muno et al. 2005a), CXOGC J174540.0290031 (Muno et al. 2005b), SWIFT J174535.5290135.6 (Kennea et al. 2006a) and SWIFT J17454.0290005.3 (Kennea et al. 2006b, 2006c). We have no (soft X-ray) information available of which one of these sources was active during our April 2006 observations, and thus can not securely identify the origin of the hard X-ray emission with one of them. On the other hand, the 20–60 keV flux of our source is similar to that seen from IGR J174562901, which has been constant over the two years before our monitoring observations (Bélanger et al. 2006). Note that none of the above mentioned X-ray binaries and X-ray transients fall within the error circle of IGR J174562901 (see Bélanger et al. 2006). We, therefore, tentatively identify our source with the steady source IGR J174562901, which we could detect significantly using a shorter exposure time, since no other closeby (bright) sources could contaminate the observations.
4.4 New INTEGRAL sources
Apart from the sources described in the previous Sections, during the course of the third season we found several new X-ray sources (see Table 7). Also, a re-analysis of the whole Galactic bulge monitoring data set is in progress, and in the course of this exercise we also find new X-ray sources. Since these sources were not part (yet) of our catalog of sources, they are not included in the discussion on the images (Sect. 4.1) and long-term light curves (Sect. 4.2). Here we only shortly summarize their properties as described in various ATels, or report on first results from the re-analysis on the new INTEGRAL sources.
| RA | Dec | err | J/I? | Reference | |
| Source | (degrees) | ||||
| IGR J173543255 | 263.854 | 32.922 | 4’ | noa/yes | [1] |
| IGR J174542703 | 266.329 | 27.039 | 1’ | yes/no | [2] |
| IGR J174532853 | 266.328 | 28.891 | 2’ | no/yes | [2] |
| IGR J175362339 | 268.409 | 23.654 | 4’ | nob/yes | [3] |
| IGR J175412252 | 268.517 | 22.871 | 4’ | nob/yes | [3] |
| IGR J174562901b | 266.412 | 29.029 | 2’ | yes/yes | [4] |
| a JEM-X instrument was off. | |||||
| b Not in the JEM-X field of view. | |||||
IGR J174532853. In the observations performed on April 3, 2005 (MJD 53463) a new source is detected by IBIS/ISGRI at the 6 level with a 20–60 keV flux of 7 mCrab. It was seen on average at the same level in the following observations, up to April 14, 2005 (MJD 53474; see Fig. 15). The best-fit position is given in Table 7. We designate this source IGR J174532853. Despite being at a favourable off-axis angle from the Galactic Center (2∘), IGR J174532853 is not seen with JEM-X (6 mCrab and 7.5 mCrab, for 3–10 keV and 10–25 keV, respectively), potentially indicating high intrinsic absorption or that it underwent a hard X-ray outburst. The source is rapidly variable, with the 20–60 keV flux changing by a factor of 2 on a time scale of about half an hour. It reached a peak flux 274 mCrab on April 10, 2005 (MJD 53470; Fig. 15). A preliminary spectral analysis shows that the source spectrum can be described by a power-law with index of 2.2, indeed indicating a hard spectrum. We note that if the non-detection with JEM-X is due to absorption in the line of sight, NH should be larger than about 1023 atoms cm-2.


IGR J174542703. Combining our monitoring observations performed between February 17 and March 4, 2006 (MJD 53783–53798), a new source is found with JEM-X. The position is given in Table 7. We designate the source IGR J174542703. No previously known X-ray source is found within 5’ of this position in the Simbad database. The light curve of this new X-ray transient shows that it was at its maximum between February 24 and 27 (MJD 53790–53793; Fig. 16). In one of the single pointings on February 27 the source reached a peak flux of 82 mCrab (3–10 keV) and 29 mCrab (10–25 keV). We note that the 3–20 keV JEM-X spectrum can be modeled by an absorbed power law with an absorption column, of 1.21023 atoms cm-2 and photon index of 3.5. We do not detect the source with IBIS/ISGRI, either by combining the observations between February 17 and March 4 (2 mCrab, 20–60 keV), or in single hexagonal dither observations (4 mCrab, 20–60 keV), consistent with the steep soft X-ray spectrum.
IGR J174562901b. A new X-ray transient, SWIFT J174535.5290135.6, was detected on February 25, 2006 (MJD 53791). It was not seen the previous day, and showed a power-law-like decay in flux the days after (Kennea et al. 2006a). We (Chenevez et al. 2006b) reported on a source coincident with this new Swift transient, which was seen about a week earlier with JEM-X and IBIS/ISGRI with fluxes of about 9 mCrab (6–10 keV) and about 6 mCrab (20–60 keV), and, therefore, associated with SWIFT J174535.5290135.6. However, the Swift transient was not seen on February 24, and more X-ray (transient) sources are known (see Sect. 4.3) within the JEM-X error circle (Table 7). Most of our detected hard X-ray emission may come from IGR J174562901, but the transient soft X-ray emission does not (see Sect. 4.3; Bélanger et al. 2006). We conclude that at least our detected soft X-ray emission is due to a transient source, which we designate IGR J174562901b, but we can not attribute with confidence this transient emission to either SWIFT J174535.5290135.6 or any other known source within the error circle.
IGR J175362339, IGR J175412252. In the beginning of April 2006 (MJD 53828) two new faint closeby (0.8∘) sources were detected by IBIS/ISGRI (see Table 7 for the position): IGR J175362339 and IGR J175412252. They had fluxes of 11 and 10 mCrab, respectively, in the 20–60 keV band. Within the positional errors IGR J175362339 is coincident with the nearby X-ray burster SAX J1753.52349 (Turler et al. 2006).
4.5 OMC results
Many of the sources we study do not have optical/IR counterparts or their optical counterparts are fainter than the OMC detection limit (mainly due to interstellar absorption). Since the Galactic bulge region is crowded, when observing a high-energy source which has a relatively large positional error circle, one may observe various possible counterparts, or the right counterpart may not even be visible. This is the case for most of our targets. However, whenever a source flares up in brightness, with concurrent brightening in hard X-rays/-rays, we may be able to detect them with our analysis method.
One of the few examples, however, of a relatively clear field with an optical/IR counterpart is that of IGR J175442619. The OMC light curve of the counterpart (2MASS J175425272619526; Rodriguez 2003, Pellizza et al. 2006) is given in Fig. 17. The source does not vary much on a daily time scale, and is consistent with being constant near V12.9 mag, close to that seen previously (Pellizza et al. 2006). As shown by the simultaneous 20–60 keV IBIS/ISGRI light curve in the same plot, the hard X-ray source was not active at that time.

5 Summary and conclusions
In this paper we have shown the results of the first one and a half year of monitoring of sources in and around the Galactic bulge region at soft (3–25 keV) and hard (20–150 keV) X-ray energies, with a focus on the short, medium and long-term source variability within this period. For the first time we have performed a high-sensitivity 20 keV study of variability at hourly to weekly to monthly time scales, especially for the sources in the Galactic Center region, which has not been possible before due to source confusion of previous hard X-ray instruments. Our program has been succesfull in monitoring the hard X-ray variability of bright persistent sources, as well as characterising the (long-term) properties of old and new X-ray transients. Moreover, due to the frequent monitoring we are able to detect fast X-ray transients, i.e., those which are typically active for less than a day. We also found six new INTEGRAL sources: IGR J173543255, IGR J174532853, IGR J174542703, IGR J174562901b, IGR J175362339, and IGR J175412252.
The fact that INTEGRAL has various instruments aboard which are sensitive in the soft and hard X-ray region, allows us to simultaneously monitor these energy ranges for (anti-) correlations, as well as fast phenomena such as X-ray bursts. Moreover, due to the wide field of view of the instruments we are able to monitor a large sample of X-ray sources all at the same time. It thus allows a homogeneous analysis of all the sources, similar to what was possible with the BeppoSAX/WFC at soft X-rays (see, e.g., in ’t Zand 2001), and, to a lesser extent, with GRANAT/SIGMA at hard X-rays (see, e.g., Mandrou et al. 1994).
In the Galactic bulge and its surroundings we see about 15 persistent neutron-star low-mass X-ray binaries, 10 of which are X-ray bursters, active over the whole monitoring period at energies 20–60 keV. Per season we detect 22/23 sources above a detection significance of 7. Of the black-hole (candidate) binaries in our sample we see the two persistent sources for most of the time, 1E 1740.72942 and GRS 1758258. The former one was seen to turn off for a period of at least about three months. So far, we have seen one bright (exceeding 100 mCrab, 20–60 keV) black-hole (candidate) X-ray transient (such as GRO J165540) in outburst per season, for a period of months. We see on average about three transient X-ray bursters active per season for periods ranging between weeks (e.g., GRS 1741.92853) to months (e.g., XTE J1739285) with peak fluxes of about 25 mCrab (20–60 keV). The average number of fast X-ray transients (i.e., visible for only a couple of hours up to a day) per season is about one; they peak to about 100 mCrab (20–60 keV; e.g., IGR J175442619). Most of the sources we detect on a hours to daily time scales are (transient) low-mass or high-mass X-ray binaries. Those detected only using averages per season, i.e., the weaker sources with fluxes typically around 5 mCrab (20–60 keV), also include cataclysmic variables and AGN.
Whereas, for example, GX 3+1 (X-ray burster) does not vary significantly, sources like GX 1+4 (symbiotic neutron-star binary) and 1A 1742294 (X-ray burster) vary on monthly times scales, while GRS 1758258 (black-hole candidate) and GS 182624 (X-ray burster) generally vary smoothly on even longer time scales. As noted above, some sources clearly show transient behaviour, i.e., they show outbursts with durations exceeding months (e.g., H1743322, a black-hole candidate), weeks (e.g., MXB 1730335, an X-ray burster) or flaring on time scales of hours to days (e.g., IGR J172523616, an X-ray pulsar). For the X-ray transient XTE J1739285 we secured its identification to host a neutron star through our monitoring program (Brandt et al. 2005). Some sources vary on all time scales accessible through our program, as displayed by, e.g., the high-mass X-ray binary 4U 1700377. Hard X-ray flares/outbursts in X-ray burst sources (e.g., GX 3540, H182030) are accompanied by soft X-ray drops, i.e., the spectra pivot somewhere between 10–20 keV when the sources become harder (see also Tarana et al. 2006a). The reverse is also seen (e.g., 4U 172230). GX 51, a bright non-bursting low-mass X-ray binary, on the other hand, shows no such anti-correlation. The soft X-ray emission is either correlated with the hard X-ray emission, or not, depending on the position in the ‘Z’-diagram.
The temporal behaviour of hard X-ray emission from X-ray bursters has led to a division into three classes (see, e.g., Tavani & Barret 1997): 1) X-ray bursters with persistent (though variable on a monthly time scale) hard X-ray emission (such as GS 182624), 2) X-ray bursters showing episodic (for 10–20 days) hard X-ray emission (such as GX 3540), and 3) X-ray bursters which are transient (such as Aql X-1). The behaviour we describe above confirms this division, except that some of the persistent X-ray bursters may show temporary (for 10–20 days) drops in their hard X-ray emission (e.g., 4U 172230). The sparse examples of long-term simultaneous soft and hard X-ray observations of X-ray bursters (in the pre-INTEGRAL literature) indicate that hard X-rays are generally anti-correlated with soft X-rays (e.g., 4U 0614+091, Ford et al. 1996). However, we show that sometimes no (anti-)correlation is seen between soft and hard X-ray emission in X-ray bursters, i.e., the soft and hard X-ray can both be low.
At higher energies, i.e., 60–150 keV, we detect about 8/9 sources per season above a detection significance of 7, and about a dozen in the data covering the whole monitoring period. These are either transient or persistent black-hole candidates, X-ray bursters or high-mass X-ray binaries. This is in accordance with the hard X-ray (100 keV) INTEGRAL/IBIS survey (which includes the Galactic bulge region) by Bazzano et al. (2006), who concluded that the 100–150 keV band is dominated by low and high-mass X-ray binaries.
The next step will be, apart from the continuation of the Galactic bulge monitoring in the future, the investigation of (hard X-ray) variability at smaller time scales (milliseconds to minutes) and the relation to long-term variability, such as time-resolved pulse timing and detailed X-ray burst analysis. We also plan to study the long-term energy spectral behaviour of our sources, as well as a comparison with other ongoing monitoring programs (e.g., with the RXTE/ASM and PCA).
In this introductory paper we have shown that most of the hard X-ray sources in the field of view of the INTEGRAL instruments included in our program clearly vary on time scales of a few hours to days to months. It is therefore no surprise that the Galactic bulge is a region to stay tuned to.
Acknowledgements.
Based on observations with INTEGRAL, an ESA project with instruments and science data centre funded by ESA member states (especially the PI countries: Denmark, France, Germany, Italy, Switzerland, Spain), Czech Republic and Poland, and with the participation of Russia and the USA. This research has made use of the SIMBAD database, operated at CDS, Strasbourg, France. EK thanks Angela Bazzano and Guillaume Bélanger for comments on an earlier version of the paper.References
- (1) Barthelmy, S.D. 2000, in Proc. SPIE, 4140, p. 50
- (2) Barret, D., Grindlay, J.E., Bloser, P.F., et al. 1996, A&AS, 120, 121
- (3) Barret, D., Mereghetti, S., Roques, J.P., et al. 1991, ApJ, 379, L21
- (4) Bazzano, A., Bird, A.J., Cocchi, M., et al. 2004, in Proc. 5th INTEGRAL Science Workshop, ‘The INTEGRAL Universe’, V. Schönfelder, G. Lichti, C. Winkler (eds.), ESA SP-552, p. 309
- (5) Bazzano, A., La Padula, C., Ubertini, P., Sood, R.K. 1992, ApJ, 385, L17
- (6) Bazzano, A., Stephen, J.B., Fiocchi, M., et al. 2006, ApJ, 649, L9
- (7) Bélanger, G., Goldwurm, A., Renaud, M., et al. 2006, ApJ, 636, 275
- (8) Belczyński, K., Mikołajewska, J., Munari, U., Ivison, R.J., Friedjung, M. 2000, A&AS 146, 407
- (9) Bhattacharyya, S., Strohmayer, S.E., Swank, J.H., Markwardt, S.B. 2006, ApJ, 639, L31
- (10) Bird, A.J., Barlow, E.J., Bassani, L., et al. 2004, ApJ, 607, L33
- (11) Bird, A.J., Barlow, E.J., Bassani, L., et al. 2006, ApJ, 636, 765
- (12) Blom, J.J., in ’t Zand, J.J.M., Heise, J., Aref’ev, V., Borozdin, K., Nottingham, M.R. 1993, A&A, 277, 77
- (13) Bloser, P.F., Barret, D., Grindlay, J.E. 1996, A&AS, 120, 275
- (14) Bodghee, A., Mowlavi, N., Kuulkers, E., et al. 2005, ATel #592
- (15) Bouchet, L., Roques, J.P., Mandrou, P., Strong, A., Diehl, R., Lebrun, F., Terrier, R. 2005, ApJ, 635, 1103
- (16) Brandt, S., Budtz-Jørgensen, C., Chenevez, J. 2006, ATel #778
- (17) Brandt, S., Kuulkers, E., Bazzano, A., et al. 2005, ATel #622
- (18) Brocksopp, C., McGowan, K.E., Krimm, H., et al. 2006, MNRAS, 365, 1203
- (19) Buxton, M., Bailyn, C., Maitra, D. 2005, ATel #418
- (20) Capitanio, F., Ubertini, P., Bazzano, A., et al. 2005, ApJ, 622, 503
- (21) Chakrabarty, D., Roche, P. 1997, ApJ, 489, 254
- (22) Chakrabarty, D., Grunsfeld, J., Prince, T.A., et al., 1993, ApJ, 403, L33
- (23) Chelovekov, I.V., Grebenev, S.A., Sunyaev, R.A. 2006, AstL, 32, 456
- (24) Chenevez, J., Sanchez-Fernandez, C., Kuulkers, E., et al. 2006b, ATel #756
- (25) Chenevez, J., Shaw, S.E., Kuulkers, E., et al. 2006a, ATel #734
- (26) Chernyakova, M. 2005, IBIS Analysis User Manual, OSA 5.1
- (27) Chou, Y., Grindlay, J.E. 2001,ApJ, 563, 934
- (28) Churazov, E., Gilfanov, M., Sunyaev, R., et al. 1993, A&AS, 97, 173
- (29) Churazov, E., Gilfanov, M., Sunyaev, R., et al. 1994, ApJS, 92, 381
- (30) Churazov, E., Gilfanov, M., Sunyaev, R., et al. 1995, ApJ, 443, 341
- (31) Claret, A., Goldwurm, A., Cordier, B., et al. 1994, ApJ, 423, 436
- (32) Clark, J.S., Goodwin, S.P., Crowther, P.A., et al. 2002, A&A, 392, 909
- (33) Cocchi, M., Bazzano, A., Natalucci, L., et al. 1999, A&A, 346, L45
- (34) Cordier, B., Goldwurm, A., Leray, J.P., et al. 1993, A&AS, 97, 177
- (35) Cook, W.R., Grunsfield, J.M., Heindl, W.A., et al. 1991, ApJ, 372, L75
- (36) Courvoisier, T.J.-L., Walter, R., Beckmann, V., et al. 2003, A&A, 411, L53
- (37) David, P., Laurent, P., Denis, M., et al. 1998, A&A, 332, 165
- (38) De Cesare, G., Bazzano, A., Stratta, G., Del Santo, M., Tarana, A., Ubertini, P. 2006, in “The X-ray Universe 2005”, ESA SP-604, p. 259
- (39) Del Santo, M., Bazzano, A., Zdziarski, A.A., et al. 2005, A&A, 433, 613
- (40) Del Santo, M., Sidoli, L., Bazzano, A., et al. 2006, in “The X-ray Universe 2005”, ESA SP-604, p. 283
- (41) Deluit, S., Bazzano, A., Mowlavi, N., et al. 2004, ATel #256
- (42) Ebisawa, K., Bourban, G., Bodaghee, A., Mowlavi, N., Courvoisier, T.J.-L. 2003, A&A, 411, L59
- (43) Eyles, C.J., Skinner, G.K., Willmore, A.P., Rosenberg, F.D. 1975, Nat, 257, 291
- (44) Falanga, M., Farinelli, R., Goldoni, P., Frontera, F., Goldwurm, A., Stella, L. 2004, A&A 426, 979
- (45) Falanga, M., Götz, D., Goldoni, P., et al. 2006, A&A, 458, 21
- (46) Ferrigno, C., Segreto, A., Santangelo, A., et al. 2006, A&A, in press [astro-ph/0610167]
- (47) Ford, E., Kaaret, P., Tavani, M., et al. 1996, ApJ, 469, L37
- (48) Forman, W., Jones, C., Tananbaum, H. 1976, ApJ, 207, L25
- (49) Gilfanov, M., Churazov, E., Sunyaev, R., et al. 1993, ApJ, 418, 844
- (50) Gottwald, M., White, N.E., Stella, L. 1986, MNRAS, 222, 21P
- (51) Goldoni, P., Kuulkers, E., Rodriguez, J., et al. 2006, ATel #742
- (52) Goldwurm, A., David, P., Foschini, L., et al. 2003, A&A, 411, L223
- (53) Goldwurm, A., Denis, M., Paul, J., et al. 1995, Adv. Space Res., 15, 41
- (54) Goldwurm, A., Vargas, M., Paul, J., et al. 1996, A&A, 310, 857
- (55) Grebenev, S.A., Sunyaev, R.A. 2004a, ATel #332
- (56) Grebenev, S.A., Sunyaev, R.A. 2004b, ATel #342
- (57) Grebenev, S.A., Lutovinov, A.A., Sunyaev, R.A. 2003, ATel #192
- (58) Grebenev, S.A., Molkov, S.V., Revnivtsev, M.G., Sunyaev, R.A. 2005b, ATel #447
- (59) Grebenev, S.A., Molkov, S.V., Sunyaev, R.A. 2005a, ATel #444
- (60) Grebenev, S.A., Molkov, S.V., Sunyaev, R.A. 2005c, ATel #616
- (61) Grebenev, S.A., Revnivtsev, M.G., Sunyaev, R.A. 2004b, ATel #257
- (62) Grebenev, S.A., Rodriguez, J., Westergaard, N.J., Sunyaev, R.A., Oosterbroek, T. 2004a, ATel #252
- (63) Harmon, B.A., Wilson, C.A., Fishman, G.J., et al. 2004, ApJS, 154, 585
- (64) Hasinger, G. van der Klis, M. 1989, A&A, 225, 79
- (65) Homan, J. 2005, ATel #440
- (66) in ’t Zand, J. 2001, in Exploring the gamma-ray universe, A. Gimenez, V. Reglero, and C. Winkler (eds.), ESA SP-459, ESA Publications Division, Noordwijk, p. 463
- (67) in ’t Zand, J.J.M. 2005, A&A, 441, L1
- (68) in ’t Zand, J., Heise, J., Bazzano, A., Ubertini, P., Muller, J. M., Smith, M. 1997, IAU Circ. 6618
- (69) in ’t Zand, J.J.M., Hulleman, F., Markwardt, C. B., et al. 2003, A&A, 406, 233
- (70) in ’t Zand, J., Verbunt, F., Heise, J., et al. 2004, in BeppoSAX 2003, The Restless High-Energy Universe, eds. E.P.J. van den Heuvel, J.J.M. in ’t Zand & R.A.M.J. Wijers, Nucl. Phys. B (Proc. Suppl.), 132, 486
- (71) in ’t Zand, J., Verbunt, F., Kuulkers, E., et al. 2002, A&A, 389, L43
- (72) Joinet, A., Jourdain, E., Malzac, J., et al. 2005, ApJ, 629, 1008
- (73) Jones, C., Forman, W., Tananbaum, H., et al. 1973, ApJ, 181, L43
- (74) Jonker, P.G., van der Klis, M. 2001, ApJ, 553, L43
- (75) Kalemci, E., Tomsick, J.A., Rothschild, R.E., Pottschmidt, K., Corbel, S., Kaaret, P. 2006, ApJ, 639, 340
- (76) Kennea, J.A., Burrows, D.N., Campana, S., Godet, O., Nousek, J., Gehrels, N. 2006a, ATel #753
- (77) Kennea, J.A., Wijnands, R., Burrows, D.N., Nousek, J., Gehrels, N. 2006b, ATel #920
- (78) Kennea, J.A., Wijnands, R., Burrows, D.N., Nousek, J., Gehrels, N. 2006c, ATel #921
- (79) Knight, F.K., Johnson III, W.N., Kurfess, J.D., Strickman, M.S. 1985, ApJ, 290, 557
- (80) Kretschmar, P., Mereghetti, S., Hermsen, W., et al. 2004, ATel #345
- (81) Kretschmar, P., Shaw, S.E., Kuulkers, E., et al. 2005, ATel #593
- (82) Krimm, H., Barbier, L., Barthelmy, S.D., et al. 2006, ATel #904
- (83) Kudryavtsev, M.I., Svertilov, S.I., Bogomolov, V.V. 2001, AstL, 27, 648
- (84) Kuulkers, E., Goldoni, P., Shaw, S.E., et al. 2006a, ATel #738
- (85) Kuulkers, E., Kretschmar, P., Brandt, S., et al. 2005b, ATel #642
- (86) Kuulkers, E., Shaw, S., Brandt, S., et al. 2006b, in The Transient Milky Way: a perspective for MIRAX, eds. F. D’Amico, J. Braga & R. Rothschild, AIP Conf. Proc. 840, p. 30 [astro-ph/0603130]
- (87) Kuulkers, E., Shaw, S., Paizis, A., et al. 2005a, ATel #438
- (88) Kuulkers, E., Shaw, S., Paizis, A., et al. 2006c, ATel #874
- (89) Kuulkers, E., van der Klis, M., Oosterbroek, T., et al. 1994, A&A, 289, 795
- (90) Kuznetsov, S.I., Gilfanov, M.R., Churazov, E.M., et al. 1999, AstL, 25, 351
- (91) Labanti, C., Di Cocco, G., Ferro, G., et al. 2003, A&A, 411, L149
- (92) Laurent, P., Goldwurm, A., Lebrun, F., et al. 1992, A&A, 260, 237
- (93) Laycock, S., Coe, M.J., Wilson, C.A., Harmon, B.A., Finger, M. 2003, MNRAS 338, 211
- (94) Lebrun, F., Leray, J.P., Lavocat, P., et al. 2003, A&A, 411, L141
- (95) Levine, A.M., Swank, J.H., Lin, D., Remillard, R.A. 2005, ATel #578
- (96) Lewin, W.H.G., Ricker, G.R., McClintock, J.E. 1971, ApJ, 169, L17
- (97) Lowes, P., in ’t Zand, J.J.M., Heise, J., et al. 2002, IAUC 7867
- (98) Lutovinov, A., Revnivtsev, M., Molkov, S., Sunyaev, R. 2005, A&A, 430, 997
- (99) Lutovinov, A., Cadolle Bel, M., Belanger, G., et al. 2004, ATel #328
- (100) Lund, N., Budtz-Jørgensen, Westergaard, N.J., et al. 2003, A&A, 411, L231
- (101) Mandrou, P., Roques, J.P., Bouchet, L., et al. 1994, ApJS, 92, 343
- (102) Markert, T.H., Winkler, P.F., Laird, F.N., et al. 1979, ApJS, 39, 573
- (103) Markwardt, C. 2006, in The Transient Milky Way: a perspective for MIRAX, eds. F. D’Amico, J. Braga & R. Rothschild, AIP Conf. Proc. 840, p. 45
- (104) Markwardt, C.B., Swank, J.H. 2003a, ATel #133
- (105) Markwardt, C.B., Swank, J.H. 2003b, ATel #136
- (106) Markwardt, C.B., Swank, J.H. 2005, ATel #414
- (107) Markwardt, C.B., Marshall, F.E., Swank, J.H., Cui, W. 1999, IAUC 7300
- (108) Markwardt, C.B., Swank, J.H., Marshall, F.E. 1999, IAUC 7120
- (109) Mas-Hesse, J.M., Giménez, A., Culhane, J.L., et al. 2003, A&A, 411, L261
- (110) Masetti, N. 2002, A&A 381, L45
- (111) McClintock, J.E., Remillard, R.A., 2006, in Compact Stellar X-ray Sources, eds. W.H.G. Lewin and M. van der Klis, Cambridge University Press, p. 157
- (112) Molkov, S.V., Grebenev, S.A., Sunyaev, R.A. 2005b, ATel #462
- (113) Molkov, S., Revnivtsev, M., Lutovinov, A., Sunyaev, R. 2005a, A&A, 434, 1069
- (114) Mowlavi, N., Kuulkers, E., Rodriguez, J., et al. 2005, ATel #453
- (115) Muno, M.P., Baganoff, F.K., Arabadjis, J.S. 2003b, ApJ, 598, 474
- (116) Muno, M.P., Baganoff, F.K., Bautz, M.W., et al. 2003a, ApJ, 589, 225
- (117) Muno, M.P., Lu, J.R., Baganoff, F.K. 2005b, ApJ, 633, 228
- (118) Muno, M.P., Pfahl, E., Baganoff, F.K., et al. 2005a, apJ, 622, L113
- (119) Natalucci, L., Bazzano, A., Cocchi, M., et al. 2004, A&A, 416, 699
- (120) Orr, A., Falanga, M., Cocchi, M., Laurent, P., Goldwurm, A. 2004, in Proc. 5th INTEGRAL Science Workshop, ‘The INTEGRAL Universe’, V. Schönfelder, G. Lichti, C. Winkler (eds.), ESA SP-552, p. 357
- (121) Paizis, A., Ebisawa, K., Tikkanen, T., et al. 2005, A&A, 443, 599
- (122) Paizis, A., Farinelli, R., Titarchuk, L., et al. 2006, A&A, 459, 187
- (123) Parmar, A.N., Kuulkers, E., Oosterbroek, T., et al. 2003, A&A, 411, L421
- (124) Pellizza, L.J., Chaty, S., Negueruela, I. 2006, A&A, 455, 653
- (125) Pereira, M.G., Braga, J., Jablonski, F. 1999, ApJ 526, L105
- (126) Pietsch, W., Voges, W., Reppin, C., Trümper, J., Kendziorra, E., Staubert, R. 1980, ApJ, 237, 964
- (127) Piraino, S., Santangelo, A., Ferrigno, C., et al. 2004, in “The X-ray Universe”, Proc. 5th INTEGRAL workshop, ESA SP-552, p. 369
- (128) Pottschmidt, K., Chernyakova, M., Zdziarski, A.A., Lubiński, P., Smith, D.M., Bezayiff, N. 2006, in “The X-ray Universe 2005”, ESA SP-604, p. 283
- (129) Reynolds, A.P., Parmar, A.N., Hakala, P.J., et al. 1999, A&AS, 134, 287
- (130) Remillard, R.A., Lin, D., Cooper, R.L., Narayan, R., 2006a, ApJ, 646, 407
- (131) Remillard, R., Levine, A.M., Morgan, E.H., Markwardt, C.B., Swank, J.H. 2006b, ATel #714
- (132) Revnivtsev, M., Chernyakova, M., Capitanio, F., et al. 2003, ATel #132
- (133) Revnivtsev, M.G., Sunyaev, R.A., Gilfanov, M.R., et al. 2004b, AstL, 30, 527
- (134) Revnivtsev, M.G., Sunyaev, R.A., Varshalovich, D.A., et al. 2004a, AstL, 30, 382
- (135) Rodriguez, J., 2003, ATel #194
- (136) Rubin, B.C., Finger, M.H., Harmon, B.A., et al. 1996, ApJ, 459, 259
- (137) Rupen, M.P., Mioduszewski, A.J., Dhawan V. 2005, ATel #441
- (138) Sakano, M., Koyama, K., Murakami, H., Maeda, Y., Yamauchi, S. 2002, ApJS, 138, 19
- (139) Shaposhnikov, N., Swank, J., Shrader, C.R., et al. 2006, ApJ, in press [astro-ph/0609757]
- (140) Shaw, S.E., Kuulkers, E., Turler, M., et al. 2005a, ATel #583
- (141) Shaw, S.E., Kuulkers, E., Oosterbroek, T., et al. 2005b, ATel #615
- (142) Shaw, S., Kuulkers, E., Paizis, A., et al. 2005c, ATel #442
- (143) Shaw, S.E., Zurita, J., Kuulkers, E., et al. 2006, ATel #731
- (144) Skinner, G.K., Foster, A.J., Willmore, A.P., Eyles, C.J. 1990, MNRAS, 243, 72
- (145) Skinner, G.K., Willmore, A.P., Eyles, C.J., et al. 1987, Nat, 330, 544
- (146) Smith, D.M., Heindl, W.A., Markwardt, C.B., Swank, J.H. 2001, ATel #66
- (147) Smith, D.M., Heindl, W.A., Swank, J.H. 2002, ApJ, 578, 129
- (148) Strohmayer, T., Bildsten, L. 2006, in Compact Stellar X-ray Sources, eds. W.H.G. Lewin and M. van der Klis, Cambridge University Press, p. 113
- (149) Sunyaev, R., Molkov, S., Lutovinov, A. 2003a, ATel #187
- (150) Sunyaev, R.A., Grebenev, S.A., Lutovinov, A.A., Rodriguez, J., Mereghetti, S., Gotz, D., Courvoisier, T. 2003b, ATel #190
- (151) Swank, J. 2004, ATel #301
- (152) Swank, J., Markwardt, C. 2001, in ASP Conference Proceedings 251, H. Inoue and H. Kunieda (eds.), Astronomical Society of the Pacific, San Francisco, p. 94
- (153) Swank, J.H., Remillard, R., Markwardt, C.B. 2005, ATel #576
- (154) Tarana, A., Bazzano, A., Ubertini, P., Federici, M. 2006b, in proceedings of the 6th INTEGRAL Workshop “The Obscured Universe”, R. Sunyaev, S. Grebenev & C. Winkler (eds.), ESA-SP 622, in press [astro-ph/0610325]
- (155) Tarana, A., Bazzano, A., Ubertini, P., Zdziarski, A.A. 2006a, ApJ, in press [astro-ph/0608599]
- (156) Tavani, M., Barret, D. 1997, in Proceedings of the Fourth Compton Symposium, C.D. Dermer, M.S. Strickman, and J.D. Kurfess (eds.), AIP Conf. Proc. 410, p. 75
- (157) Thompson, T.W.J., Tomsick, J.A., in ’t Zand, J.J.M., Rothschild, R.E., Walter, R. 2006, ApJ, submitted [astro-ph/0609424]
- (158) Turler, M., Shaw, S.E., Kuulkers, E., et al. 2006, ATel #790
- (159) Ubertini, P., Lebrun, F., Di Cocco, G., et al. 2003, A&A, 411, L131
- (160) van der Klis, M., Kitamoto, S., Tsunemi, H., Miyamoto, S. 1991, MNRAS, 248, 751
- (161) Vedrenne, G., Roques, J.-P., Schönfelder, V., et al. 2003, A&A, 411, L63
- (162) Walter, R., Bodaghee, A., Barlow, E.J., et al. 2004, ATel #229
- (163) Walter, R., Zurita Heras, J., Bassani, L., et al. 2006, A&A, 453, 133
- (164) Werner, N., in ’t Zand, J.J.M., Natalucci, L., et val. 2004, A&A, 416, 311
- (165) White, N.E., Becker, R.H., Boldt, E.A., Holt, S.S., Serlemitsos, P.J., Swank, J.H. 1981, ApJ, 247, 994
- (166) Williams, O.R., Oosterbroek, T., Parmar, A.N., Winkler, C. 2004, in Proc. 5th INTEGRAL Science Workshop, ‘The INTEGRAL Universe’, V. Schönfelder, G. Lichti, C. Winkler (eds.), ESA SP-552, p. 423
- (167) Wijnands, R., Miller, J.M., Wang, Q.D. 2002, ApJ, 579, 422
- (168) Wijnands, R., in ’t Zand, J.J.M., Rupen, et al. 2006, A&A, 449, 1117
- (169) Winkler, C., Courvoisier, T.J.-L., Di Cocco, G., et al. 2003, A&A, 411, L1
- (170) Zurita, J., Bazzano, A., Brandt, S., Domingo, A., Winkler, C., Grebenev, S. 2004, ATel #248
- (171) Zurita Heras, J.A., De Cesare, G., Walter, R., et al. 2006, A&A, 448, 261
Appendix A The Crab as the reference source


In order to derive the average Crab rates we used the Crab calibration observations, performed during revolution 300 (March 2005; MJD 53457–53459), 365 (October 2005; MJD 53654) and 422 (March 2006; MJD 53822–53824). They were performed during the same seasons as our monitoring observations. We only used those observations with similar instrument settings as our monitoring observations; they were analysed in the same way as described for our program (Sect. 3). The JEM-X and IBIS/ISGRI light curves are shown in Fig. 18. The IBIS/ISGRI 20–60 keV and 60–150 keV count rates are largely constant (i.e., within about 2%) across the central part of the field of view (see Fig. 19). The JEM-X count rates are constant within about 5% (3–10 keV) and (10–25 keV). The average count rates in the JEM-X 3–10 keV and 10–25 keV, and IBIS/ISGRI 20–60 keV and 60–150 keV, are 109.80.2 cts s-1, 46.00.1 cts s-1, 164.130.05 cts s-1 and 43.110.04 cts s-1, respectively.

Appendix B IBIS/ISGRI 20–60 keV sensitivity
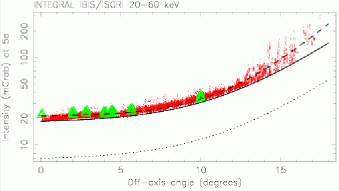
The 5 sensitivity of our Galactic bulge monitoring observations for the IBIS/ISGRI instrument in the 20–60 keV band was determined using Crab observations and as well as the monitoring observations themselves.
The Crab calibration observations, with exposure lengths in the range 1700–1800 s (i.e., similar to our monitoring observations), were selected from revolutions 300, 365 and 422 (see also Appendix A). For each Crab detection, the value of the 1 uncertainty on the Crab flux detection was multiplied by 5 and scaled by the average Crab flux to give an estimate of the 5 sensitivity of the observations as a function of the off-axis angle (the angular distance of the Crab from the center of the IBIS/ISGRI field of view). These points are shown as the green triangles Fig. 20.
In order to increase the sampling of the sensitivity curve over a wider range of off-axis angles, the same exercise was performed by taking the 1 uncertainty on every detection made in the Galactic bulge observations, with similar exposure times of 1800 s. These are shown as red dots in Fig. 20. It can be clearly seen that estimating the sensitivity from all detections agrees well with the data from the Crab, although there is some evidence that the sensitivity for the Crab observations could be systematically lower (i.e., the limiting fluxes are higher) than the Galactic bulge observations by a small amount. This may be because the brightness of the Crab leads to an increase in the background of the IBIS/ISGRI images.
The top dashed line in Fig. 20 is a fit of an exponential curve to the data (, where is the 5 sensitivity in mCrab and the off-axis angle in degrees). Below that the lower envelope of the points has been estimated to provide a lower limit to the sensitivity for a single 1800 s pointing; again an exponential has been used () and is shown by the continuous line.
An estimate of the sensitivity for a full hexagonal dither observation (i.e., 71800 s observations) has been performed by scaling the latter curve by 7 (the signal-to-noise ratio scales with the square-root of the exposure time; see, e.g., Goldwurm et al. 2003); this is shown as a dotted line in Fig. 20. Note that this should only be used as a guide to the observation sensitivity, since the hexagonal dither pattern means that each pointing within a pattern will have off-axis angles varying by 2∘. This indicates a 5 sensitivity, in the 20–60 keV band of about 7 mCrab for on-axis observations, rising to 8 mCrab at 5∘, 12 mCrab at 10∘ and above 27 mCrab outside of 15∘. We note that these sensitivity fluxes are consistent with the observed fluxes for sources detected around 5 in the mosaics per revolution. For more information on the IBIS/ISGRI sensitivities we refer to, e.g., Lebrun et al. (2003) and Bird et al. (2006).
Appendix C Mean fluxes from individual pointings versus average fluxes from overall mosaic image
As noted in Sect. 4.2 the mean fluxes computed by averaging the flux values (weighted by their errors) from all the single pointings are different with respect to flux values obtained from the mosaic image of all pointings together. There are mainly two reasons for this. While the mosaic image merges all the single pointings of a source (even those pointings where the source is too weak to be detected and contributes with a negative fluctuation), the single-pointing averaged fluxes are obtained by averaging only those single pointings where the source had a non-negative significance (and hence flux) value. This results in an overestimate of the mean flux, especially for weak sources or (bright) transient sources which are off for some time. Additionally, in the mosaic images the counts associated to a source are spread around a single central peak, resulting in a better source location. However, the source flux is then also somewhat reduced (by 10%; see, e.g., Chernyakova 2005). In Fig. 21 we show these effects by plotting the mosaic flux (from Table 3) versus the mean flux (from Table 6) values for those source where the significance value of detection is higher than 7. The continuous line represents where the mean flux equals the mosaic flux, whereas the dotted line represents where the mosaic flux is 10% lower than the mean flux. Permanently bright (typically 20 mCrab) sources indeed show a mosaic flux which is about 10% lower than the mean flux. The weaker sources and bright transient sources (notably GRO J165540 and 1E 1740.72942) clearly show the additional offset, due to our method of averaging, in the mosaic flux with respect to the mean flux.
