Resolved Spectroscopy of a Gravitationally Lensed L∗ Lyman-break Galaxy at z5
Abstract
We exploit the gravitational potential of a massive, rich cluster at to study the internal properties of a gravitationally lensed galaxy at =4.88. Using high resolution HST imaging together with optical (VIMOS) and near-infrared (SINFONI) Integral Field Spectroscopy we have studied the rest-frame UV and optical properties of the lensed galaxy seen through the cluster RCS0224-002. Using a detailed gravitational lens model of the cluster we reconstruct the source-frame morphology on 200pc scales and find an L∗ Lyman-break galaxy with an intrinsic size of only 2.00.8 kpc, a velocity gradient of 60 and an implied dynamical mass of 1.01010 within 2 kpc. We infer an integrated star-formation rate of just 122 from the intrinsic [Oii]3727 emission line flux. The Ly emission appears redshifted by +20040 with respect to the [Oii] emission. The Ly is also significantly more extended than the nebular emission, extending over 11.92.4 kpc. Over this area, the Ly centroid varies by less than 10. We model the asymmetric Ly emission with an underlying Gaussian profile with an absorber in the blue wing and find that the underlying Ly emission line centroid is in excellent agreement with the [Oii] emission line redshift. By examining the spatially resolved structure of the [Oii] and Ly emission lines we investigate the nature of this system. The model for local starburst galaxies suggested by Mass-Hesse et al. (2003) provides a good description of our data, and suggests that the galaxy is surrounded by a galactic-scale bi-polar outflow which has recently burst out of the system. The outflow, which appears to be currently located 30 kpc from the galaxy, is escaping at a speed of upto 500 . Although the mass of the outflow is uncertain, the geometry and velocity of the outflow suggests that the ejected material is travelling far faster than escape velocity and will travel more than 1 Mpc (comoving) before eventually stalling.
keywords:
galaxies: high redshift; galaxies: starburst; gravitational lensing; galaxy clusters; Integral Field Spectroscopy; Gravitational Arcs: Individual: RCS0224-002
1 Introduction
One of the most important observational breakthroughs in recent years was the discovery that a significant fraction of high-redshift galaxies are surrounded by “superwinds” (e.g. Pettini et al., 2002; Shapley et al., 2003; Bower et al., 2004; Wilman et al., 2005) – starburst and/or AGN driven outflows which expel gas from the galaxy potential, hence playing no further role in the star-formation history of the galaxy. This phenomenon is beginning to be understood by theorists as the missing link in galaxy formation models which are otherwise unable to match the shape and normalisation of the luminosity function (Benson et al., 2003; Baugh et al., 2005). These feedback processes may also offer natural explanation as to why only 10% of baryons cool to form stars (the Cosmic Cooling Crisis; White & Rees 1978; Balogh et al. 2001).
However, important questions remain unanswered. Evidence for these superwinds is usually based on observations which compare the nebular emission line properties with the rest-frame UV emission and absorption lines (such as Ly, H and UV ISM absorption lines; e.g. Erb et al. 2003). Velocity offsets of several hundred km/s have been measured, suggestive of large scale outflows comparable to starburst driven winds often observed in low-redshift Ultra-Luminous Infra-Red Galaxies (ULIRGs) in the local Universe (Martin, 2005). However, the current data lack spatial information, which is vital if we are to understand if material escapes into the Inter-Galactic Medium (IGM) or whether the outflowing material eventually stalls, fragments and drains back onto the galaxy, potentially disrupting the disk and causing further bursts of star-formation.
The key to resolving these issues is to identify similar features in the spatially resolved spectra of distant, young galaxies. However, at the redshifts where these feedback processes are at their peak activity (above 2, i.e. when galaxies were most rapidly forming stars), the immense luminosity distances mean that the emission line fluxes of these distant galaxies are dramatically reduced. This problem is compounded by the fact that the nebular emission lines (such as [Oii], [Oiii] and H) are redshifted into the near-infrared, where the sky background is an order of magnitude brighter than in the optical. Coupled with the fact that galaxies at these redshifts typically have disk scale lengths of only a few kpc, even with adaptive optics assisted observations on eight to ten meter telescopes, only a handful of independent pixels can be recovered from a distant galaxy.
By necessity therefore, above most detailed studies of individual galaxies have concentrated on the most luminous (and therefore usually very active and massive) systems (Bower et al., 2004; Wilman et al., 2005; Swinbank et al., 2005), with very few “normal” galaxies being studied in detail beyond (Pettini et al., 2002, 2000; Teplitz et al., 2000; Förster Schreiber et al., 2006; Genzel et al., 2006). One way to overcome this problem is to use the deep potential of massive galaxy clusters to boost the flux and sizes of images of distant galaxies which serendipitously lie behind them. This natural magnification provides the opportunity to study intrinsically faint high redshift galaxies with a spatial resolution that cannot be attained via conventional observations (Smail et al., 1996; Franx et al., 1997; Teplitz et al., 2000; Ellis et al., 2001; Campusano et al., 2001; Smith et al., 2002; Swinbank et al., 2003; Kneib et al., 2004; Swinbank et al., 2006).
The natural magnification caused by the gravitational lens allows us to spatially resolve the morphologies and internal dynamics of galaxies in a level of detail far greater than otherwise possible. For the galaxy discussed in this paper, the amplification factor of sixteen corresponds to an increase of over three magnitudes and makes it possible to study the galaxy on independent spatial scales of 200pc at 5. In contrast, without a gravitational lens, 1′′ corresponds to 6.5 kpc at =4.88.
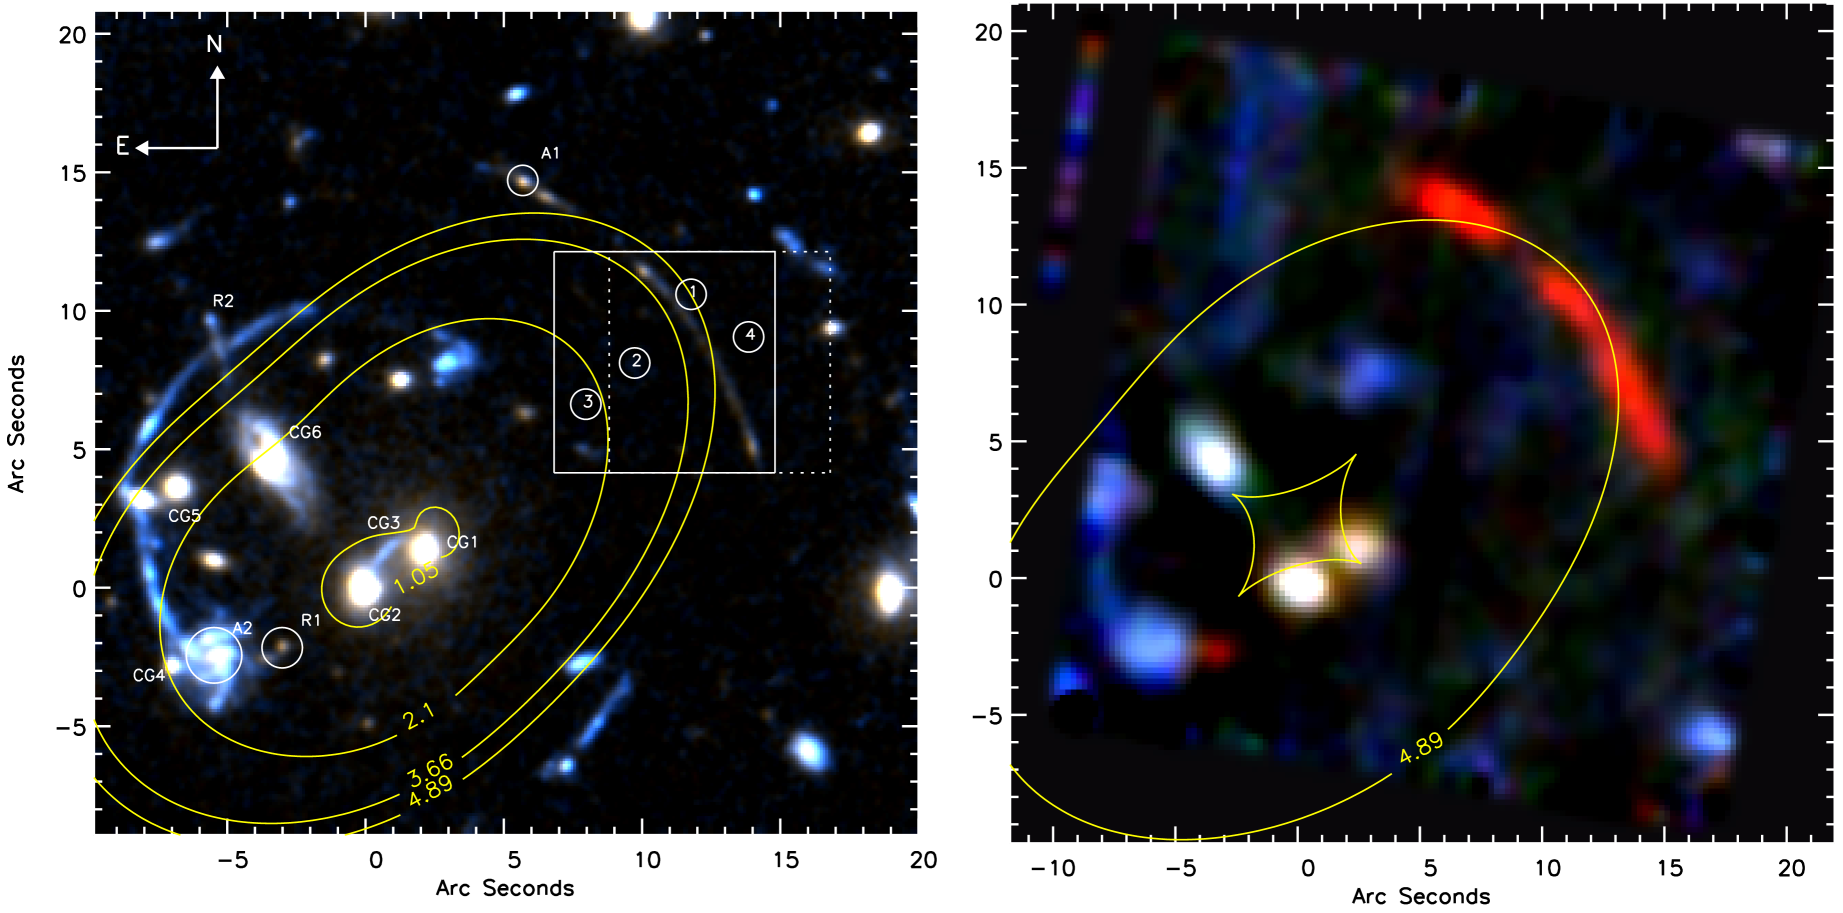
In this paper we present a VLT/IFU study of the gravitationally lensed galaxy behind the core of the rich lensing cluster RCS0224-002. This galaxy cluster was identified as having a significant concentration of red galaxies in the inner regions by Gladders et al. (2002). Follow-up spectroscopy confirmed a redshift for the cluster of 0.7730.0021. The ground based imaging from Gladders et al. (2002) shows several tangential arc-like structures, many of which resemble images of lensed, background galaxies. One of the most striking of these is a multiply imaged arc approximately 15′′ to the North-East of the Brightest Cluster Galaxy (BCG) (see Fig. 1). Follow-up spectroscopy by Gladders et al. (2002) yielded a redshift of =4.88 from identification of a strong Ly emission line at 7148Å.
We concentrate on the dynamics and star-forming properties of the =4.88 arc observed through the rest-frame UV spectra with the VIMOS IFU and through the nebular ([Oii]3726.1,3728.8Å) emission line doublet observed with the SINFONI IFU in the near-infrared. The IFU data provide a two-dimensional map of the galaxy’s properties in sky co-ordinates. In order to interpret this map we must correct for the magnification and distortion caused by the lensing potential using a mass model for the cluster lens. This model is constrained by requiring it to account for the positions and redshifts of the gravitationally-lensed arcs in the cluster. The lensing model then allows us to determine the source plane morphology and geometry of the continuum and line emission we use.
The structure of this paper is as follows. In §2, we present the data on which this paper is based: a combination of Hubble Space Telescope (HST), ground-based imaging, and integral field spectroscopy obtained with the SINFONI and VIMOS IFUs on the VLT. In §3 we present the source-plane properties of the arc and the spatially resolved spectroscopy and in §4 and §5 we present our discussion and conclusions respectively. Through-out this paper we use the Vega magnitude system and assume a cosmology with , and .
2 Observations and Data Reduction
2.1 HST imaging
HST WFPC2 and Vband observations of the lensing cluster RCS0224-002 were obtained from the HST public archive111PID: 9135; Obtained from the Multimission Archive at the Space Telescope Science Institute (MAST). STScI is operated by the Association of Universities for Research in Astronomy, Inc., under NASA contract NAS5-26555. Support for MAST for non-HST data is provided by the NASA Office of Space Science via grant NAG5-7584 and by other grants and contracts.. The and -band observations were 10.5 and 8.4 ks respectively and the data were reduced using the standard stsdas package in iraf. The resulting image (Fig. 1) covers the brightest central cluster galaxies and the target arc at a resolution of 0.0996′′/pixel. From the HST imaging the =4.88 arc is red (=1.70.1) with an average surface brightness of =25.0 and an integrated magnitude of =22.2.
2.2 VIMOS Integral Field Spectroscopy
The =4.88 arc was observed with the VIMOS IFU (LeFevre et al., 2003) for a total of 43.2ks (split into 162700 second exposures) between 2004 December 16 and 2005 December 12 in 0.6′′ seeing and photometric conditions. We used the MR-orange grism which results in a field of view of 27′′27′′ at 0.67′′ per pixel and a spectra resolution of /1100 at 7000Å. To reduce the data we used the VIMOS esorex pipeline which extracts, wavelength calibrates and flat-fields the data. The final datacubes cover a wavelength range of 5000-11000Å and has a resolution of 6.6Å FWHM (measured from the width of the sky-lines at a wavelength of 7150Å). In all future sections, line widths are deconvolved for instrumental resolution. Flux calibration was achieved by using observations of ESO standard stars. These observations were taken either immediately before, or immediately after the science observations and were reduced in an identical manner. Since there are no point sources in our datacubes, we measure the seeing from the standard stars in the collapsed datacubes and derive typical seeing measurement of 0.8′′ at a typical airmass 1.1. During the standard star observation, the ESO seeing monitor registered median seeing of 0.7′′ – hence we conservatively assume that the VIMOS IFU observations were taken in 0.8′′ seeing.
After reducing each of the observations to a datacube, we construct and apply a master flat-field in order to correct for the fringing effects which are particular prominent above 8000Å. In each of the (spatially dithered) datacubes we construct a broad-band image by collapsing the datacube in wavelength between 6000Å and 7500Å and mask out the the brightest objects. We then apply this mask at each wavelength and stack the resulting datacube (without spatial offsets and ignoring masked pixels). This produces a “master-flatfield” which is then divided into each of the science observations to reduce the effects of the fringing. These individual datacubes are then sky-subtracted by masking the brightest objects in the individual frames and constructing a sky-spectrum by collapsing the datacube in both spatial dimensions (since the four quadrants of the VIMOS IFU have slightly different throughput’s, we note that the sky-subtraction was performed quadrant-by-quadrant). To build the final datacube, we create broad band images from each datacube and cross correlate these in order to spatially align and create the final mosaic. The final datacube is created using an average with a 3 clip to reject cosmic rays.
In Fig. 1 we show a colour image of the cluster
and arc, generated from the datacube. We generate three colours from
the datacube by collapsing the datacube between 5000-6000Å,
6000-7000Å and 7000-8000Å as blue, green and red respectively.
Alternatively, the data-cube can be viewed as a sequence of wavelength
slices to make an animation (this can be viewed at:
http://star-www.dur.ac.uk/ams/lensing/RCS0224z5/ )
2.3 SINFONI IFU Observations
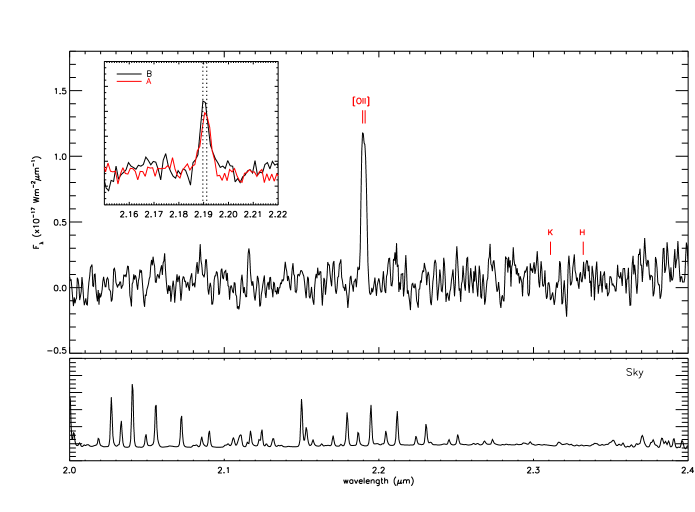
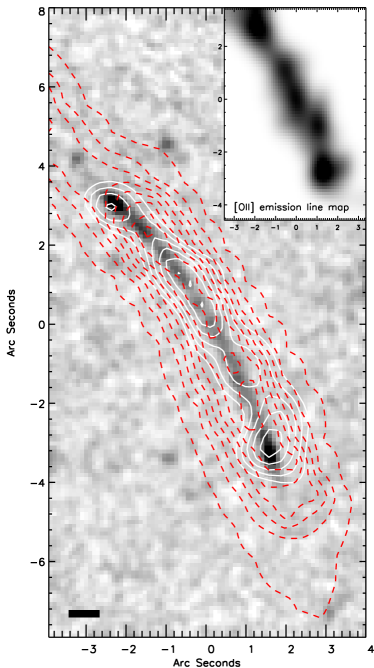
To map the nebular emission line properties of the =4.88 arc, we used the SINFONI IFU (Eisenhauer et al., 2003). At =4.88 the [Oii]3726.1,3728.8 emission line doublet is redshifted to 2.19m and into a stable part of the -band relatively free from strong OH airglow emission. The SINFONI IFU uses an image slicer and mirrors to reformat a field of 1010′′ at a spatial resolution of 0.25′′/pixel. We used the HK grating which results in a spectral resolution of /=1700 at 2.20m (the sky-lines have a resolution 13Å FWHM at this wavelength) and covers a wavelength range of 1.451 to 2.463m. In all future sections, emission line widths are deconvolved for the instrumental resolution. To observe the target we used ABBA chop sequences, however since the arc only filled one half of the datacube, we chopped 2′′ West to sky (see Fig. 1), thus keeping the object inside the IFU. We observed the target for a total of 43.2 ks (split into 162700 second exposures) between 2005 August 10 and 2005 September 28 in 0.6′′ seeing and photometric conditions. Individual exposures were reduced using the SINFONI esorex data reduction pipeline which extracts, flatfields, wavelength calibrates and forms the datacube. The final datacube was generated by aligning the individual data-cubes and then combining the using an average with a 3 clip to reject cosmic rays. For flux calibration, standard stars were observed each night during either immediately before or after the science exposures. These were reduced in an identical manner to the science observations. In Figure 2 we show the one-dimensional spectrum of the arc (generated by collapsing the datacube over the object in both spatial domains) and in Figure 3 we also show a narrow-band image of the arc generated by collapsing the datacube in the wavelength direction over the [Oii] emission line. Figure 3 also shows the HST image of the arc with the contours from the [Oii] and Ly overlaid.
3 Analysis & Results
3.1 Mass Modelling
Reconstruction of the intrinsic properties of the galaxy at requires removal of the gravitational magnification from the observables. We therefore use the four spectroscopically confirmed images of the galaxy to constrain a model of the mass distribution in the cluster. These four images comprise the three images in the tangential arc identified by Gladders et al. (2002) and the fourth image identified via our integral field spectroscopy (Appendix A). The candidate radial arc at (A3 in Fig. 1; Sand et al. 2005) and the object identified at adjacent to the arc (A1 in Fig. 1) appear not to be multiply-imaged, and so are not included as constraints. The configuration of the four observed images and the lack of strong radial amplification of the fourth image implies that the fifth image lies very close to the centre of the cluster mass distribution. We therefore expect the fifth image to be strongly de-magnified and thus likely undetectable in the current data. We identify the dense knot of emission in each of the four observed images as being images of the same underlying region of the galaxy, and use the position of these knots to constrain the model. Following Appendix A of Smith et al. (2005), the number of constraints is therefore .
The central region of RCS0224 contains two bright elliptical galaxies: CG1 and CG2 (Fig. 1) – we therefore construct a three component model comprising the cluster-scale mass distribution (dark matter and gas), CG1 and CG2. We parametrise all three mass components as truncated pseudo-isothermal elliptical mass distributions, each described by the following parameters: (Kassiola & Kovner, 1993; Kneib et al., 1996) – i.e. 21 parameters in total, comprising the center, ellipticity, position angle, core radius and cut-off radius of each mass component. To obtain a well-constrained model, (and given the number of constraints above: ) we prefer no more than 6 of these 21 parameters to be free parameters in the lens model. The geometrical parameters () describing CG1 and CG2 are therefore matched to their 2-dimensional light distributions, and their respective and parameters are matched to the shape of the light profile of each galaxy. Finally, the mass-to-light ratio of each galaxy is fixed by matching their velocity dispersions to the measured velocity dispersion (Table LABEL:table:cluster_members). Turning to the parameters describing the cluster-scale mass, we fix both and at and respectively. The former value is representative of massive clusters, and our decision to fix this parameter is caused by the non-detection of the central fifth image of the arc. The lack of the fifth image reduces our ability to constrain the radial shape of the mass distribution within the tangential critical curve. We also run models with and to confirm that the final results are not altered by the adopted value of . For completeness, we include the result of this check in the error on the lens magnification calculated below. Fixing is motivated by the small field of view of the HST data and within those data the small angular scale subtended by the strong lensing constraints. We are therefore unable to constrain this parameter, but our results are insensitive to its value. In summary, we therefore fit a model with five free parameters to the data. The free and fixed parameters are listed in Table 1.
All of the lens modelling is performed using the lenstool software (Kneib, 1993; Kneib et al., 1996), incorporating a Markov Chain Monte Carlo (MCMC) sampler (Jullo et al. 2006, in preparation). The model parameters with the lowest found with this MCMC approach and confidence intervals around these parameters values after marginalising over the other four parameters in each case, are listed in Table 1, and we show the critical curve of the best fit model in Fig. 1. The lens model predicts the fifth image to lie at the center of CG1 and to be very faint – , i.e. de-magnified by magnitudes relative to the tangential arc. Although the model makes a clear prediction for the location of this image, it is clearly too faint to detect with the available data. We ray-trace the galaxy through the family of models within the confidence surface in the 5-dimensional parameter space to compute the mean, luminosity weighted magnification of =162 (which corresponds to m=3.00.2 magnitudes).
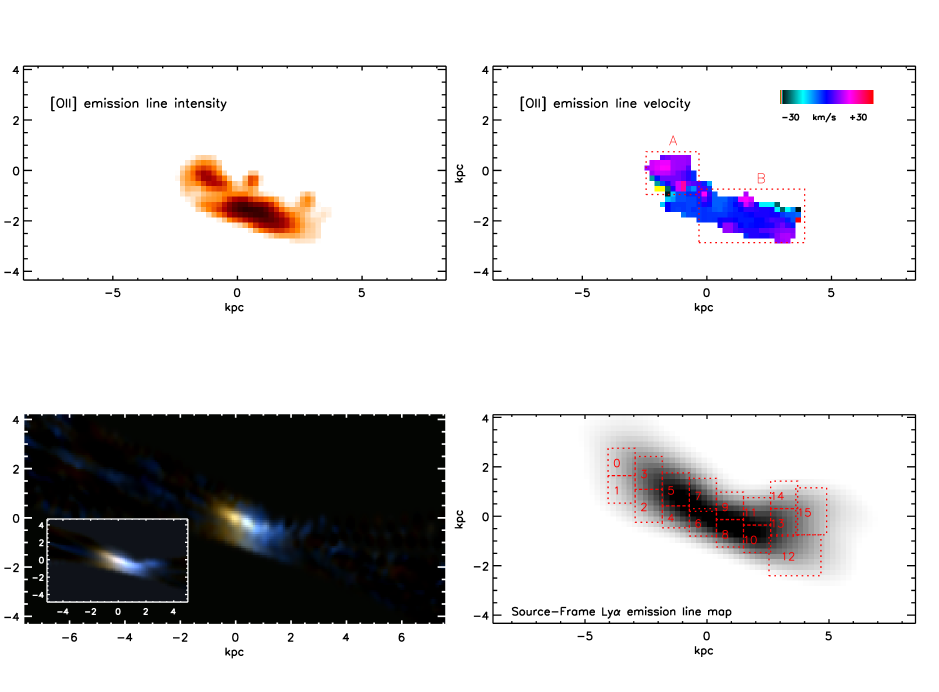
Accounting for the lensing magnification, the intrinsic magnitude of this galaxy is =25.2. In comparison, deep imaging surveys of Lyman-break galaxies at z5 have derived an of 25.3 (Ouchi et al., 2004). This suggests that the 4.88 galaxy is typical of the UV continuum selected LBG population at this redshift. In Fig. 4 we show the reconstructed HST image of the galaxy. In the source-plane the galaxy has a FWHM of only 2.00.8 kpc, and indicates a flattened (or bar-like) geometry. Such an elongated morphology is not unusual for galaxies at these redshifts: in a recent high-resolution imaging survey of LBGs at z2.5 with HST, Navindranath et al. (2006) concluded that upto 50% of LBGs show evidence for bar-like morphologies (with mean scale lengths of 1.7–2.0 kpc). Thus the galaxy appears typical in terms of its source plane morphology, brightness and size of the population at .
Table 1.
Gravitational Lens Model Parameters
| (′′) | (′′) | (deg) | (kpc) | (kpc) | (km/s) | ||
|---|---|---|---|---|---|---|---|
| DM halo | [] | [] | |||||
| CG1 | [] | [] | [] | [] | [] | [] | [] |
| CG2 | [] | [] | [] | [] | [] | [] | [] |
3.2 Spatially Resolved Spectroscopy
3.2.1 Nebular emission
By fitting a double Gaussian profile of fixed separation (corresponding to the redshifted separation of the doublet) and intensity but variable width, redshift and intensities of the doublet to the collapsed spectrum, the [Oii] emission yields a systemic redshift of 4.87570.0010 and and intrinsic width of =10020 (in the rest-frame of the galaxy). We assume that the [Oii] maps the systemic redshift and all velocities are given with respect to this value. The integrated emission line flux of 5110-20 suggests a star-formation rate (corrected for lensing amplification, but uncorrected for reddening) of 122 (assuming the calibration of L([Oii]) to SFR given in Kennicutt 1998).
In Figure 2 we show the intensity distribution and collapsed spectrum of the [Oii] emission. Intensity and velocity maps were derived by fitting the [Oii] emission line doublet in each 0.25′′ pixel using the same technique described above. We used a minimisation procedure, taking into account the greater noise of at the positions of the sky-lines. In cases where the fit failed to detect the line the region was increased to 22 pixels (0.50.5′′). Using a continuum fit, we required a minimum signal-to-noise of 3 to detect the line, and when this criterion is met, we fit the [Oii] emission line doublet with a Gaussian profile of fixed separation allowing the central wavelength and normalisation to vary. In Figure 4 we show the intensity distribution and velocity structure of the [Oii] emission line flux.
It is clear that the brightest components in the rest-frame UV are also the brightest in the [Oii] emission. In the source plane we find that the eastern most component is marginally redshifted relative to the western component. Relative to the combined spectrum, the eastern region has (with a velocity dispersion of =8018), while the western component is at +2015 (and a velocity dispersion of 8512). The quoted uncertainty here is dominated by possible variations in the [Oii] doublet line ratios, which was left free in these fits.
Since the [Oii] velocity dispersion () reflects the dynamics of the gas in the galaxies’ potential well we estimate the dynamical mass of the galaxy. Following the same prescription of Erb et al. (2006), we use the velocity dispersion and spatial extent of the [Oii] flux to infer a dynamical mass of within a radius of 2 kpc. Clearly this mass has large uncertainties since the mass depends on the mass density profile, velocity anisotropy and relative contributions to from random motions or rotation and possible differences between the total mass and that of the tracer particles used to measure it. Nevertheless, it is worth noting that the mass we derive is a factor of smaller than the median dynamical mass of z3 LBGs from Erb et al. (2006) measured in exactly the same way.
3.2.2 Ly
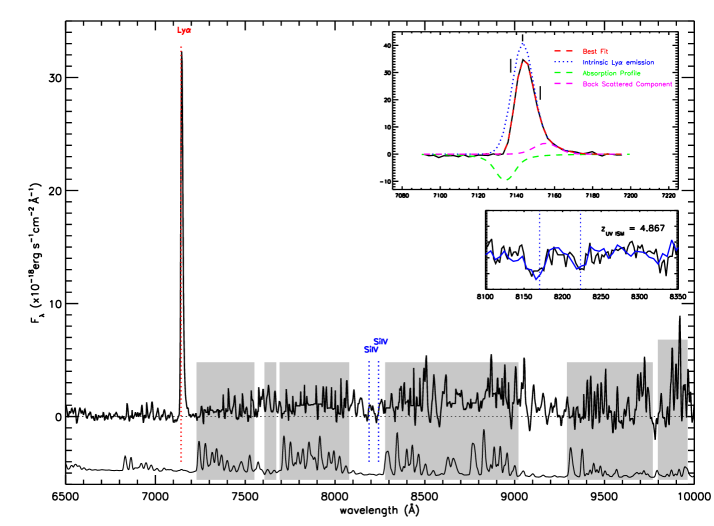
In Fig 4 we show the reconstructed source-plane Ly morphology of the arc. It is immediately apparent that in the source-plane, the Ly is more extended than the [Oii], or the continuum light, extending over 11.92.4 kpc (FWHM). Figure 5 shows the collapsed spectrum of the arc overlaid with the expected position of the Ly emission line for the systemic redshift (we also mark the expected position of the UV ISM lines which lie in regions of the sky free from strong OH airglow emission). The integrated Ly line flux is 3.70.510-15erg s-1cm-2, corresponding to a star-formation rate of 52 (unlensed). In comparison the 1500Å continuum flux suggests a star-formation rate of 32 (Kennicutt, 1998).
From the collapsed spectrum of the galaxy we measure a redshift from the centroid of the Ly emission line and measure a velocity offset from the systemic redshift of +20040. Velocity offsets of this magnitude between Ly and nebular emission lines (such as [Oii] or H) are a common feature of galaxies at 3 (Shapley et al., 2003; Erb et al., 2003). In both the collapsed spectrum (Fig. 5) and the spatially resolved spectra (Fig. 6) the strong Ly from the galaxy shows an asymmetric profile in which the blue wing of the Ly is absorbed, presumably giving rise to the apparent redshift offset between the [Oii] and Ly. It is also clear that there is an extended wing of emission in the red side of the line.
Asymmetry in the Ly emission line spectra of LBGs at 2–3 are common and often give rise to velocity offsets of several hundred km/s. These velocity offsets are usually attributed to galactic-scale outflows, presumably powered by supernovae. However, since the optical depth of the Ly forest is an order of magnitude larger at than at , (where most spectroscopic studies have taken place) we first investigate whether the IGM could cause the absorption in the blue wing of the emission line.
At the mean optical depth of the Ly forest is 1.70.2 (Fan et al., 2006) which corresponds to a transmitted flux of 20%. We therefore investigate whether the Ly profile could be explained as the result of average IGM absorption, or whether the absorption needed to be due to material associated with the lensed galaxy. The mean optical depth is measured by averaging the absorption of individual clouds on scales of 6000 (6 Mpc comoving). We fit the Ly emission line with an underlying Gaussian emission line profile (centred on the systemic redshift of the galaxy as measured from the [Oii] emission), convolved with a step function which models the average IGM (all profiles are then convolved with the instrumental resolution). We also include a broad Gaussian emission line profile (also centred at the systemic redshift) to account for the extended red wing of emission. Allowing the redshift of the IGM component to vary we find that an acceptable match emission line shape is best matched when the IGM step function is placed between -80 and +10 from the galaxy (between -85 kpc and +10 kpc comoving for out adopted cosmology). This is inconsistent with our assumption of a large-scale average absorption, implying that the absorption we see results from an individual cloud (or clouds) lying close to the target galaxy.
Moreover, a simple step function fails to adequately reproduce the line shape of the blue wing. A better fit is obtained if the line shape is instead modified by a single absorbing cloud. We model the emission profile by Gaussian profile combined with a Voigt profile absorber in the blue wing. In this fit the wavelength of the underlying best fit Gaussian profile (blue dotted line in Fig 5) was allowed to vary, but the fitted centroid at 7143.00.5Å (4.87580.0001) is in excellent agreement with the nebular emission line redshift as measured from [Oii]. This underlying Gaussian profile also has a width of =4.8Å (=200 in the rest-frame of the galaxy). The absorber in the blue wing of the Ly emission (green dashed line) has a centroid of 7138.00.1Å (=4.87170.0001, or relative to the intrinsic emission) and a width of 100. Since the flux in the Voigt profile reflects the column density of the neutral gas, we infer cm-2 and =11050. The large uncertainties in the value of and reflect that fact that the inferred value of lies between the flat and linear part of the curve of growth for Hydrogen.
With this two component model we are able to fit the asymmetry in both the collapsed and spatially resolved spectra. However, even with two components there remains excess flux in the red wing of the emission line. To compensate for this emission, we also fit a third Gaussian profile component in the red wing, again allowing the redshift, width and intensity to vary. The improvement between the three fit and two fit models is (; depending on whether we fit the individual spectra or the combined spectrum). The best fit model therefore includes a third component with redshift centroid at 7153.44 (=4.8860) and a width of =260. The velocity offsets of the three components are summarised in Table 2. As we discuss in § 4, this third component may naturally arise from Ly photons back-scatter on the interior of an outflowing shell. Thus the best-fit model to the asymmetric Ly emission is one in which the Ly photons are generated in similar regions (and at the same redshift) as the [Oii], but the emission profile is modified by foreground neutral material. This foreground material absorbs/scatters photons from the blue wing of the line, causing an apparent redshift offset between the nebular emission and Ly.
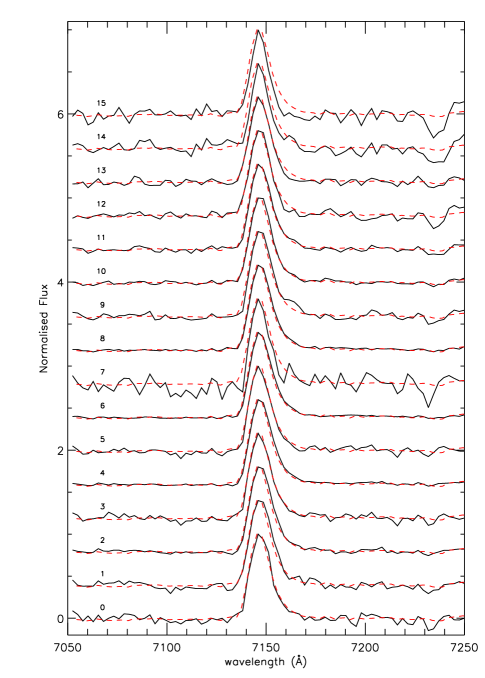
The description of the line profile given above is typical of the emission profile seen in other Lyman break galaxies. The key advantage of observing the lensed system is that we are able to spatially resolve the emission line, and hence investigate the spatial variations in the absorption and emission. We divide the IFU data cube into the spatial regions shown in Fig. 4. For reference these have been labelled 0-15. The resulting spectra are shown in Fig. 6. The most striking feature of this figure is that (apart from variations in intensity) the line profile appears remarkably constant across the galaxy. For each spatial element, we measure the centroid of the emission and find that the intrinsic emission line centroid varies by less than 10 (rest-frame) across the whole galaxy image (this value was derived by both fitting the 2 and 3 component models above). Indeed, as Fig. 6 shows, the asymmetry in the Ly profile is evident across the whole galaxy. Applying a free fit, each of the individual spectra is consistent with the mean, with the maximum =1.3 (and an average 0.5). From the position of the Voigt absorber, we also note that the blue-edge of the emission line cuts off at a wavelength corresponding to variations of less than 20 at a redshift of 4.87170.0001. This constancy in the line shape and centroid across the galaxy image is discussed further below.
3.2.3 UV absorption
In the integrated rest-frame UV continuum spectrum of the galaxy, we also detect the weak Siiv(1393,1402.77) absorption features. Whilst these are very weak in our spectra (the S/N in continuum in regions free from strong sky emission is only 3), the separation between the doublet is 9.800.15Å (rest), is in excellent agreement with the expected value of 9.77. To calculate the redshift of these absorption lines we cross correlate the spectrum around 8200Å with the rest-frame UV composite spectrum of Lyman break galaxies from Shapley et al. (2003) and find that these absorption lines are blue-shifted by 400100 (=4.8700.0007) from the systemic redshift as defined by the [Oii] emission line (Figure 5). It is worth noting that in the LBG composite spectrum from Shapley et al. (2003) the interstellar absorption features (Oi1303+Siii1260) are detected with similar significance as the Siiv. However, at these are redshifted to 7656Å and into the middle of the Frauenhoffer A-band and therefore are therefore not expected to be detected.
The observed velocity offsets between the nebular ([Oii]), Ly and UV ISM lines are therefore consistent with the situation seen in most high-redshift Lyman Break Galaxies where velocity offsets of several hundred km/s have been measured (e.g. Erb et al., 2003; Steidel et al., 2004). These velocity offsets are attributed to starburst driven superwinds and we base much of our interpretation on this model.
Table 2.
Properties of the emission and absorption lines
| Component | v | vshear | ||
|---|---|---|---|---|
| [Oii] | 4.8757[5] | 0 | 10030 | 3030 |
| Ly (Principle) | 4.8760[5] | +2050 | 23040 | 20 |
| Ly (red wing) | 4.8860[15] | +520150 | 26080 | 50 |
| Ly (blue abs. ) | 4.8680[10] | 500100 | 11030 | 20 |
| Siiv absorption | 4.8700[10] | 400100 | 480 | 150 |
4 Discussion
Before attempting to interpret the observations, we briefly review the results of the observations. The [Oii] emission maps the star-forming regions, which appear to have an elongated (bar-like) morphology with a spatial extent of only 2.00.8 kpc, which appears to contain all of the stars in the galaxy. We use the [Oii] emission to infer a systemic redshift of 4.87570.0005. Using the [Oii] emission we infer an integrated star-formation rate of 122 (Kennicutt, 1998) and the spatial extent and line width of the [Oii] suggest a dynamical mass of 110 within 2 kpc. Turning to the rest-frame UV spectrum: the Ly emission is much more extended than the [Oii], extending over 11.92.4 kpc (i.e. at least a factor of 4 the spatial extent of the [Oii]). Moreover, the peak of the Ly emission is redshifted by +20040 from the [Oii]. Across the whole spatial extent, the Ly emission line centroid varies by less than 10 (rest-frame) and the line profile is remarkably constant over the same spatial extent. The Ly emission (both in the collapsed spectrum and spatially resolved) has an asymmetric profile which is best explained by a three component model. The underlying Gaussian emission line profile has a centroid in excellent agreement with the nebular emission, an absorber which is blue-shifted by 500100 from the systemic redshift and an extended “red wing” of emission is redshifted by +520150. Finally, the UV ISM lines of Siiv are blue-shifted by -400 from the systemic redshift, although it has not been possible to derive any spatial information across the galaxy from these weak lines.
4.1 A starburst with a bi-conical outflow?
The observed velocity offsets between the [Oii], Ly and UV ISM lines in RCS0224arc are consistent with situation seen in most high redshift Lyman Break Galaxies in which the presence of “superwinds” (driven by the collective effects of star-formation and supernovae) naturally explain the observations. Our spatially resolved spectra therefore offer us the opportunity to study the spatial structure and energetics of the outflowing material in this galaxy.
The velocity offset between the [Oii] and transmitted Ly emission profile are usually interpreted in terms of a starburst driven outflow. This model provides a good description of the integrated line emission profiles of high redshift galaxies and more detailed observations of local star bursts (eg., Pettini et al. 2002; Shapley et al. 2003; Tenorio-Tagle et al. 1999; Heckman et al. 2000; Grimes et al. 2006). Here we investigate the implication for this model from the spatially resolved profile that we have observed. We base our interpretation on the specific models of Mas-Hesse et al. (2003) which assume that the spatially compact [Oii] nebular emission traces the star forming regions in the nucleus of a star-bursting galaxy.
In these models, the velocity offsets between [Oii] and Ly is generated by a star forming region embedded in an outflowing bubble. The models have been extensively investigated in local starburst galaxies where similar spatially resolved data is available. Indeed, there is strong similarity between the data we present, and the local galaxy Haro 2 studied by Mas-Hesse et al. (2003). The spatial extend (500 pc) and velocity shift () seen in Haro 2 are smaller than the galaxy but otherwise the systems are remarkably similar. Both show Ly emission that extends beyond the nebular emission region and both show a blue absorption cut-off to the Ly emission line and a similar red-wing. Crucially, both data sets show no detectable variation in the shape of the Ly emission profile across the emission region. It is remarkable that this galaxy, seen 1 Gyr after the Big-Bang is so similar to the local system at .
The basis of the interpretation is that the star-burst generates a large over pressurised region which surrounds the nebula. Within the ISM, the flow is Reighly-Taylor unstable so that the initial shell breaks up leaving behind a denser gas clumps that may be responsible for the extended Ly emission region. The outflow tends to break out of the galaxy along the axis of least resistance. In the case of a disk (or flattened) galaxy this generates an approximately bi-conical outflow. When the outflow reaches the smoother, lower density gas distribution in the halo of the galaxy, a new shell develops as the outflow sweeps up material from the galaxy’s halo, creating a screen between the observer and the source. As the shell travels away from the galaxy, it becomes dense enough to recombine and its Ly opacity becomes large. Mas-Hesse et al. (2003) interpret Haro 2 as being an example of a system in these later stages, and the arc fits into the paradigm well.
The model interprets the spatially integrated properties of the emission and absorption lines seen in Figure 6 as follows: the main peak of Ly emission comes from photons emitted from the star forming regions. To reach the observer these must pass through part of the foreground (blue shifted) shell. This absorption causes the peak emission wavelength to appear redshifted relative to the nebular emission lines. In addition, photons may be scattered or emitted from the receding shell. Photons that are either created on the inner surface of the shell (e.g. by UV irradiation from the starburst), or multiply scattered within the receding shell so that they acquire the mean velocity of the shell (see the discussion of Hansen & Oh 2006) will be seen as redshifted by the observer.
However, while the integrated spectrum is certainly consistent with the presence of an outflowing bubble, it gives no indication of its physical size, or whether the bubble geometry is appropriate. For example, the integrated spectra could be equally well explained by a large scale outflow, or a small bubble only just surrounding the starburst region. To investigate the energy of the outflow, and its ability to escape the host galaxy’s gravitational potential, we must use spatial information in our spectra.
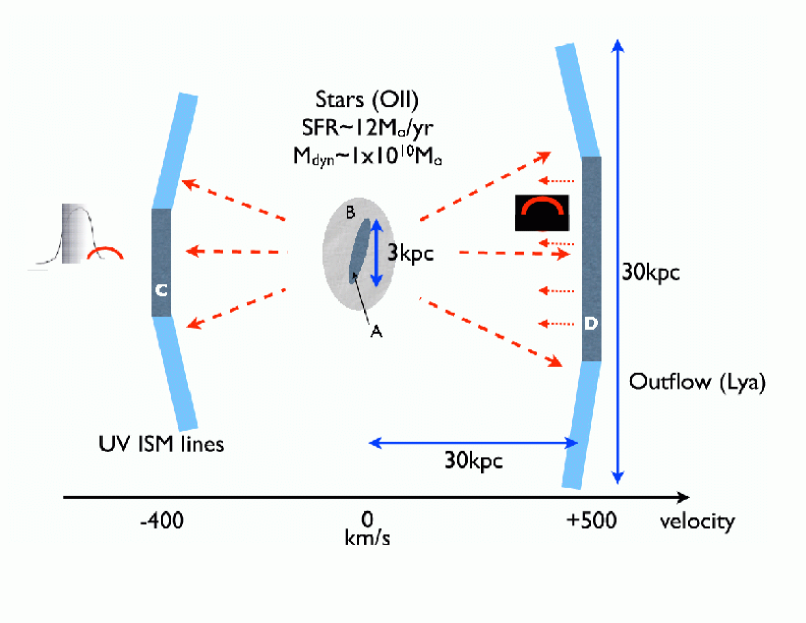
We begin by considering the dominant contribution to the Ly line from photons travelling directly towards the observer. The wavelength of the blue cut-off in the line is determined by the outflow velocity seen by the observer. If the bubble is spherical and close to the galaxy we would expect to see significant variation in the blue cut-off across the emission region since the line of sight velocity of the outflow depends on , where is the impact parameter and is the shell radius. Clearly the consistency of the blue cut-off in Ly across the galaxy implies that the shell is much larger than the galaxy so that the illuminated portion of the absorbing screen has a planar geometry. We illustrate the likely viewing geometry in Fig. 7 (cf., Fig. 18 of Mas-Hesse et al. 2003) for an outflow in the shell recombination phase (phase 4 in their classification scheme). In Haro 2, Legrand et al. (1997) are able to estimate the size of the shell from its low surface brightness H emission. They estimate that the projected diameter of the shell is 2.5 kpc, around five times the diameter of the emission region. A similar ratio would seem appropriate for the arc, although the shell could obviously be larger.
Our data also require an additional contribution from photons scattered or created in the receding shell. For a large spherical shell, we would expect to see a widespread low surface brightness emission at this wavelength (e.g. Fig. 7). However, no such distributed emission is seen in our data, or in Mass-Hesse et al.’s observations of local systems. Instead, by collapsing the datacube over a region dominated by the excess flux in the red wing, we find that the redshifted wing seems to have a similar angular distribution to that of the Ly emission coming directly from the galaxy. However, we can extend the model of Mass-Hesse et al. to explain the limited spatial extent of this emission as a result of the bi-conical outflow geometry. Redshifted photons from most of the receding shell must pass through the area of the galaxy that has not yet been ionised by the starburst. Even though they are redshifted by relative to the galaxy, they will still be absorbed since the absorbing column is likely to be extremely high. Only in the ionised region surrounding the starburst will the Ly opacity be sufficiently low to allow photons to pass though the otherwise neutral disk (photons that pass through the ionised region are unlikely to be absorbed by the foreground shell since they are redshifted by ). The column density of the residual gas disk is also likely to be much larger than that of the expanding shell. The result of this geometry is that the redshift wing will have similar spatial extent to the main Ly line.
The proposed geometry explains the spatial distribution of the spectra without needing to invoke a special viewing angle. The only constraint is that the system is viewed down through the outflow cone. As the inclination between the outflow axis and the viewer becomes significant, we might expected to detect some rotation from the galaxy (a small shear is suggested by our SINFONI spectra of the [Oii] emission), however, a shift of a several in the intrinsic profile of the Ly line is unlikely to be observable since the line shape is so strongly shaped by the blue-shifted absorption (which does not share the velocity shear of the galaxy). If the system is viewed at a larger angle, Ly is likely to be completely absorbed since the expansion velocity perpendicular to the cone is small. In this case, it is unlikely that a redshift would have been obtained for this arc. It is also worth noting that the outflow spends much of its time in this post-blow-out phase. In earlier phases, the foreground shell will have lower column density or may even show emission at its leading edge; in later phases, as the shell slows down and stalls, Ly does not escape at all. This model does not require us to be observing the galaxy at a particularly special phase of its evolution or at a special viewing angle.
Whilst the proposed bi-polar outflow fits the observables, there are other possible scenarios which would explain the velocity offsets we measure: if the outflow were instead within the galaxy, and the Ly emission was non-Gaussian (e.g. a Lorentzian) then the red wing of emission seen at 4.8860 could be explained without a receding shell. In this model, the blue-shifted material could arise due to an ISM outflow which is in the process of breaking out of the galaxy. However, the constancy of the Ly emission line shape and centroid is difficult to explain – any velocity motion within the star-forming regions should be reflected by the Ly, which is not seen in our data.
4.1.1 Energetics of the outflow
Although there are uncertainties in the geometry and column density of the outflowing shell, it is nevertheless interesting to consider the energetics of the outflow, in order to see if the bi-polar outflow scenario is reasonable. For a normal stellar initial mass function, supernovae provide 1049 erg per solar mass of stars (eg., Benson et al. 2003), thus for a galaxy with a star-formation rate of 122, 1050 erg are available per year and the maximum extent of the Ly emission is kpc diameter. We estimate the distance of the shell from the galaxy by assuming that the linear size of the region covered by the swept up shell is at least times the size of the maximum extent of Ly emission region. For Haro 2, the shell is at least three times the spatial extent of the star-forming regions. If we adopt then we would expect to detect variations in the velocity of foreground absorber. This suggests a linear size for the end of the cone of kpc. Adopting an opening angle for the outflow of , we estimate that the shell must be located kpc from the starburst region.
At a velocity of it takes 60 Myr to travel out to a distance of 30 kpc; within this time, supernovae will provide a total energy of 61057 erg. Clearly there are a number of uncertainties in this estimate: not least that the shell may have decelerated from an initial higher velocity which would reduce the timescale. Nevertheless, we can estimate the mass of the outflow via: where is the column density, is the area of the cone and is the atomic mass of Hydrogen. Adopting the value of the observed column density we derived in §3.2 of cm-2 and that the cone is uniform over an area of 700 kpc2, the total mass of the outflow is , where is its Hi fraction. The kinetic energy of the outflow is then erg. Thus, the outflow is energetically feasible if the neutral fraction is greater than 10%, or the column density of the shell is lower than we have assumed. (Note, however, that these two factors well tend to play off against each other: a lower column density will tend to have a lower neutral fraction).
It is interesting to note that the implied mass outflow rate is therefore . If we assume =0.1, then the mass outflow rate is very efficient at ejecting baryons from the galaxy, with the mass loading of the wind being more than twice the star-formation rate of the galaxy.
The estimates above are clearly uncertain. Nevertheless, it is interesting to see how far the expanding material might be expected to travel after the end of the starburst. We assume a halo circular velocity of 150 and a wind speed of 500 located 30 kpc from the center of the halo. If the wind flows freely out of the galaxy it is completely unbound. However, the wind will slow down dramatically if it sweeps up material. To make an estimate of how far the wind will travel we assume that the wind expands into an NFW halo with a baryon fraction of 18% and that the wind has an opening angle of 60∘. Even though the wind rapidly gains mass as it expands, it reaches a minimum of 160 kpc (almost 1 co-moving Mpc) before stalling. Thus, this starburst driven wind has enough energy to pollute a volume of approximately 3Mpc3.
5 Conclusions
The issues of metal ejection and feedback are some of the most outstanding problems in galaxy formation. One of the most important recent observational breakthroughs is that most high-redshift proto-galaxies appear to be surrounded by “superwinds” which are expelling material from the galaxy disc. However, at high redshift (where star formation efficiency was at its peak and therefore this phenomenon is likely at its peak activity), observational evidence is usually based on measuring the velocity offsets between the nebular emission (such as [Oii] or H) and rest-frame UV lines such as Ly or UV ISM lines. These observations are usually based on longslit observations which lack spatial information, which is crucial if we are to understand the dynamics and fate of the outflowing gas.
In this paper, we have spatially resolved and mapped the dynamical properties of a highly magnified gravitationally lensed galaxy at =4.88. The main features are described below:
The lensing amplification is a factor 162 (m=3.00.2 magnitudes). In the (reconstructed) source-frame the HST imaging suggests the galaxy is only kpc FWHM. Moreover, the lensing corrected -band magnitude is =25.2. For comparison, an Lyman-break galaxy at has =25.4, suggesting this galaxy is typical of galaxies at these early times. Due to the lensing amplification we are able to study a typical 5 galaxy at high signal-to-noise and spatially resolve the galaxy on 200pc scales.
The [Oii]3726.2,3728.9 emission line maps the (systemic) nebular emission and shows a peak-to-peak velocity gradient of 60 across 3 kpc in projection. The integrated [Oii] emission line flux suggests an integrated star-formation rate of 122. The velocity shear, spatial extent and velocity dispersion of this nebular emission suggest a dynamical mass of within a radius of 2 kpc.
The Ly emission is much more extended than either the UV continuum or [Oii] emission, extending over 11.92.4 kpc (FWHM). The Ly emission has a asymmetric profile causing it to appear redshifted from the systemic velocity by 20040. Across the whole galaxy image both the shape and centroid of the Ly emission are remarkably constant with the centroid of Ly varying by 10.
Both the collapsed and spatially resolved Ly emission are best fit with a 3 component model: (i) an underlying (Gaussian) emission profile which has a redshift and width in excellent agreement with the nebular emission; (ii) an absorber with a Voigt profile at 500 and a column density of 1.61019cm2, and (iii) a broad redshifted emission line component at +400.
In the collapsed rest-frame UV spectrum, the weak UV ISM lines of Siiv are blue-shifted from the systemic velocity by 400100 (the velocity of these lines are in agreement with the velocity of the absorber seen against Ly).
The velocity offsets between the nebular emission and spatially extended Ly are comparable to those seen in most high redshift LBGs at similar redshifts (Shapley et al., 2003; Erb et al., 2003) and are usually attributed to galactic-scale outflows. Hence, this leads us to interpret the results in the context of an evolving starburst outflow and we illustrate the likely viewing geometry in Fig. 7. In this model, the [Oii] emission is assumed to trace the underlying (star-forming) region embedded in an bi-conical outflowing bubble in which the starburst generates an over-pressurised region within the ISM which becomes Rayleigh-Taylor unstable in which the initial shell breaks up, leaving behind denser clumps which may be responsible for the extended Ly region. Any outflow will break out of the galaxy along the axis of least resistance and hence for gas in a planar or bar-like galaxy this generates an approximately bi-conical outflow.
The proposed geometry naturally explains the spatial distribution of the spectra and the velocity offsets and structures we observe. We consider the energetics of the outflow and show that the proposed model is self-consistent and energetically feasible. The energy of the wind is such that it plausibly reaches 160 kpc (almost 1 co-moving Mpc) before stalling. At this point, it will have polluted a comoving volume of nearly Mpc3 with metal enriched material.
Whilst these observations are based on a single galaxy, our results clearly show the power of combining gravitational lensing with optical and near-infrared observations to probe the star-formation activity, masses and feedback processes in typical high redshift galaxies in great detail. The next step is to generate a statistically useful sample to gauge the prevalence outflows from these young galaxies. In turn these measurements will help us understand the wide-spread enrichment of the early universe, and may explain why only 10% of baryons cool to form stars.
acknowledgments
We would like to thank the anonymous referee for their suggestion which significantly improved the content and clarity of the paper. We also thank Alice Shapley and collaborators for allowing us to use their rest-frame UV composite spectrum of LBGs, Markus Kissler-Patig for advice and support for the ESO/IFU observations and Tom Theuns, Howard Yee, Tracy Webb and Erica Ellingson for useful discussions. The VIMOS and SINFONI data are based on observations made with the ESO Telescopes at the Paranal Observatories under programmes 074.A-0035 and 075.B-0636. AMS acknowledges support from a PPARC fellowship, RGB acknowledges a PPARC Senior Fellowship, GPS and IRS acknowledges support from Royal Society University Research Fellowships and JPK thanks support from CNRS.
References
- Balogh et al. (2001) Balogh, M. L., Pearce, F. R., Bower, R. G., & Kay, S. T. 2001, MNRAS, 326, 1228
- Baugh et al. (2005) Baugh, C. M., Lacey, C. G., Frenk, C. S., Granato, G. L., Silva, L., Bressan, A., Benson, A. J., & Cole, S. 2005, MNRAS, 356, 1191
- Benson et al. (2003) Benson, A. J., Bower, R. G., Frenk, C. S., Lacey, C. G., Baugh, C. M., & Cole, S. 2003, ApJ, 599, 38
- Bower et al. (2004) Bower, R. G., Morris, S. L., Bacon, R., Wilman, R. J., Sullivan, M., Chapman, S., Davies, R. L., de Zeeuw, P. T., & Emsellem, E. 2004, MNRAS, 351, 63
- Campusano et al. (2001) Campusano, L. E., Pelló, R., Kneib, J.-P., Le Borgne, J.-F., Fort, B., Ellis, R., Mellier, Y., & Smail, I. 2001, A&AP, 378, 394
- Eisenhauer et al. (2003) Eisenhauer, F., Abuter, R., Bickert, K., Biancat-Marchet, F., Bonnet, H., Brynnel, J., Conzelmann, R. D., & Delabre, B., et al. 2003, in Instrument Design and Performance for Optical/Infrared Ground-based Telescopes. Edited by Iye, Masanori; Moorwood, Alan F. M. Proceedings of the SPIE, Volume 4841, pp. 1548-1561 (2003)., ed. M. Iye & A. F. M. Moorwood, 1548–1561
- Ellis et al. (2001) Ellis, R., Santos, M. R., Kneib, J., & Kuijken, K. 2001, ApJL, 560, L119
- Erb et al. (2003) Erb, D. K., Shapley, A. E., Steidel, C. C., Pettini, M., Adelberger, K. L., Hunt, M. P., Moorwood, A. F. M., & Cuby, J. 2003, ApJ, 591, 101
- Erb et al. (2006) Erb, D. K., Steidel, C. C., Shapley, A. E., Pettini, M., Reddy, N. A., & Adelberger, K. L. 2006, ApJ, 646, 107
- Fan et al. (2006) Fan, X., Strauss, M. A., Becker, R. H., White, R. L., Gunn, J. E., Knapp, G. R., Richards, G. T., & Schneider, D. P. et al. 2006, AJ, 132, 117
- Förster Schreiber et al. (2006) Förster Schreiber, N. M., Genzel, R., Lehnert, M. D., Bouché, N., Verma, A., Erb, D. K., & Shapley, A.E. et al. 2006, ApJ, 645, 1062
- Franx et al. (1997) Franx, M., Illingworth, G. D., Kelson, D. D., van Dokkum, P. G., & Tran, K. 1997, ApJL, 486, L75
- Genzel et al. (2006) Genzel, R., Tacconi, L. J., Eisenhauer, F., Förster Schreiber, N. M., Cimatti, A., Daddi, E., Bouché, N., & Davies, R., et al. 2006, Nature, 442, 786
- Gladders et al. (2002) Gladders, M. D., Yee, H. K. C., & Ellingson, E. 2002, AJ, 123, 1
- Grimes et al. (2006) Grimes, J. P., Heckman, T., Hoopes, C., Strickland, D., Aloisi, A., Meurer, G., & Ptak, A. 2006, ApJ, 648, 310
- Hansen & Oh (2006) Hansen, M. & Oh, S. P. 2006, MNRAS, 367, 979
- Heckman et al. (2000) Heckman, T. M., Lehnert, M. D., Strickland, D. K., & Armus, L. 2000, APJS, 129, 493
- Henault et al. (2004) Henault, F., Bacon, R., Dekker, H., Delabre, B., Djidel, S., Dubois, J.-P., Hubin, N., & Lantz, B., et al. 2004, in Ground-based Instrumentation for Astronomy. Edited by Alan F. M. Moorwood and Iye Masanori. Proceedings of the SPIE, Volume 5492, pp. 909-920 (2004)., ed. A. F. M. Moorwood & M. Iye, 909–920
- Kassiola & Kovner (1993) Kassiola, A. & Kovner, I. 1993, ApJ, 417, 450
- Kennicutt (1998) Kennicutt, R. C. 1998, ARA&A, 36, 189
- Kneib et al. (2004) Kneib, J., Ellis, R. S., Santos, M. R., & Richard, J. 2004, ApJ, 607, 697
- Kneib (1993) Kneib, J.-P. 1993, Ph.D. Thesis, Université Paul Sabatier, Toulouse, France
- Kneib et al. (1996) Kneib, J.-P., Ellis, R. S., Smail, I., Couch, W. J., & Sharples, R. M. 1996, ApJ, 471, 643
- LeFevre et al. (2003) LeFevre, O., Saisse, M., Mancini, D., Brau-Nogue, S., Caputi, O., Castinel, L., D’Odorico, S., & Garilli, B. 2003, in Instrument Design and Performance for Optical/Infrared Ground-based Telescopes. Edited by Iye, Masanori; Moorwood, Alan F. M. Proceedings of the SPIE, Volume 4841, pp. 1670-1681 (2003)., ed. M. Iye & A. F. M. Moorwood, 1670–1681
- Legrand et al. (1997) Legrand, F., Kunth, D., Mas-Hesse, J. M., & Lequeux, J. 1997, A&AP, 326, 929
- Martin (2005) Martin, C. L. 2005, ApJ, 621, 227
- Mas-Hesse et al. (2003) Mas-Hesse, J. M., Kunth, D., Tenorio-Tagle, G., Leitherer, C., Terlevich, R. J., & Terlevich, E. 2003, ApJ, 598, 858
- Ouchi et al. (2004) Ouchi, M., Shimasaku, K., Okamura, S., Furusawa, H., Kashikawa, N., Ota, K., Doi, M., & Hamabe, M. 2004, ApJ, 611, 685
- Pettini et al. (2002) Pettini, M., Rix, S. A., Steidel, C. C., Hunt, M. P., Shapley, A. E., & Adelberger, K. L. 2002, APSS, 281, 461
- Pettini et al. (2000) Pettini, M., Steidel, C. C., Adelberger, K. L., Dickinson, M., & Giavalisco, M. 2000, ApJ, 528, 96
- Sand et al. (2005) Sand, D. J., Treu, T., Ellis, R. S., & Smith, G. P. 2005, ApJ, 627, 32
- Shapley et al. (2003) Shapley, A. E., Steidel, C. C., Pettini, M., & Adelberger, K. L. 2003, ApJ, 588, 65
- Sharples et al. (2004) Sharples, R. M., Bender, R., Lehnert, M. D., Ramsay Howat, S. K., Bremer, M. N., Davies, R. L., Genzel, R., & Hofmann, R. 2004, in Ground-based Instrumentation for Astronomy. Edited by Alan F. M. Moorwood and Iye Masanori. Proceedings of the SPIE, Volume 5492, pp. 1179-1186 (2004)., ed. A. F. M. Moorwood & M. Iye, 1179–1186
- Smail et al. (1996) Smail, I., Dressler, A., Kneib, J., Ellis, R. S., Couch, W. J., Sharples, R. M., & Oemler, A. J. 1996, ApJ, 469, 508
- Smith et al. (2005) Smith, G. P., Kneib, J.-P., Smail, I., Mazzotta, P., Ebeling, H., & Czoske, O. 2005, MNRAS, 359, 417
- Smith et al. (2002) Smith, G. P., Smail, I., Kneib, J.-P., Davis, C. J., Takamiya, M., Ebeling, H., & Czoske, O. 2002, MNRAS, 333, L16
- Steidel et al. (2004) Steidel, C. C., Shapley, A. E., Pettini, M., Adelberger, K. L., Erb, D. K., Reddy, N. A., & Hunt, M. P. 2004, ApJ, 604, 534
- Swinbank et al. (2006) Swinbank, A. M., Bower, R. G., Smith, G. P., Smail, I., Kneib, J.-P., Ellis, R. S., Stark, D. P., & Bunker, A. J. 2006, MNRAS, 368, 1631
- Swinbank et al. (2005) Swinbank, A. M., Smail, I., Bower, R. G., Borys, C., Chapman, S. C., Blain, A. W., Ivison, R. J., & Howat, S. R. et al. 2005, MNRAS, 359, 401
- Swinbank et al. (2003) Swinbank, A. M., Smith, J., Bower, R. G., Bunker, A., Smail, I., Ellis, R. S., Smith, G. P., & Kneib, J. P., et al. 2003, ApJ, 598, 162
- Tenorio-Tagle et al. (1999) Tenorio-Tagle, G., Silich, S. A., Kunth, D., Terlevich, E., & Terlevich, R. 1999, MNRAS, 309, 332
- Teplitz et al. (2000) Teplitz, H. I., McLean, I. S., Becklin, E. E., Figer, D. F., Gilbert, A. M., Graham, J. R., Larkin, J. E., Levenson, N. A., & Wilcox, M. K. 2000, ApJL, 533, L65
- White & Rees (1978) White, S. D. M. & Rees, M. J. 1978, MNRAS, 183, 341
- Wilman et al. (2005) Wilman, R. J., Gerssen, J., Bower, R. G., Morris, S. L., Bacon, R., de Zeeuw, P. T., & Davies, R. L. 2005, Nature, 436, 227
Appendix A Serendipitous Background Galaxies
Since we are able to simultaneously survey all of the critical lines from =0 to =7 with the VIMOS IFU and part of the =1.5 to =14 critical lines with the SINFONI IFU we exploit the SINFONI and VIMOS data to search for serendipitous sources behind the lensing cluster. We identify seven candidates between 1.5 and 5.5 from both optical and near-infrared spectroscopy, at least three of which have either optical or near-infrared broad-band counterparts. One of these sources is a radial counter-image of the =4.88 arc which is then used to provide strong constraints on the lens modelling (§ 3.1). The remaining sources in the VIMOS datacube are identified as [Oii] emission at =0.99 and Ly at =3.66. The SINFONI IFU emitters are tentatively identified as either H at =1.5 to =2.7 or [Oii] at 5.3 (Table LABEL:table:serendip_sources). These observations show the power which integral field spectroscopy will have in the future in finding high-redshift galaxies behind cluster cores (e.g. Ellis et al. 2001; Kneib et al. 2004). The observations presented here also allow an insight of the deeper observations that will be made possible with even larger area integral field spectrograph’s on the VLT in the near future (e.g. MUSE; Henault et al. 2004) or the mosaic mode of KMOS (Sharples et al., 2004)). These observations will open the doorway to probing (and spatially resolving) the properties of the primeval galaxies responsible for reionization around =8-12.
A.1 Identifying Serendipitous Galaxies in the datacube
Using the IFU coverage of the cluster cores, we attempt to identify serendipitous sources in the IFU datacubes. For the wavelength range of VIMOS (5000Å-1m), we are able to search for Ly between =3.11 and =6.8 and [Oii] between =0.34 and =1.57. The wavelength coverage of the SINFONI IFU observations (=1.451–2.463m) also allow us to search for [Oii] emission between redshifts 2.90 to 5.61, H between 1.21 and 2.75 and even Ly between 10.9 and 19.3).
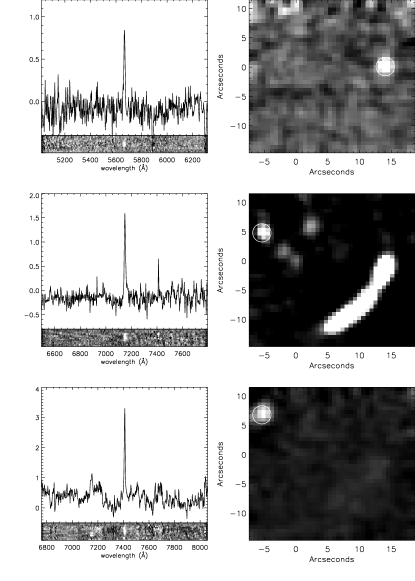
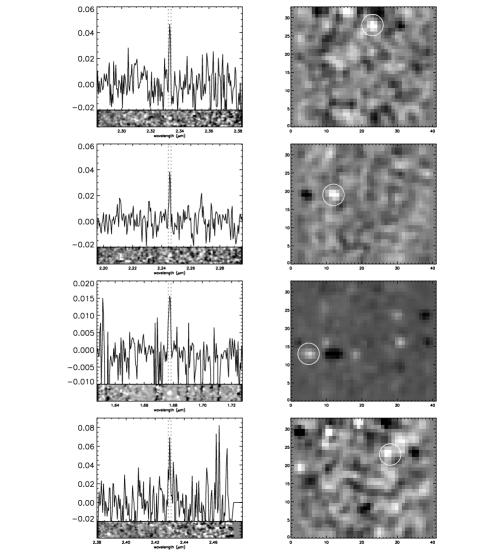
To identify serendipitous line emission we scan each pixel of the datacube. At each wavelength in each spectrum we calculate the noise over 150Å and demand a signal-to-noise of four to detect an emission line in at least three of the eight adjacent pixels (we mask out any regions of strong sky emission from our analysis completely). If line emission is detected, we then fit the emission line with a single Gaussian profile and require that the emission line must have a line width greater than that of the sky at the given wavelength. Using this technique, we identify three candidates in the VIMOS IFU datacube (excluding [O ii], [Oiii] or H emission from the cluster members) and four candidates in the near-infrared (SINFONI) datacube. We show the one and two-dimensional spectra (as well as their location in the datacube) in Fig. 8& 9 and briefly review their properties and likely redshifts here.
Optical
VIMOS Source 1 (R1): The first serendipitous source is the radial
counter-image of the =4.879 arc (labelled R1 in
Fig. 1). The position of this counter-image is
used as an extra constraint in the lens modelling in
§ 3.1.
VIMOS Source 2 (A1): In the HST imaging of the cluster, the third counter-image of the =4.789 arc (at approximately +6′′,+14′′) shows a bright knot superimposed onto the arc which does not appear in any of the other counter-images of the arc and therefore (as noted by Gladders et al. 2002) is most likely a foreground galaxy super-imposed onto the arc. This galaxy has a -band magnitude of =25.60.2 and we identify an emission line at 5665Å with an emission line flux of 1.40.510-16erg s-1 cm-2 and an observed equivalent width of 700150Å. If the line is identified as [Oii], then a redshift of 0.51 yields an EW of 470Å, which is high compared to local star-forming galaxies. We therefore suggest that the emission is Ly at a redshift of =3.66 with a rest-frame EW of 15050Å. The emission line width (FWHM=12.5Å) suggests a line width of 22060.
VIMOS Source 3 (A2): The third background galaxy detected is the blue disk-like galaxy labelled A2 in Fig. 1. We detect strong emission at 7409Å but no other significant (5) emission lines in the one-dimensional spectrum. The emission line also has a velocity shear of 5Å across the 1.5′′. If the emission is identified as [Oii]3727 a redshift of 0.9855 is derived, placing the galaxy behind the cluster, and probably lensed. However, it is also possible that the emission is H at 0.129, although we place limits on the emission line ratios of H/H12 and H/[Oiii]50076. Identification as [Oiii]5007 is ruled out due to the non-detection of [Oiii]4959. Alternatively, if the emission is H at 0.524, we constrain the emission line flux ratios as H/[Oiii]50078 and H/[Oii]17. We therefore suggest the most likely identification is [Oii]3727 at 0.9855.
Table A1.
Properties of the Serendipitous Sources
| ID | RA | Dec | Line Flux | Likely redshift | EWobserved | |
| (m) | (x10-16erg s-1) | (Å) | ||||
| VIMOS | ||||||
| A1 | 02:24:33.862 | -00:02:17.61 | 0.5665 | 1.40.5 | 3.660 (Ly) | 47060 |
| A2 | 02:24:34.602 | -00:02:34.80 | 0.7400 | 6.01.0 | 0.986 ([Oii]) | 10220 |
| R1 | 02:24:34.466 | -00:02:34.77 | 0.7148 | 4.50.8 | 4.879 (Ly) | 72030 |
| SINFONI | ||||||
| 1 | 02:24:33.455 | -00:02:21.73 | 2.3330 | 0.10.05 | 2.554 (H) / 5.259 ([Oii]) | 78 |
| 2 | 02:24:33.591 | -00:02:24.22 | 2.2455 | 0.060.03 | 2.421 (H) / 5.024 ([Oii]) | 47 |
| 3 | 02:24:33.708 | -00:02:25.71 | 1.6740 | 0.040.02 | 1.550 (H) / 3.159 ([Oii]) | 31 |
| 4 | 02:24:33.315 | -00:02:23.28 | 2.4302 | 0.030.02 | 2.702 (H) / 5.520 ([Oii]) | 23 |
Near-Infrared
SINFONI Source 1: The proximity of this source to the z=4.88
critical line makes it more likely to be [Oii] for z=5.25. We
can not rule out H at =2.55, although the lack of [Oiii] or H at 1.8m (although near to the atmospheric
-band absorption) or [Nii]6583 emission makes it more
likely [Oii].
SINFONI Source 2: This source lies close to the high amplification lines for =2-3 and therefore we suggest H is the most likely line identification. There is no strong [Oiii] in the -band.
SINFONI Source 3: The proximity to the z1.5 critical lines makes it more likely to be H than high redshift [Oii]
SINFONI Source 4: This is the weakest emission line in the sample, although it still fulfils the selection criterion. The most likely line identification is [Oii] at =5.51 due to its proximity to the 5 critical curve. This emission line could also be identified at H for z=2.70, however, we note that there are no signs of strong [Oiii] with a flux ratio limit of [Oiii]/H emission line ratio
Appendix B Spectroscopic Properties of the Cluster Galaxies
Table LABEL:table:cluster_members gives the spectroscopic properties (RA, Dec, [Oii] emission line flux, line width (FWHM) and Equivalent Width (EW)) of the cluster galaxies.
Table B1.
Spectroscopic Properties of the Cluster Galaxies
| ID | RA | Dec | Features | [Oii] Flux | [Oii] FWHM | EW | |
|---|---|---|---|---|---|---|---|
| (10-17erg/cm2/s)) | (Å) | (Å) | |||||
| CG1 | 02:24:34.097 | -00:02:30.90 | 0.7784 | H&K | - | - | |
| CG2 | 02:24:34.246 | -00:02:32.54 | 0.7725 | H&K | - | - | |
| CG3 | 02:24:34.184 | -00:02:31.29 | 0.7603 | [Oii] | 8.51.0 | 5.7 | 7.0 |
| CG4 | 02:24:34.717 | -00:02:35.22 | 0.7845 | [Oii] | 12.01.0 | 7.0 | 8.2 |
| CG5 | 02:24:34.751 | -00:02:28.75 | 0.7864 | H&K, [Oii] | 10.02.0 | 4.1 | 22.0 |
| CG6 | 02:24:34.472 | -00:02:27.71 | 0.7848 | H&K, [Oii] | 20.01.0 | 11.1 | 17.0 |