On the Mechanism of Gamma-Ray Burst Afterglows
Abstract
The standard model of afterglow production by the forward shock wave is not supported by recent observations. We propose a model in which the forward shock is invisible and afterglow is emitted by a long-lived reverse shock in the burst ejecta. It explains observed optical and X-ray light curves, including the plateau at s with a peculiar chromatic break, and the second break that was previously associated with a beaming angle of the explosion. The plateau forms following a temporary drop of the reverse-shock pressure much below the forward-shock pressure. A simplest formalism that can describe such blast waves is the “mechanical” model (Beloborodov & Uhm 2006); we use it in our calculations.
1 INTRODUCTION
Since its discovery, gamma-ray burst (GRB) afterglow has been attributed to the forward shock wave (Mészáros & Rees 1997). This hypothesis was consistent with first follow-up observations at days after prompt GRBs. However, recent observations of early afterglows ( day) are difficult to reconcile with the model (e.g. Zhang 2007). One outstanding problem is the low-level plateau in the X-ray light curve (Nousek et al. 2006); this and other problems are summarized in § 3, where we discuss their possible resolution.
Besides the forward shock (FS), a reverse shock (RS) is expected in the burst ejecta. A short-lived RS was proposed to emit a brief optical flash (Mészáros & Rees 1999; Sari & Piran 1999), and later absence of such flashes was interpreted as a lack of RS emission (Roming et al. 2006). A long-lived RS in stratified ejecta with a decreasing Lorentz factor was proposed as a mechanism of gradual energy injection into the FS (Rees & Mészáros 1998) and the RS emission was invoked to explain radio data (Panaitescu & Kumar 2004).
The interaction of power-law ejecta with a power-law medium obeys scaling laws that are derived analytically (Rees & Mészáros 1998). However, the general problem of explosions driven by ejecta with arbitrary stratification of remained unsolved. We have developed a simple “mechanical” formalism for such explosions (Beloborodov & Uhm 2006; hereafter BU06), which allows us to explore a new class of dynamical models, with rapid and strong evolution of the RS. We calculate the emissions from FS and RS and search for a scenario that would reproduce the observed X-ray and optical light curves. We find that observations can be explained if it is only the RS that contributes to the observed afterglow and the FS is invisible because of its extremely low radiative efficiency.
2 AFTERGLOW MODEL
The central explosion ejects a cold (adiabatically cooled) relativistic flow. It may be viewed as a sequence of shells of energy that coast with Lorentz factors . Each shell can be prescribed an ejection time at a small radius , and functions and completely describe the ejected flow. The ejecta density is derived from continuity equation,
| (1) |
where . The ejecta push the blast — a thin shell of compressed gas between FS and RS — as described by equations (11)-(16) in BU06. We solve these equations numerically, tracking self-consistently the location of RS in the ejecta. The blast-wave model is determined by three functions: (external density), , and . When the condition is satisfied, equation (1) simplifies,
| (2) |
Then the ejection time drops out, and only one function describes the ejecta.
Once the dynamical equations are solved, we calculate the synchrotron emission from the shocked medium (FS emission) and shocked ejecta (RS emission). This calculation uses the standard model with three parameters (e.g. Piran 2004): fraction of the shock energy that goes to electron acceleration, slope of the electron spectrum, and magnetic parameter , where is the energy density of the shocked gas. The blast is treated as one body in the sense that it moves as one body, with a common . However, we take into account that it is made of different hot shells that pile up from the FS and RS. The synchrotron emissivity of each shell is tracked as the blast expands. The sum of observed emissions from all shells is found taking into account the velocity and curvature of the shells.
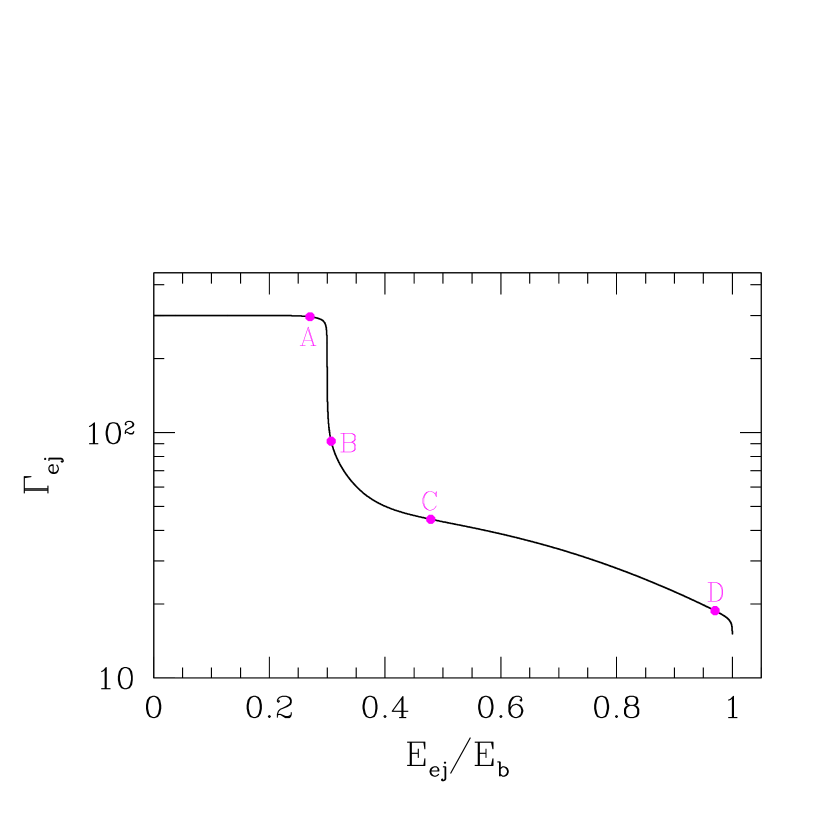
The main points of this work are demonstrated by the numerical model presented in Figures 1-2. It assumes a uniform external medium with cm-3 and a total isotropic energy of the explosion ergs. The stratification function (Fig. 1) assumes a “head” of the ejecta with , which carries an energy . The remaining 2/3 of energy is carried by a slower “tail.” The RS crosses the head at early times s and proceeds to the tail. Equation (2) becomes valid in the tail.
The emission produced by the FS with usual parameters , , and is shown by the thin curves in Figure 2e. Both X-ray and optical light curves are inconsistent with observations and illustrate the problems of the FS model. The theoretical optical light curve peaks at s, when the peak frequency of synchrotron emission passes through the optical band (e.g. Sari et al. 1998). This peak is not observed. The theoretical X-ray light curve has a long monotonic decay with slope .111It deviates from the power-law because of energy injection into the FS from the tail. The growth of blast-wave energy (by a factor of 3) implies a deviation from the standard deceleration law . By contrast, observed X-ray afterglows are much weaker at s; they show an initial steep decay to a low emission level and then a plateau.
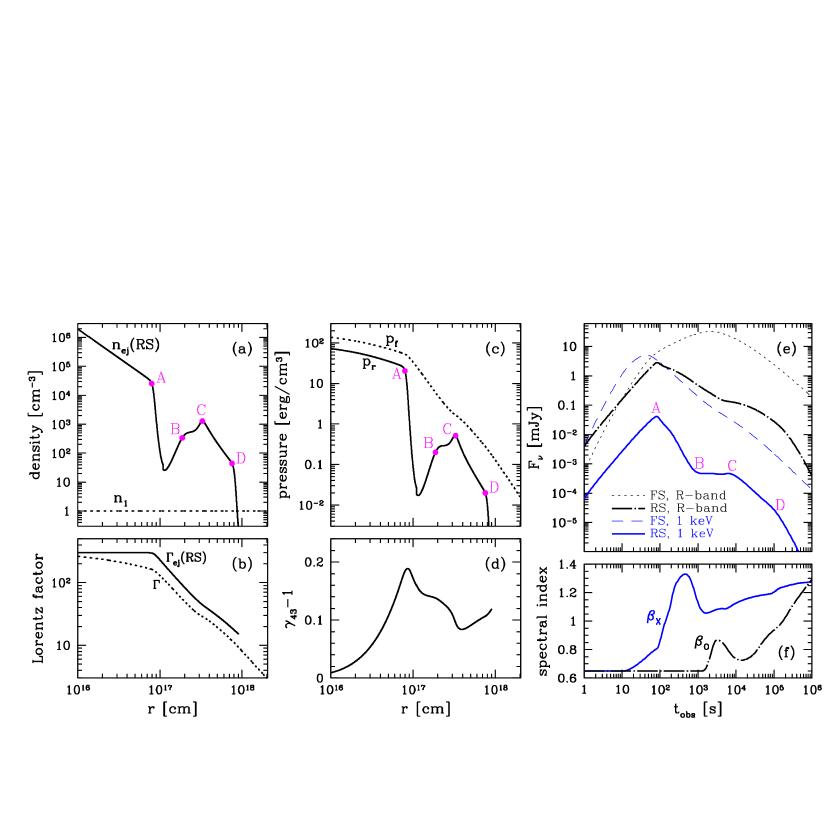
The RS emission for the same explosion is shown by thick curves in Figure 2e. The same parameters , , and are assumed for the RS. Then the cooling frequency is between optical and X-ray bands throughout most of the afterglow.
The X-ray emission is produced by fast-cooling electrons near the RS. Its initial peak (marked A in Fig. 2e) is followed by the steep decay AB and the plateau BC. This behavior can be understood from Figures 2a-2d, which show the explosion dynamics. The ejecta density drops dramatically behind the head of the ejecta because of the large gradient of (see Fig. 1 and eq. 2). Therefore, X-ray emission is strongly reduced when the RS enters the tail. Its decay at s has a temporal index and is limited only by the spherical curvature of the RS. The X-ray emission does not recover until the RS propagates to the region of flatter stratification function (smaller and higher ). This recovery begins at s and corresponds to the beginning of the X-ray plateau (point B). During the plateau stage, at the RS grows and reaches a maximum at point C where is near its minimum. This point is the end of the X-ray plateau.
Following point C, the X-ray light curve has a slope until the last break at point D. This break corresponds to the RS reaching the end of the ejecta, and its observed time is . In our example model, (Fig. 1), which gives the break D at s. (We also ran models with smaller ; then the power-law with extends to longer times weeks.) The steep slope of the light curve after break D is limited by the spherical curvature of the RS.
The RS optical light curve also differs significantly from the prediction of the FS model. It has an initial power-law decay at s followed by the hump or “shoulder.” The optical light curve can be understood by noting that it is produced by slow-cooling electrons. When crossing the head of the ejecta, the RS creates a population of nonthermal electrons that continue to emit optical radiation after point A, when the RS weakens dramatically. This residual emission has a power-law light curve with a slope . It is approximately described by the formula (see Beloborodov 2005b, § 7),
| (3) |
where is the adiabatic index of the shocked ejecta. The RS is only mildly relativistic, and adiabatic cooling quickly reduces the sound speed to a non-relativistic value, so . Equation (3) then gives for .
The RS recovery near point C makes an additional contribution to optical emission and produces the shoulder in the light curve. In contrast to the X-ray afterglow, it does not break at point C. We ran a number of explosion models with different and found that the optical shoulder usually accompanies the X-ray plateau. This feature is less prominent if (then it is buried by the residual optical emission from the head). For high , the optical-emitting electrons enter the fast-cooling regime before point C and the optical light curve has a plateau with a break at C, similar to that in the X-ray band.
Figure 2f shows spectral indices and in the optical and X-ray (1 keV) bands for the RS emission. The X-ray break at the end of the plateau is not accompanied by any significant change of . This is consistent with observations (O’Brien et al. 2006).
We ran the same model but with three bumps in external density (Fig. 3). Figure 3d compares the afterglow with and without the bumps. FS emission is barely changed (this conclusion is similar to that of Nakar & Granot 2006), and RS emission is changed significantly. The bump decelerates the blast, which weakens the FS and makes the RS stronger ( temporarily increases; see Fig. 3b). The electron spectrum injected at the RS is then shifted to higher energies and its synchrotron emission increases. The RS re-brightening is especially large if the bump occurs when the blast is near point C. The mechanical model does not take into account sound waves or shock waves that may be generated in the blast when it hits a bump, so the dynamics shown in Figure 3 is approximate. Nevertheless, this calculation well illustrates the difference between FS and RS.

3 DISCUSSION
If the FS dominates afterglow production, several puzzles arise. We list these problems below and discuss how they are avoided/solved in the proposed RS model.
1. The FS model predicts much stronger emission at s than observed. The FS does not stop producing the early afterglow — it cannot weaken until is reduced and becomes large — while data suggest that the X-ray afterglow is temporarily suppressed at early times s.
The RS weakens abruptly at s, when it crosses the head of the ejecta. This weakening explains the observed “lack” of early X-ray afterglow.
2. The FS model does not easily explain the shallow decay (plateau) in the X-ray light curve at s (Nousek et al. 2006; Zhang 2007; Granot 2006). Its predicted luminosity in the fast-cooling regime is , where is the blast-wave energy. It can give a flat light curve if grows, i.e. if energy is gradually injected into the blast wave from the ejecta tail. However, this explanation invokes a huge energy injection (e.g. an increase of by a factor of 3 does not help, cf. Fig. 2). A plateau of 1-2 orders in would require a tail times more energetic than the head of ejecta. On the other hand, the head should emit the prompt -ray burst that strongly dominates the observed energy output. This would require an extremely high radiative efficiency for the prompt emission.
The RS produces the plateau BC as it recovers after the steep transition to the tail of the ejecta and enters the shallow part of the stratification function (Figs. 1 and 2a). In this scenario, and % efficiency of the prompt emission is sufficient.
3. The observed peculiar break at the end of the plateau is difficult to reconcile with the FS model. The end of energy injection in the model causes a steepening of , and the FS emission must respond to this steepening in all bands, both fast-cooling and slow-cooling. By contrast, the observed break often shows up only in X-rays (Panaitescu et al. 2006). Such chromatic breaks could appear when the X-ray spectrum steepens ( passes through the XRT band), but this is excluded: the X-ray spectrum does not change across the break.
This break is reproduced by the RS model (point C in Figs. 1-2), with no abrupt changes in . Emission in slow-cooling bands does not show a break; instead, a shoulder in the light curve is predicted (§ 2).
4. To explain the second break that was observed in many afterglows at s, the FS model assumes a small beaming angle of the ejecta, . When decreases below the “jet break” must inevitably appear in all bands (Rhoads 1999). By contrast, the observed breaks at s are often chromatic or, in some bursts, not seen at all (e.g. Zhang 2007).
The RS model predicts the second break when the shock reaches the end of ejecta or faces a steep decline in (point D in Figs. 1-2). Its observed time is days. Afterglow steepens immediately only in fast-cooling bands.222 The light-curve slope becomes if the RS weakens sharply at D — the slope is then controlled by photons emitted at moment D and arriving with a delay because of the spherical curvature of the RS. By contrast, the usual jet model predicts after the break. No dramatic change occurs in the blast deceleration at this point, and the slowly-cooling emission steepens with a delay.
5. The FS model does not easily explain re-brightenings observed in some optical afterglows. The response of FS emission to bumps in external density is weak (see Fig. 3 and Nakar & Granot 2006), while observed re-brightenings are strong, up to one order in flux.
The RS emission is sensitive to external bumps (Fig. 3). Inhomogeneities in the ejecta may also cause bumps in the light curve.
All five problems of the FS model ultimately have one common reason: changes in emission must invoke significant changes in . By contrast, the RS model does not require strong deviations of from a power-law, and the afterglow light curves are shaped by the ejecta stratification. As a result, the temporal properties of the RS emission are consistent with observations, while those of the FS are not.
As a solution, we propose that the entire afterglow is produced by the RS. The FS may be invisible for two reasons: (1) Magnetic fields are too weak in the external medium and not sufficiently amplified by the FS. If , the FS emission is negligible. (2) Electrons are not efficiently accelerated in the FS (e.g. diffusive acceleration is inefficient in ultra-relativistic shocks; see Beloborodov 2005b). By contrast, the ejecta may carry strong magnetic fields. Besides, the RS is mildly relativistic, which makes electron acceleration more plausible. This leaves the RS as the main producer of afterglow, and consistency with data is achieved.
This model has interesting implications. The mean energy per electron in the RS is much lower than it would be in the FS model (while the number of electrons is much larger, and the dissipated energy in the RS is not much below that in the FS). Emission from most electrons is self-absorbed, and only a tail of their spectrum contributes to the X-ray and optical afterglow. The net radiative output of the blast wave peaks at the cooling frequency ; however, an energetic fraction is emitted at low . The RS afterglow should be very bright in the infrared bands, and this prediction may be tested by observations.
If afterglow is indeed produced by the shocked ejecta rather than the shocked external medium, it carries important information about the explosion. We find that GRB ejecta are made of two blocks — head and tail — with different and comparable kinetic energy. Its magnetic field is well below equipartition, . The RS emission is sensitive to the stratification function , which explains the diversity of afterglows. We have shown here one example with a flat plateau, and other examples will be presented in an accompanying paper. The plateau has a larger slope (and a longer duration) if is less concave at the beginning of the tail. The “steep decay + plateau” shape disappears if decreases gradually after point A instead of jumping from to . In our models, the plateau often ends with a small flare, which is also observed (O’Brien et al. 2006).
The study of radio emission expected in the RS model will be published elsewhere. Self-absorption limits the peak of radio afterglow, and observed light curves provide additional constraints on the model. The inverse Compton emission of high-energy -rays will also be investigated elsewhere. At least two high-energy components are expected: a brief flash that is produced through upscattering of prompt -rays by the electrons accelerated at the RS (Beloborodov 2005a) and the usual synchrotron self-Compton emission that can extend to longer times.
References
- (1) Beloborodov, A. M. 2005a, ApJ, 618, L13
- (2) Beloborodov, A. M. 2005b, ApJ, 627, 346
- (3) Beloborodov, A. M., & Uhm, Z. L. 2006, ApJ, 651, L1 (BU06)
- (4) Granot, J. 2006, in SWIFT and GRBs: Unveiling the Relativistic Universe (astro-ph/0612516)
- (5) Mészáros, P., & Rees, M. J. 1997, ApJ, 476, 232
- (6) Mészáros, P., & Rees, M. J. 1999, MNRAS, 306, L39
- (7) Nakar, E., & Granot, J. 2006, preprint (astro-ph/0606011)
- (8) Nousek, J. A., et al. 2006, ApJ, 642, 389
- (9) O’Brien, P., et al. 2006, ApJ, 647, 1213
- (10) Panaitescu, A., & Kumar, P. 2004, MNRAS, 350, 213
- (11) Panaitescu, A. et al. 2006, MNRAS, 369, 2059
- Piran (2004) Piran, T. 2004, Rev. Mod. Phys., 76, 1143
- (13) Rees, M. J., & Mészáros, P. 1998, ApJ, 496, L1
- (14) Rhoads, J. E. 1999, ApJ, 525, 737
- (15) Roming, P. W. A. et al. 2006, ApJ, 652, 1416
- (16) Sari, R., & Piran, T. 1999, ApJ, 517, L109
- (17) Sari, R., Piran, T., & Narayan, R. 1998, ApJ, 497, L17
- (18) Zhang, B. 2007, Adv. Space Rev., in press (astro-ph/0611774)