Spatial restriction to HXR footpoint locations by reconnection site geometries
Abstract
It is assumed that HXR sources map to the primary energy release site in flares where particle acceleration occurs. Strong HXR sources are mostly observed at confined regions along the reconnecting magnetic arcade. We make a general approach on how the geometry of the reconnecting current sheet (CS) may influence the strength and localization of observed HXR sources. For this we use results from an analysis on the 3B/X3.8 flare on January 17, 2005 (?), as well as measurements from the associated CME. Due to the close match of the CME acceleration profile and the flare HXR flux, we suppose that the CME might play a certain role in modifying the geometry of the CS (“symmetric” versus “asymmetric” vertically stretched CS). This could be the driver for “guiding” the accelerated particles to confined areas along the flaring arcade and might explain the spatially limited occurrence of strong HXR sources in comparison to elongated ribbons as seen in H and UV.
keywords:
Sun - solar flares - HXR sources - CMEs1 Introduction
It is generally accepted that hard X-ray (HXR) sources map to the primary energy release site in solar flares, where particle acceleration is assumed to occur (e.g. ?), and thus give insight into the energy release process. The flare HXR emission is mainly concentrated at the footpoints of magnetic loops (e.g., ??), and is assumed to be produced by accelerated electrons that are collisionally stopped in the ‘dense’ chromosphere (as compared to the tenuous corona) and emit nonthermal thick-target bremsstrahlung when braking in the field of the ions (?). For some events there is also evidence for nonthermal hard X-rays from the corona (???).
When comparing HXR sources with H and UV images it is often observed that the HXR emission is concentrated in some compact sources, which cover only a small part of the flare ribbon, and are predominantly associated with bright H (UV) kernels located on the outer edge of the ribbons (e.g., ?????). There are only rare exceptions that seem to show “HXR ribbons” (for an example see ?).
A case study by ?? using Yohkoh HXR images, showed that this discrepancy might be due to the limited dynamic range of X-ray instruments. This may lead to the effect that only the strongest nonthermal sources are observed in HXRs, whereas the weaker ones are buried in the noise of the instruments. We performed a similar study on the X3.8 flare of January 17, 2005 (?, hereafter referred to as Paper I) where we compared the locations of HXR sources as observed with the RHESSI instrument to the occurrence of H ribbons (using data from the Hvar and Kanzelhöhe Observatory). From this we found that the accelerated electrons are preferentially focused into a small subset of loops (outlined by the HXR footpoints) of all the loops that take part in the magnetic reconnection process (outlined by the H ribbons and EUV postflare arcade). Comparing the local energy release and reconnection rates for H flare ribbon locations accompanied by HXR footpoints and those without, we found differences of two and one order of magnitude, respectively. These differences are large enough to explain the different flare morphologies typically observed in HXRs (compact footpoints) and H/UV (extended ribbons) by the limited dynamic range of the RHESSI HXR instrument.
The following analysis is based on the results presented in Paper I from the X3.8 flare of January 17, 2005. In this paper we aim to make a more general approach to the determination of specific HXR locations. We will make use of measurements from the associated coronal mass ejection and try to show how the geometry of the reconnecting large scale current sheet might influence the location of strong HXR sources.
2 CME measurements and geometry of the current sheet
A classical two ribbon flare is generally explained within the two-dimensional “CHSKP” model (????) in which a prominence rises, stretches the field lines underneath, and forms a current sheet (CS). Due to various instabilities a sudden increase in the resistivity takes places after exceeding a critical value of the CS length (see e.g. ?). Then the reconnection process starts in the region of enhanced resistivity (diffusion region). The coronal magnetic field lines that successively reconnect result in a growing flare/postflare loop system and separating H and UV flare ribbons, as observed in many flares (e.g., ?????????).
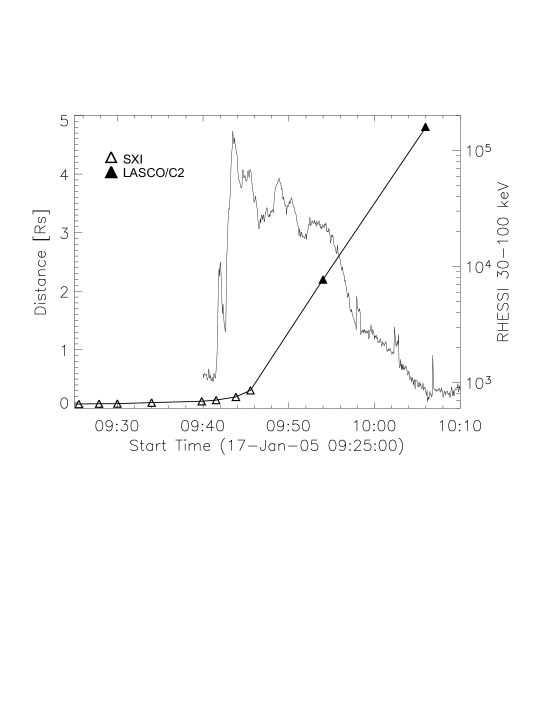

The January 17, 2005 X3.8 flare was accompanied by a halo coronal mass ejection (CME). From GOES/SXI observations we could follow the rising of the flux rope which can be seen as a proxy for the CME first phase in the low corona. As shown in the left panel of Fig. 1 we measured the CME from its initiation height at 0.07 up to 0.3 from SXI and in the range of 2–5 in two LASCO C2 images. The linear fit to the height-time measurements from 9:42–10:06 UT gives a mean speed of 1900 km/s. The right panel of Fig. 1 shows the acceleration of the CME derived from the second derivative to the height-time measurements. As it can be seen, the CME acceleration profile is very similar to the HXR flux which gives evidence of a high relation between the flare energy release and the CME acceleration111We want to note that the peak time of the acceleration profile is highly dependent on the measured CME features which are assumed to be the same in SXI and LASCO observations. To get an error estimation for this we measured the most conservative and most speculative features in the LASCO observations for which we obtain 1 min indicated in Fig. 1 by gray vertical lines. (see also ?).
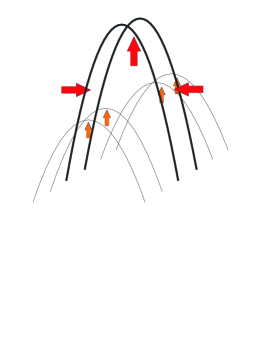
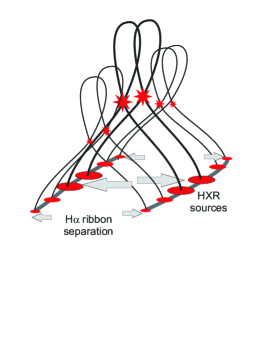
Fig. 2 shows a scenario where due to a filament/CME eruption (not drawn) a magnetic arcade rises up from the center (“symmetric eruption”; e.g. ?)222There is also evidence for “asymmetric eruptions”, e.g. ? and the field lines get stretched mostly at its center. After the reconnection process has started, electrons are accelerated and produce HXR sources of different strength at the footpoints of the loops along the arcade, namely stronger at the center than at the flanks. We suppose that this might be due to the associated current sheet (CS) that is larger at the center part than at the flanks.
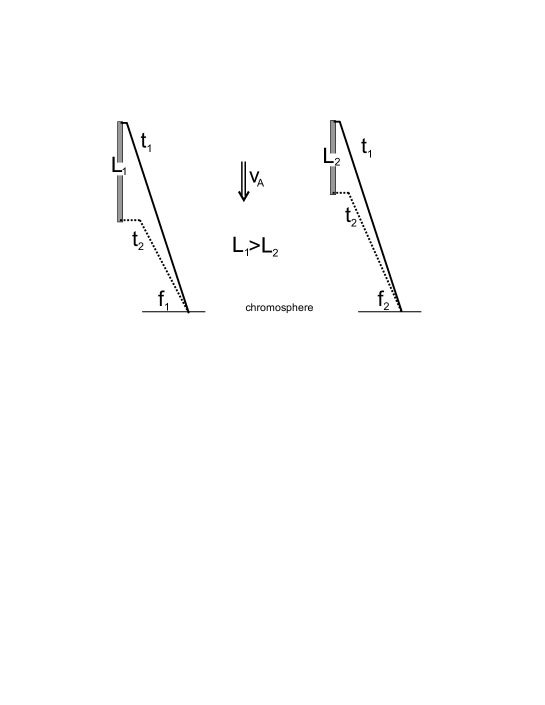
In the following we will extract the effect of the CS length on the energy released in the corona and subsequently deposited in the chromosphere. When the magnetic field lines break and reconnect, the magnetic energy is converted to heat, kinetic energy and fast particle energy (e.g. ?). We assume an arcade of magnetic field lines embedded in a homogeneous magnetic field in the chromosphere/photosphere and corona, that goes through an “idealized” process of reconnection having a similar reconnection rate along the entire arcade. From this arcade we pick out two sets of neighboring field lines and , each mapping to a unit area in the chromosphere (cf. Fig. 3). Each field line is swept into the reconnection region and moves after reconnection (directed to the chromosphere) along the CS of length with (external Alfvén speed). The total amount of energy supplied to the chromosphere is proportional to the time that the field line needs to move along the CS. Assuming that the length of the CS through which moves is longer than for , i.e. , the total amount of energy supplied is higher for than for since . Another effect of the different CS lengths at different parts of the arcade is that through the larger area of the CS () a larger number of electrons can be accelerated per unit time.
From the observations analyzed in Paper I, we obtained that the magnetic field strength is by a factor of 6–8 larger for those parts of H ribbons that were accompanied by HXR sources compared to those without, whereas the propagation velocities of different parts (with/without HXR sources) of the flaring ribbon were found to be in the same range. Applying the above described scenario, on the one hand a stronger magnetic field at the footpoints reduces since it varies with ( - minor effect) and on the other hand increases the released energy ( - major effect). Moreover, the number of particles available for acceleration is simply proportional to .
3 Discussion and Conclusion
Concluding, the energy release as well as the number of accelerated electrons varies with the length of the CS. Both favor the occurrence of localized HXR footpoint sources. Thus, the geometry of the CS might be an important parameter in “guiding” a large number of accelerated particles and enhanced energy release to a subsystem of loops, which may be identified with the confined HXR emission sources in contrast to the elongated ribbons as observed in H and UV. However, we also want to stress that the magnetic field strength certainly plays a major role in the occurrence of HXR source locations along the flaring arcade.
In several studies it was shown that a close correlation exists between CME kinematics and associated flare characteristics (???). In the present study, a very close match between the CME acceleration profile and the flare HXR flux is seen. From this we propose that the CME might to a certain degree influence the geometry of the CS, like the “asymmetric” or “symmetric” vertical stretching of the CS along the flaring arcade.
To prove this proposal, it would be necessary to make a quantitative study on flares where high cadence observations of both the erupting filament and the corresponding HXR sources are available. Flares that can be either associated to “symmetric” or “asymmetric” filament eruptions, should show us HXR source locations at different parts along the ribbons (see also ??). This would provide further evidence for the “guiding/focusing” of accelerated particles by the CS geometry.
Acknowledgements
M.T. gratefully acknowledges the Austrian Fonds zur Förderung der wissenschaftlichen Forschung (FWF grant J2512-N02). This work is supported by the Air Force Office of Scientific Research, Air Force Material Command, USAF, under grant number FA8655-06-1-3036.
Bibliography
- Asai, A., Masuda, S., Yokoyama, T., Shimojo, M., Isobe, H., Kurokawa, H., and Shibata, K.: 2002, ApJ 578, L91–L94.
- Asai, A., Yokoyama, T., Shimojo, M., Masuda, S., Kurokawa, H., and Shibata, K.: 2004, ApJ 611, 557–567.
- Brown, J. C.: 1971, Sol. Phys. 18, 489–502.
- Carmichael, H.: 1964, in W. N. Hess (ed.), The Physics of Solar Flares: Proceedings of the AAS-NASA Symposium, Washington D.C., NASA, STI Division, 1964., p. 451.
- Fletcher, L. and Hudson, H.: 2001, Sol. Phys. 204, 69–89.
- Forbes, T. G. and Priest, E. R.: 1984, Sol. Phys. 94, 315–340.
- Grigis, P. C. and Benz, A. O.: 2005, ApJ 625, L143–L146.
- Hirayama, T.: 1974, Sol. Phys. 34, 323.
- Hoyng, P., Duijveman, A., Machado, M. E., Rust, D. M., Svestka, Z., Boelee, A., de Jager, C., Frost, K. T., Lafleur, H., Simnett, G. M., van Beek, H. F., and Woodgate, B. E.: 1981, ApJ 246, L155.
- Kašparová, J., Karlický, M., Kontar, E. P., Schwartz, R. A., and Dennis, B. R.: 2005, Sol. Phys. 232, 63–86.
- Kopp, R. A. and Pneuman, G. W.: 1976, Sol. Phys. 50, 85–98.
- Krucker, S., Fivian, M. D., and Lin, R. P.: 2005, Advances in Space Research 35, 1707–1711.
- Krucker, S., Hurford, G. J., and Lin, R. P.: 2003, ApJ 595, L103–L106.
- Lin, R. P., Krucker, S., Holman, G. D., Sui, L., Hurford, G. J., and Schwartz, R. A.: 2003, in T. Kajita, Y. Asaoka, A. Kawachi, Y. Matsubara, and M. Sasaki (eds), Proceedings of the 28th International Cosmic Ray Conference, IUPAP, 2003., p. 3207.
- Maričić, D., Vršnak, B., Stanger, A. L., Veronig, A., Temmer, M., and Roša, D.: 2007, Sol. Phys. p. in press.
- Masuda, S., Kosugi, T., Hara, H., Tsuneta, S., and Ogawara, Y.: 1994, Nature 371, 495–497.
- Masuda, S., Kosugi, T., and Hudson, H. S.: 2001, Sol. Phys. 204, 55–67.
- Sakao, T.: 1994, Ph.D. Thesis, University of Tokyo .
- Sakao, T., Kosugi, T., Masuda, S., Inda, M., Makishima, K., Canfield, R. C., Hudson, H. S., Metcalf, T. R., Wuelser, J.-P., Acton, L. W., and Ogawara, Y.: 1992, PASJ 44, L83–L87.
- Sturrock, P. A.: 1966, Nature 211, 695.
- Sui, L., Holman, G. D., and Dennis, B. R.: 2004, ApJ 612, 546–556.
- Švestka, Z.: 1996, Sol. Phys. 169, 403–413.
- Švestka, Z. F., Fontenla, J. M., Machado, M. E., Martin, S. F., and Neidig, D. F.: 1987, Sol. Phys. 108, 237–250.
- Temmer, M., Veronig, A. M., Vršnak, B., and Miklenic, C.: 2007, ApJ 654, 001–005.
- Treumann, R. A. and Baumjohann, W.: 1997, London: Imperial College Press, 1997.
- Tripathi, D., Isobe, H., and Mason, H. E.: 2006, A&A 453, 1111–1116.
- Tsuneta, S., Hara, H., Shimizu, T., Acton, L. W., Strong, K. T., Hudson, H. S., and Ogawara, Y.: 1992, PASJ 44, L63–L69.
- Veronig, A. M. and Brown, J. C.: 2004, ApJ 603, L117–L120.
- Veronig, A. M., Karlický, M., Vršnak, B., Temmer, M., Magdalenić, J., Dennis, B. R., Otruba, W., and Pötzi, W.: 2006, A&A 446, 675–690.
- Vršnak, B., Maričić, D., Stanger, A. L., and Veronig, A.: 2004, Sol. Phys. 225, 355–378.
- Vršnak, B., Temmer, M., Veronig, A., Karlický, M., and Lin, J.: 2006, Sol. Phys. 234, 273–299.
- Zhang, J., Dere, K. P., Howard, R. A., Kundu, M. R., and White, S. M.: 2001, ApJ 559, 452–462.