NLTE determination of the sodium abundance in a homogeneous sample of extremely metal-poor stars
Abstract
Context. Abundance ratios in extremely metal-poor (EMP) stars are a good indication of the chemical composition of the gas in the earliest phases of the Galaxy evolution. It had been found from an LTE analysis that at low metallicity, and in contrast with most of the other elements, the scatter of [Na/Fe] versus [Fe/H] was surprisingly large and that, in giants, [Na/Fe] decreased with metallicity.
Aims. Since it is well known that the formation of sodium lines is very sensitive to non-LTE effects, to firmly establish the behaviour of the sodium abundance in the early Galaxy, we have used high quality observations of a sample of EMP stars obtained with UVES at the VLT, and we have taken into account the non-LTE line formation of sodium.
Methods. The profiles of the two resonant sodium D lines (only these sodium lines are detectable in the spectra of EMP stars) have been computed in a sample of 54 EMP giants and turn-off stars (33 of them with ) with a modified version of the code MULTI, and compared to the observed spectra.
Results. With these new determinations in the range , both [Na/Fe] and [Na/Mg] are almost constant with a low scatter. In the turn-off stars and ”unmixed” giants (located in the low RGB): or . These values are in good agreement with the recent determinations of [Na/Fe] and [Na/Mg] in nearby metal-poor stars. Moreover we confirm that all the sodium-rich stars are ”mixed” stars (i.e., giants located after the bump, which have undergone an extra mixing). None of the turn-off stars is sodium-rich. As a consequence it is probable that the sodium enhancement observed in some mixed giants is the result of a deep mixing.
Key Words.:
Line : Formation – Line : Profiles – Stars: Abundances – Stars: Mixing – Stars: Supernovae – Galaxy evolutione-mail: Monique.Spite@obspm.fr
1 Introduction
During the last decade the interest in the extremely metal-poor (EMP) galactic stars has significantly increased. These stars, in fact, are reservoirs of the primordial Galactic material that was only slightly polluted by nuclides produced in SNe II (by the first generation of massive stars). Thus, elemental abundances provided by metal-poor old stars, and especially abundance ratios, are of the highest importance for the testing of the SN theoretical models, their yields, and finally for constraining the initial mass function slope in the early Galaxy and understanding its formation history and early evolution.
With the advent of large aperture telescopes, the precise elemental abundances in these faint objects became available. Such abundance ratios as [/Fe], [Na, Al/Fe], and others can be derived from high-resolution spectra and then compared to the SNe II yield prediction. In particular in Cayrel et al. (2004) and in Bonifacio et al. (2006), a homogeneous sample of EMP stars has been studied: 35 giants and 18 turn-off stars (39 of them with ). It has been shown that in these EMP stars the scatter of the abundanc e ratios at metallicity below –3.0 dex is generally very small and comparable to the measurement errors. But there are some exceptions, and one of the most striking cases is [Na/Fe], which varies from star to star by a factor close to ten. In these EMP stars, only the resonance lines of Na (D1 and D2) are visible, and these lines are known to be very sensitive to NLTE effects (e.g., Mashonkina et al. 1993; Baumüller et al. 1998).
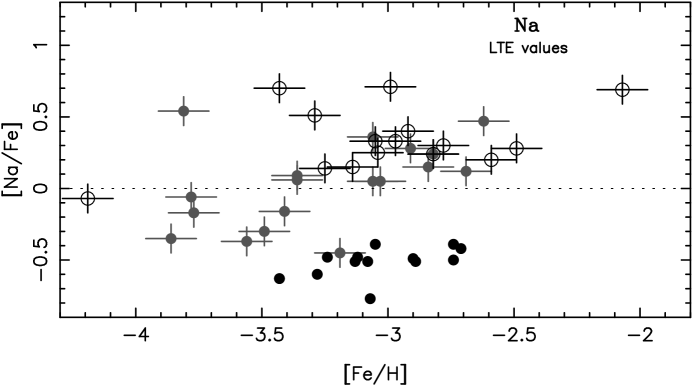
In Cayrel et al. (2004) and Spite et al. (2005) the sodium abundance has been calculated under the LTE hypothesis. Later, as a very first approximation, a uniform correction LTE-NLTE of –0.5 dex, extrapolated in the table of Baumüller et al. (1998) for , was applied to all the giants. The scatter of the relation [Na/Fe] versus [Fe/H] in giants was then very large, and [Na/Fe] was decreasing with the metallicity in contrast to the turn-off stars (Spite et al., 2005) where the ratio [Na/Fe] was almost constant in the interval .
In Fig. 1 we show the relation [Na/Fe] vs. [Fe/H] for our sample of dwarfs and giants without any NLTE correction. The lower RGB stars (below the bump, see Spite et al. 2006) and the upper RGB stars (above the bump) have been plotted with different symbols. In the mean, the dwarfs have a lower value of [Na/Fe] than the giants, and the lower RGB stars a lower value of [Na/Fe] than the upper RGB stars. This variation of [Na/Fe] with the gravity of the star suggests that, as expected, non-LTE effects are very pronounced on the Na D lines, and that as a consequence it is important to carefully take them into account. In this paper we present new determinations of the sodium abundance in the sample of EMP stars of Cayrel et al. (2004) and Bonifacio et al. (2006) through a careful NLTE analysis, and we discuss the new trends obtained.
2 The star sample
The spectra used here have been presented in detail in Cayrel et al. (2004) and Bonifacio et al. (2006). The observations were performed with the ESO VLT and its high resolution spectrograph UVES (Dekker et al. 2000). The spectra have a resolving power of 43000 in the region of the D lines and a typical S/N ratio per pixel of ; they have been reduced using the UVES context (Ballester et al. 2000) within MIDAS. Stellar parameters (effective temperature, surface gravity, microturbulent velocity, and metallicity) for each star have been taken from Cayrel et al. (2004) and Bonifacio et al. (2006).
3 Method of analysis
To derive the sodium abundance in the program stars, we perform an NLTE analysis of the two resonant sodium D1 and D2 lines (only these lines are seen in the spectra of the EMP stars) using a modified version of the MULTI code (Carlsson 1986). These modifications are described in Korotin et al. (1999ab). To more adequately calculate the continuous opacity taking into account the absorption produced by the great number of spectral lines, the additional opacity sources from ATLAS9 (Kurucz 1992) are included. Simultaneous solution of the radiative transfer and statistical equilibrium equations are obtained using the approximation of a complete frequency redistribution for all the sodium lines. Atmosphere models of appropriate metallicity are interpolated in Kurucz’s grid of stellar atmosphere models (microturbulent velocity 2 km s-1, ). This modified code has already been used for NLTE abundance determination of carbon, oxygen, and sodium in stars of different types (see, e.g., Korotin et al. 1999ab; Korotin & Mishenina 1999; Andrievsky et al. 2001; Andrievsky et al. 2002, and references therein).
We employ the modified model of the sodium atom (first considered by Sakhibullin 1987) that consists of 27 energy levels of Na I atoms in addition to the ground level of the Na II ion. The fine splitting has been taken into account only for the 3p level. This enables one to calculate the sodium doublet more precisely. The radiative transitions between the first 20 levels of Na I and the ground level of Na II are considered, while transitions between the other levels are used for the particle number conservation. Linearization includes 46 and 20 transitions. Radiative rates for 34 transitions are fixed. Photoionization rates were taken from TOPBASE. Collisions with electrons, as well as with hydrogen atoms, have been included.
Figure 2 shows the behaviour of the departure coefficients of Na I for dwarfs and giants of different metallicities. It is clearly seen that within the region of the line-formation in the atmosphere, the lower levels of the Na I atom are overpopulated, leading to a larger opacity in D1,2 lines compared to the pure LTE case, and therefore to larger equivalent widths of these lines. This means that NLTE abundance corrections will be negative.
To find the relative-to-solar sodium abundance, we computed NLTE sodium abundance in the Sun. This was done with the following lines: 4496.05, 4982.81, 5148.84, 5682.63, 5688.20, 5889.95, 5895.92, 6154.22, 6160.75, 8183.25, 8194.82, and 12679.14 Å. Their profiles were extracted from the Kurucz et al. (1984) solar flux spectrum. Similarly to the stellar spectra analysis, to derive the NLTE sodium abundance in the Sun, we used the solar atmosphere model from the Kurucz’s grid and the solar microturbulent velocity recommended by Maltby et al. (1986). Our NLTE solar sodium abundance is , in agreement with the value found by Baumüller et al. (BBG98 (1998)): , and Mashonkina et al. (MET00 (2000)): . The value will be used later, as a reference to determine [Na/H].
| Star | T | vt, km s-1 | [Fe/H] | (Na) | [Na/H] | [Na/Fe] | Rem | |
|---|---|---|---|---|---|---|---|---|
| Turnoff stars | ||||||||
| BS 16023–046 | 6360 | 4.5 | 1.4 | –2.97 | 3.33 | –2.92 | +0.05 | |
| BS 16968–061 | 6040 | 3.8 | 1.5 | –3.05 | 2.80 | –3.45 | –0.40 | |
| BS 17570–063 | 6240 | 4.8 | 0.5 | –2.92 | 3.12 | –3.13 | –0.21 | |
| CS 22177–009 | 6260 | 4.5 | 1.2 | –3.10 | 2.95 | –3.30 | –0.20 | |
| CS 22888–031 | 6150 | 5.0 | 0.5 | –3.28 | 2.70 | –3.55 | –0.25 | |
| CS 22948–093 | 6360 | 4.3 | 1.2 | –3.43 | 2.44 | –3.81 | –0.51 | |
| CS 22953–037 | 6360 | 4.3 | 1.4 | –2.89 | 2.90 | –3.35 | –0.46 | |
| CS 22965–054 | 6090 | 3.8 | 1.4 | –3.04 | 3.10 | –3.15 | –0.11 | |
| CS 22966–011 | 6200 | 4.8 | 1.1 | –3.07 | 2.95 | –3.30 | –0.23 | |
| CS 29499–060 | 6320 | 4.0 | 1.5 | –2.70 | 3.23 | –3.02 | –0.32 | |
| CS 29506–007 | 6270 | 4.0 | 1.7 | –2.91 | 3.15 | –3.10 | –0.19 | |
| CS 29506–090 | 6300 | 4.3 | 1.4 | –2.83 | 3.40 | –2.85 | –0.02 | |
| CS 29518–020 | 6240 | 4.5 | 1.7 | –2.77 | 3.20 | –3.05 | –0.25 | |
| CS 29518–043 | 6430 | 4.3 | 1.3 | –3.24 | 2.75 | –3.50 | –0.30 | |
| CS 29527–015 | 6240 | 4.0 | 1.6 | –3.55 | 2.50 | –3.75 | –0.20 | |
| CS 29528–041* | 6170 | 4.0 | 1.3 | –3.06 | 3.85 | –2.40 | +0.66 | |
| CS 30301–024 | 6330 | 4.0 | 1.6 | –2.75 | 3.30 | –2.95 | –0.20 | |
| CS 30339–069 | 6240 | 4.0 | 1.3 | –3.08 | 3.00 | –3.25 | –0.17 | |
| CS 31061–032 | 6410 | 4.3 | 1.4 | –2.58 | 3.50 | –2.75 | –0.17 | |
| Giants | ||||||||
| HD 2796 | 4950 | 1.5 | 2.1 | –2.47 | 3.65 | –2.60 | –0.13 | m |
| HD 122563 | 4600 | 1.1 | 2.0 | –2.82 | 3.20 | –3.05 | –0.23 | m |
| HD 186478 | 4700 | 1.3 | 2.0 | –2.59 | 3.45 | –2.80 | –0.21 | m |
| BD +17:3248 | 5250 | 1.4 | 1.5 | –2.07 | 4.44 | –1.81 | +0.26 | m |
| BD –18:5550 | 4750 | 1.4 | 1.8 | –3.06 | 2.90 | –3.35 | –0.29 | |
| CD –38:245 | 4800 | 1.5 | 2.2 | –4.19 | 2.15 | –4.10 | +0.09 | m |
| BS 16467–062 | 5200 | 2.5 | 1.6 | –3.77 | 2.38 | –3.87 | –0.10 | |
| BS 16477–003 | 4900 | 1.7 | 1.8 | –3.36 | 2.80 | –3.45 | –0.09 | |
| BS 17569–049 | 4700 | 1.2 | 1.9 | –2.88 | 3.25 | –3.00 | –0.12 | m |
| CS 22169–035 | 4700 | 1.2 | 2.2 | –3.04 | 3.30 | –2.95 | +0.09 | m |
| CS 22172–002 | 4800 | 1.3 | 2.2 | –3.86 | 2.15 | –4.10 | –0.24 | |
| CS 22186–025 | 4900 | 1.5 | 2.0 | –3.00 | 3.15 | –3.10 | –0.10 | m |
| CS 22189–009 | 4900 | 1.7 | 1.9 | –3.49 | 2.47 | –3.78 | –0.29 | |
| CS 22873–055 | 4550 | 0.7 | 2.2 | –2.99 | 3.40 | –2.85 | +0.14 | m |
| CS 22873–166 | 4550 | 0.9 | 2.1 | –2.97 | 3.20 | –3.05 | –0.08 | m |
| CS 22878–101 | 4800 | 1.3 | 2.0 | –3.25 | 2.95 | –3.30 | –0.05 | m |
| CS 22885–096 | 5050 | 2.6 | 1.8 | –3.78 | 2.50 | –3.75 | +0.03 | |
| CS 22891–209 | 4700 | 1.0 | 2.1 | –3.29 | 3.10 | –3.15 | +0.14 | m |
| CS 22892–052* | 4850 | 1.6 | 1.9 | –3.03 | 3.00 | –3.25 | –0.22 | |
| CS 22896–154 | 5250 | 2.7 | 1.2 | –2.69 | 3.47 | –2.78 | –0.09 | |
| CS 22897–008 | 4900 | 1.7 | 2.0 | –3.41 | 2.69 | –3.56 | –0.15 | |
| CS 22948–066 | 5100 | 1.8 | 2.0 | –3.14 | 2.97 | –3.28 | –0.14 | m |
| CS 22949–037* | 4900 | 1.5 | 1.8 | –3.97 | 3.85 | –2.40 | +1.57 | m |
| CS 22952–015 | 4800 | 1.3 | 2.1 | –3.43 | 3.33 | –2.92 | +0.51 | m |
| CS 22953–003 | 5100 | 2.3 | 1.7 | –2.84 | 3.20 | –3.05 | –0.21 | |
| CS 22956–050 | 4900 | 1.7 | 1.8 | –3.33 | 4.30 | –1.95 | - - | |
| CS 22966–057 | 5300 | 2.2 | 1.4 | –2.62 | 3.60 | –2.65 | –0.03 | |
| CS 22968–014 | 4850 | 1.7 | 1.9 | –3.56 | 2.35 | –3.90 | –0.34 | |
| CS 29491–053 | 4700 | 1.3 | 2.0 | –3.04 | 3.05 | –3.20 | –0.16 | m |
| CS 29495–041 | 4800 | 1.5 | 1.8 | –2.82 | 3.22 | –3.03 | –0.21 | |
| CS 29502–042 | 5100 | 2.5 | 1.5 | –3.19 | 2.63 | –3.62 | –0.43 | |
| CS 29516–024 | 4650 | 1.2 | 1.7 | –3.06 | 3.05 | –3.20 | –0.14 | |
| CS 29518–051 | 5200 | 2.6 | 1.4 | –2.69 | 3.40 | –2.85 | –0.16 | m |
| CS 30325–094 | 4950 | 2.0 | 1.5 | –3.30 | 2.84 | –3.41 | –0.11 | |
| CS 31082–001 | 4825 | 1.5 | 1.8 | –2.91 | 3.30 | –2.95 | –0.04 |


4 Results
New sodium abundances have been deduced from NLTE profiles of the D lines for our sample of EMP stars. Typical uncertainty in the derived sodium abundance is about (see Fig. 3). Figure 4 shows the best fitting between observed and calculated profiles for some EMP giants and dwarfs. In Table 1 the parameters of the models (Teff, log g and ) which have been used and the new sodium abundance in logarithm (for ) are given for each star. The stellar ratios [Na/H] have been computed assuming (see Sect. 3).
Three stars in our sample are very peculiar carbon-rich stars: CS 22892-52 (Sneden et al. 1996, 2000, 2003), CS 22949-37 (Norris et al. 2001; Depagne et al. 2002), and CS 29528-41 (Sivarani et al. 2006). The models we used for the NLTE computations do not take the carbon enhancement in these stars into account and thus the sodium abundance computed here must be considered as very preliminary. These stars are not taken into account in the discussion.


| [M/H] | -2.5 | -3.0 | -3.5 | -4.0 | ||||
|---|---|---|---|---|---|---|---|---|
| Teff=4500 log g=0.8 | ||||||||
| EW | corr | EW | corr | EW | corr | EW | corr | |
| D1 | 182 | -0.48 | 138 | -0.63 | 107 | -0.44 | 81 | -0.24 |
| D2 | 161 | -0.54 | 122 | -0.52 | 93 | -0.32 | 66 | -0.14 |
| Teff=4600 log g=1.0 | ||||||||
| D1 | 167 | -0.62 | - | - | - | - | - | - |
| D2 | 149 | -0.60 | - | - | - | - | - | - |
| Teff=4750 log g=1.4 | ||||||||
| D1 | 151 | -0.65 | 124 | -0.53 | 100 | -0.34 | 74 | -0.13 |
| D2 | 135 | -0.58 | 110 | -0.41 | 85 | -0.20 | 57 | -0.08 |
| Teff=5000 log g=2.0 | ||||||||
| D1 | 142 | -0.59 | 115 | -0.44 | 91 | -0.24 | 63 | -0.08 |
| D2 | 126 | -0.52 | 100 | -0.31 | 75 | -0.14 | 45 | -0.06 |
| Teff=5250 log g=2.7 | ||||||||
| D1 | 137 | -0.56 | 108 | -0.39 | 82 | -0.19 | 52 | -0.06 |
| D2 | 119 | -0.47 | 92 | -0.28 | 64 | -0.12 | 34 | -0.06 |
| Teff=5550 log g=3.3 | ||||||||
| D1 | 122 | -0.49 | 95 | -0.32 | 67 | -0.14 | 38 | -0.06 |
| D2 | 105 | -0.38 | 79 | -0.22 | 49 | -0.09 | 23 | -0.06 |
| Teff=6000 log g=3.7 | ||||||||
| D1 | 101 | -0.39 | 75 | -0.22 | 45 | -0.10 | 21 | -0.06 |
| D2 | 85 | -0.28 | 57 | -0.13 | 29 | -0.08 | 12 | -0.06 |
| Teff=6350 log g=4.1 | ||||||||
| D1 | 88 | -0.34 | 61 | -0.18 | 32 | -0.09 | 13 | -0.06 |
| D2 | 72 | -0.23 | 43 | -0.12 | 19 | -0.08 | 7 | -0.06 |
In Fig. 5 we present an estimate of the difference in sodium abundance obtained when LTE or NLTE profiles of the D lines are used along the Red Giant Branch of the HR diagram. The computations have been done for a set of temperatures between 6500 K (turn-off stars) to 4500 K (upper RGB stars) and metallicities from to (Table 2). For each temperature the gravity has been deduced from the isochrones of Kim et al. (2002) for 14 Gyr, , with the classical formula:


For this set of models, the LTE profiles have been computed with the hypothesis that [Na/H] = [Fe/H] (i.e., [Na/Fe] = 0), and then fitted by NLTE profiles that enabled the derivation of the appropriate NLTE corrections. A first cause of uncertainty is that the shapes of LTE and NLTE profiles are slightly different, but the correction mainly depends on the equivalent width of the sodium lines, as can be seen in Fig. 6. As a consequence, the corrections given in Table 2 can be used only if the equivalent width of the lines is similar to that given in the table. If there is a strong anomaly of the sodium abundance in the star, it is better to deduce the correction from the Fig. 6 (or to directly compute the non-LTE profile of the line as it has been done for the stars of our sample). Takeda et al. (2003) have made a first attempt to compute the non-LTE correction of the sodium abundance in a large metallicity range (). We have checked that in our domain of metallicity () there is a rather good agreement with their computations.
5 Discussion
5.1 Mixing effects in giant stars
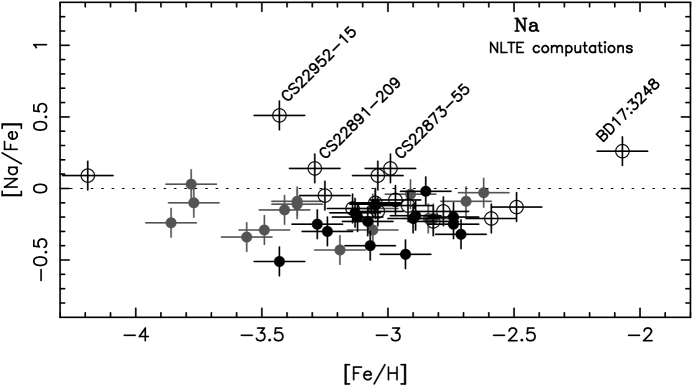
In Fig. 7 we present the NLTE values of [Na/Fe] for our sample of stars as a function of [Fe/H] (the carbon-rich stars have been omitted). The symbols are the same as in Fig 1. Dwarfs and giants now lie in the same locus, and the trend of the [Na/Fe] ratio, in the range , is flat. The mean value of [Na/Fe] is close to –0.2.
A few stars appear to be ”Na-rich” with . All these stars belong, following Spite et al. (SCH06 (2006)), to the class of the ”mixed stars”. They present the characteristics of a mixing with the H-burning shell, low abundance of carbon correlated with a high abundance of nitrogen, and a low value of the ratio close to the equilibrium value. However, all the mixed stars are not Na-rich. Let us remark that all the stars found here with were already suspected from LTE computations, to be Na-rich. All of them, but BD 17:3248, have also been found to be aluminum rich, and from their position in the HR diagram they could be AGB stars (see also Johnson (Joh02 (2002)), and Bond (Bo80 (1980)) for BD 17:3248). None of the turn-off stars or ”unmixed” giants are sodium rich. As a consequence the sodium rich stars are suspected to have suffered a mixing between the atmosphere and the H-burning shell, a mixing deep enough to bring the products of the Ne-Na cycle to the surface. When only EMP dwarfs and unmixed giants are taken into account, we find that or ; the star-to-star variation becomes small and comparable to what is obtained for the other elements (see Cayrel et al. CDS04 (2004)).
5.2 Comparison with the nearby metal-poor stars, and the prediction of the models of galactic chemical evolution
Recently Gehren et al. (GSZ06 (2006)) have computed the sodium abundance in a sample of 55 nearby metal-poor stars, most of them belonging to the thin or thick Galactic disc and some of them to the halo. They have very carefully taken into account the non-LTE effects. In Fig. 8 we compare the ratio [Na/Fe] in our EMP stars and in the sample of Gehren et al. (GSZ06 (2006)); unfortunately, we have no star in common to check the influence of systematic effects, but they have one star in our domain of metallicity (G64-12 with [Fe/H]=–3.1), and this star falls exactly in the middle of our sample in Fig. 8.
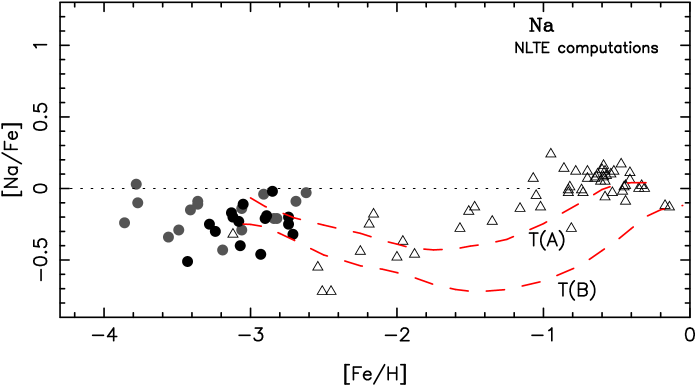
Sodium has only one (stable) isotope, , which is mainly produced in the carbon burning process operating inside massive stars. As noted by Woosley & Weaver (1995) the resulting amount of sodium nuclei in the SN ejecta is sensitive to the excess of neutrons, therefore its production is somewhat metal dependent, but in the early Galaxy (very low metal content) this element production should be the same as for the primary elements. There were several attempts to incorporate the observed sodium abundance in the disc and halo stars into Galactic evolutionary models. One can mention here the works of Timmes et al. (1995), Samland (1998), and Goswami & Prantzos (2000). All the above-mentioned models are based on the Woosley & Weaver (1995) yields from massive stars, but use different initial-mass functions, star formation rates, and other model specifications, which can explain the slight differences in the predictions.
In Fig. 8 our observations and those of Gehren et al. (GSZ06 (2006)) are compared to the predictions of Timmes et al. (TWW95 (1995)). These authors predict a local minimum around [Fe/H] = –1.5 with subsequent increasing of [Na/Fe] as the metallicity decreases to [Fe/H] = –3. The predictions for two different values of the iron yields from massive stars (which depend on the mass cut in the massive supernovae) are represented in the figure. Between models T(A) and T(B), the mass of iron ejected by SN II differs by a factor of two. At a metallicity higher than [Fe/H]= –3, there is a rather good agreement with the predictions of the model T(A), which supposes the smallest value of the iron yields from massive stars, and such an agreement is generally found for the other elements (see Cayrel et al. CDS04 (2004)).
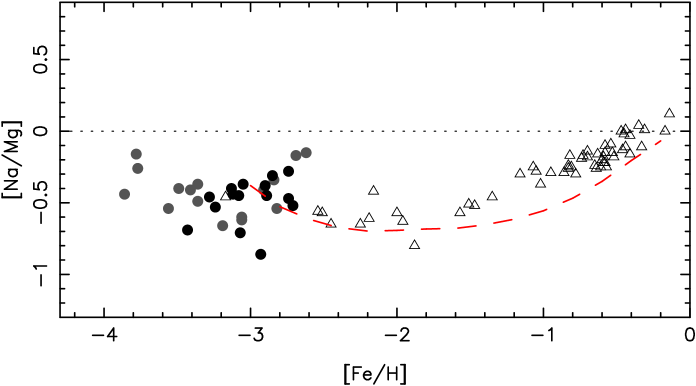
In contrast with [Na/Fe], the ratio [Na/Mg] is independent of the mass cut. In Fig. 9 we present [Na/Mg] as a function of [Fe/H] for our sample of EMP stars and the sample of Gehren et al. (GSZ06 (2006)). (We neglected the NLTE effects on the magnesium lines that are not supposed to be very important). The agreement is rather good for .
Timmes et al. (TWW95 (1995)) do not predict the behaviour of [Na/Fe] or [Na/Mg] for . From our measurements, [Na/Fe] and [Na/Mg] become flat: the relative abundances are independent of the metallicity. However, a slight increase of [Na/Mg] when the metallicity decreases (from [Na/Mg]= –0.5 at [Fe/H]=–3. to [Na/Mg]= –0.3 at [Fe/H]=–4.) cannot be excluded.
Samland (Sa98 (1998)) has considered the chemical evolution of many elements and found that the expected distribution of [Na/Fe] vs. [Fe/H] in the extreme metallicity region from [Fe/H] = –4 to –2.5 is almost independent of [Fe/H], and the mean [Na/Fe] value equals approximately –0.2. This was not supported by observations available at that time, but is in good agreement with our observations. Qualitatively the same conclusion was reached by Goswami & Prantzos (2000). According to their model, [Na/Fe] must be almost constant within this metallicity interval and equal approximately –0.5, but this is significantly lower than what is given by our calculations.
Recently Tsujimoto et al. (TSY02 (2002)) have also investigated the chemical evolution of sodium and aluminum during the early epochs of the Galaxy. They have used a model that reproduces the distribution of EMP stars in the [Na/Mg] or [Al/Mg] versus [Mg/H] plane. The observed trends and the scatter of the observations are mainly based on the work of McWilliam et al. (MPS95 (1995)). This sample contains several mixed giants which explain the very large scatter of [Na/Mg] and [Al/Mg] they observed at low metallicity. Such a scatter, which is an important point in the definition of the model of Tsujimoto et al. (TSY02 (2002)), is not observed in the unmixed stars of our sample (dwarfs and ”unmixed” giants) and thus does not probably reflect a scatter in the pristine material. Let us note that Cohen et al. (CCM04 (2004)), who studied a sample of turnoff stars in the interval , also found a very small scatter of [Al/Mg]. The precise determination of [Al/Mg] in our sample of stars from non-LTE synthetic profiles is in progress.
6 Conclusion
NLTE abundances of sodium have been derived for a sample of extremely metal-poor dwarfs and giants using high-resolution spectra obtained with VLT. Both subsamples of dwarfs and unmixed giants now have the same mean [Na/Fe] or [Na/Mg] values, within the standard errors: or . However, a slight increase of [Na/Mg] at low metallicity, (from [Na/Mg]= –0.5 at [Fe/H]=–3. to [Na/Mg]= –0.3 [Fe/H]=–4.) cannot be excluded.
In the domain , the giants of our sample do not exhibit any systematic dependence of [Na/Fe] upon [Fe/H], contrary to the preliminary findings of Cayrel et al. (CDS04 (2004)). This effect was a consequence of a coarse treatment of the non-LTE effects: in Cayrel et al. (CDS04 (2004)) the LTE abundances had been uniformely corrected by –0.5dex. In fact, the non-LTE correction strongly depends on the equivalent width of the sodium lines and thus is generally smaller at lower metallicity. (When the lines are smaller they form deeper in the atmosphere where, in particular, collisions are more important and thus non-LTE corrections are smaller.)
Among the giant stars, the ”mixed” giants (stars that have undergone an extra-mixing between the atmosphere and the H-burning shell following Spite et al. SCP05 (2005)), often present an overabundance of Na. It is suggested that in these stars, material processed in Ne-Na cycle in the hot hydrogen burning shell has been brought to the surface. From their position in the HR diagram, some of these stars could be AGB stars.
Qualitatively, our observational result on sodium distribution in the metallicity region [Fe/H] from –4 to –2.5 agrees with predictions of models elaborated by Samland (1998) and Goswami & Prantzos (2000). Both models produce the almost constant [Na/Fe] value in the region of extreme metal-poor stars. In particular, the Samland’s model gives an average [Na/Fe] value that approximately equals –0.2, and this value appears to be in quantitavive agreement with our estimate of the mean relative-to-iron sodium abundance in the early Galaxy. The model of Timmes et al. (TWW95 (1995)) also agrees with our observations around [Fe/H]=–3. In qualitative agreement, the model of Goswami & Prantzos predicts a slightly too low relative sodium abundance for extremely metal-poor stars.
Acknowledgements.
SMA kindly acknowledges the C.N.R.S./INSU for financial support and the Paris-Meudon Observatoire for its hospitality during his productive stay in Meudon.References
- (1) Andrievsky S.M., Kovtyukh V.V., Korotin S.A., Spite M., Spite F., 2001, A&A 367, 605
- (2) Andrievsky S.M., Egorova I.A., Korotin S.A., Burnage R., 2002, A&A 389, 519
- (3) Ballester P., Modigliani A., Boitiquin O., Cristiani S., Hanuschik R. et al., 2000, ESO Messenger 101, 31
- (4) Baumüller D., Butler K., Gehren T., 1998, A&A 338, 637
- (5) Bond H.E. 1980 ApJS 44 517
- (6) Carlsson M., 1986, Uppsala Obs. Rep. 33
- (7) Cayrel R., Depagne E., Spite M., Hill V., Spite F., Francois P., Plez B., Beers T., Primas F., Andersen J., Barbuy B., Bonifacio P., Molaro P., Nordstróm B., 2004, A&A 416, 1117
- (8) Cohen J., Christlieb N., McWilliam A., Schectman S., Thompson I. et al., 2004, ApJ 612, 1107
- (9) Dekker H., D’Odorico S., Kaufer A., et al. 2000 in Optical and IR Telescopes Instrumentation and Detectors, eds I. Masanori & A.F. Morwood Proc. SPIE 4008, 534
- (10) Depagne E., Hill V., Spite M., Spite F., Plez B., et al., 2002, A&A 390, 187
- (11) Gehren T., Shi J.R., Zhang H.W., Zhao G., Korn A.J., 2006, A&A 451,
- (12) Goswami A., Prantzos N., 2000, A&A 359, 191
- (13) Johnson J.A., 2002, ApJ 139, 219
- (14) Kim Y.-C., Demarque P., Yi S.K., Alexander D.R., 2002, ApJS 143, 499
- (15) Korotin S.A., Andrievsky S.M., Luck R.E., 1999a, A&A 351, 168
- (16) Korotin S.A., Andrievsky S.M., Kostynchuk L.Yu., 1999b, Ap&SS 260, 531
- (17) Korotin S.A., Mishenina T.V., 1999, ARep 43, 533
- (18) Kurucz R., 1992, RMxAA 23, 45
- (19) Kurucz R.L., Furenlid I., Brault J., Testerman L., 1984, National Solar Observatory, Atlas, Sunspot, New Mexico
- (20) Maltby P., Avrett E.H., Carlsson M., Kjeldseth-Moe O., Kurucz R.L., Loeser R., 1986, ApJ 306, 284
- (21) Mashonkina L.I., Sakhibullin N.A., Shimanskij V.V., 1993, ARep 37, 192
- (22) Mashonkina L.I., Shimanskii V.V., Sakhibullin N.A., 2000, ARep 44, 790
- (23) McWilliam A., Preston G.W., Sneden C., Searle L., 1995, AJ 109, 2757
- (24) Mishenina T.V., Kovtyukh V.V., Korotin S.A., Soubiran C., 2003, ARep 47, 422
- (25) Norris J.E., Ryan S.G., Beers T.C., 2001, ApJ 561, 1034
- (26) Samland M., 1998, ApJ 496, 155
- (27) Sivarani T., Beers T.C., Bonifacio P., Molaro P., et al. 2006, (submitted to A&A)
- (28) Sneden C., McWilliam A., Preston G.W., et al., 1996, ApJ 467, 819
- (29) Sneden C., Cowan J.J., Ivans I.I., et al., 2000, ApJ 533, L139
- (30) Sneden C., Cowan J.J., Lawler J.E., Ivans I.I., Burles S., Beers T.C., Primas F., Hill V., et al., 2003, ApJ 591, 936
- (31) Spite M., Cayrel R., Plez B., Hill V., F.Spite, E. Depagne et al., 2005, A&A 430, 655
- (32) Spite M., Bonifacio P., Cayrel R., Hill V., Francois P., Spite F. et al., 2005 in the Proceedings of the IAU symposium 228 ”From lithium to Uranium: Elemental Tracers of Early Chemical Evolution”, V.Hill, P. François, & F. Primas eds., p. 185
- (33) Spite M., Cayrel R., Hill V., Spite F., Francois P., Plez B., Bonifacio P., Molaro P., Depagne E. et al., 2006, A&A (in press), astro-ph(06050561)
- (34) Takeda Y., Zhao G., Takada-Hidai M., Chen Y.-Q., Saito Y. Zhang H.W., 2003, ChJAA 3, 316
- (35) Timmes F.X., Woosley S.E., Weaver T.A., 1995, ApJS 98, 617
- (36) Tsujimoto T., Shigeyama T., Yoshi Y., 2002, ApJ 565, 1011
- (37) Woosley S.E., Weaver T.A., 1995, ApJS 101, 181