AGNs and galaxy interactions
Abstract
We perform a statistical analysis of AGN host characteristics and nuclear activity for AGNs in pairs and without companions. Our study concerns a sample of AGNs derived from the SDSS-DR4 data by Kauffmann et al (2003) and pair galaxies obtained from the same data set by Alonso et al. (2006). An eye-ball classification of images of 1607 close pairs ( kpc , km ) according to the evidence of interaction through distorted morphologies and tidal features provides us with a more confident assessment of galaxy interactions from this sample. We notice that, at a given luminosity or stellar mass content, the fraction of AGNs is larger for pair galaxies exhibiting evidence for strong interaction and tidal features which also show sings of strong star formation activity. Nevertheless, this process accounts only for a increase of the fraction of AGNs. As in previous works, we find AGN hosts to be redder and with a larger concentration morphological index than non-AGN galaxies. This effect does not depend whether AGN hosts are in pairs or in isolation. The OIII luminosity of AGNs with strong interaction features is found to be significantly larger than that of other AGNs, either in pairs or in isolation. Estimations of the accretion rate, , show that AGNs in merging pairs are actively feeding their black holes, regardless of their stellar masses. We also find that the luminosity of the companion galaxy seems to be a key parameter in the determination of the black hole activity. At a given host luminosity, both the OIII luminosity and the are significantly larger in AGNs with a bright companion () than otherwise.
keywords:
cosmology: theory - galaxies: formation - galaxies: evolution.1 Introduction
Galaxy-galaxy interactions can be an effective mechanism to regulate the star formation activity in galaxies. Studies of galaxies in pairs in larger surveys such as the 2dFGRS and the SDSS showed with high statistical signal that star formation is enhanced by a factor of two in close systems (Lambas et al. 2003; Alonso et al 2004). The trend of increasing star formation for decreasing relative velocity and projected separation was first showed by Barton & Geller (1998). This trend was confirmed to be in place independently of the characteristics of environment by Alonso et al. (2006).
The physics behind the triggering of star formation activity during galaxy-galaxy interactions have been explained by theoretical (Martinet 1995 and references there in) and numerical analysis (e.g. Toomre & Toomre 1978; Barnes & Hernquist 1992, 1996; Mihos & Hernquist 1996). These studies showed that the starbursts are fueled by gas inflows produced by the tidal torques generating during the encounters. The efficiency of this mechanisms depends on the particular internal characteristics of galaxies and their gas reservoir.
Besides feeding star formation, these gas inflows could also feed a central black hole and AGN activity (Sanders et al. 1988). The co-evolution of galaxies and black holes is now widely accepted although many details on how this coexistence works are still understudied (Heckmann et al. 2004). Toomre & Toomre (1972) suggested that collisional disruption and gas dissipation could feed the nuclear activity of galaxies. Other ideas about the fueling of active galaxy nucleus are the disk of barred galaxies generated by internal instabilities which can lead the gas to the centre of galaxies (Schwartz 1981, Shlosman, Begelman & Frank 1990) and the presence of more that one supermassive black hole which seems likely in the nucleus of merger remnants (Begelman, Blanford and Rees 1980).
Certainly, all these processes may provide clues to solve the AGN fueling problem. However, AGN-galaxy interaction paradigm has been the issue of several studies which aim at determining, for example, the frequency of AGNs in a sample of interacting galaxies, the proximity effects of a close companion on the AGN power, etc. Dahari (1985), in a sample of 167 systems, found that there is an excess of Seyferts among spiral interacting galaxies and also that Seyfert activity and the existence of external tidal forces are interrelated. However, Seyfert nuclei were not found in interacting ellipticals. From statistical study of companions of Seyfert galaxies Fuentes-Williams & Stocke (1988) derived that Seyfert galaxies have a marginal excess of comparable size companions and a clear excess of faint companions. However, Keel (1996) found that the presence of AGN does not seem to be related with the type of collisional interaction.
Conversely Schmitt (2001) analysed a sample of different types of active galaxies such as LINERS, transition galaxies, absorption-line galaxies, Seyfert and HII galaxies. This author showed that galaxies of different activity types have similar percentage of companions than galaxies of similar morphological types with no nuclear activity. This result suggests that interactions between galaxies are not a necessary condition to trigger the nuclear activity in AGNs. Similar results were found by Kelm, Focardi & Zitelli (2004) by studying a sample of Seyfert in UZC-Compact Groups and by Coldwell & Lambas (2006) who analyzed the percentage of close companions of SDSS quasars within the range kpc and .
An interesting approach to study the role of interactions on the feeding of both star formation and black holes is to study AGN activity in galaxy pairs. In fact, Sortchi-Bergmann et al. (2001) found a correlation between active galactic nucleus and star formation activity in interacting galaxies by analyzing 35 Seyfert 2 nuclei. The galaxy spectral information available in large surveys provides unique information and high statistical numbers to study on more robust basis the relation between these processes. In this paper, we combine the galaxy pair sample constructed by Alonso et al. (2006) from the Sloan Digital Sky Survey (SDSS-DR4) with a sample of narrow-line AGN selected by Kauffmann et al (2003, hereafter K03) from the SDSS-DR4, which is hitherto the largest sample of AGNs.
In section 2, we briefly describe the AGN and pair catalogs. Section 3 analyses the properties of hosts of Type-2 AGN galaxies. Section 4 provides a comparative statistical analysis of AGN hosts in pairs and without companions with the aim of unveiling the role of interactions in triggering AGN activity. In section 5 we give our main conclusions and discussion of the results.
2 SDSS-DR4 data
The SDSS (York et al. 2000) in five optical bands will map one-quarter of the entire sky and perform a redshift survey of galaxies, quasars and stars. The fourth data release, DR4, is the major catalogue which provides images, spectra, and redshifts for download. The imaging portion comprises 6670 square degrees of sky imaged in five wave-bands (, , , and ) containing photometric parameters of 180 million unique objects. The main galaxy sample is essentially a magnitude limited spectroscopic sample (Petrosian magnitude) , most of galaxies span a redshift range with a mean redshift at (Strauss et al. 2002).
The SDSS-DR4 has more than 500000 galaxy spectra and includes different galaxy properties such as magnitudes, star formation indicator, concentration index parameters, etc. From SDSS-DR4, K03 have constructed a catalogue with a subset of 88178 narrow emission line galaxies that are classified as AGN, within redshift range 0.02 0.3.
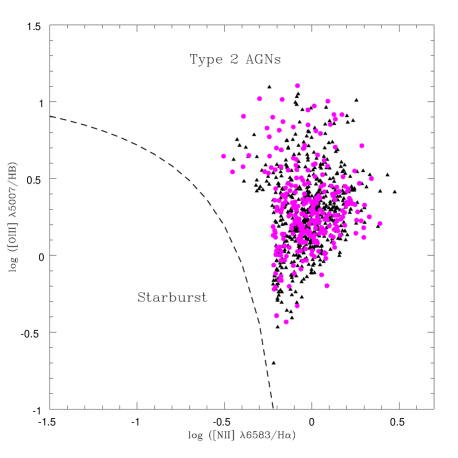
Considering the unified model (Antonucci 1993), AGNs can be separated into two categories: Type 1 AGN where the black hole and the associated continuum and broad emission-line region is viewed directly and Type 2 AGNs where only the narrow line region can be observed due to the obscuring medium. The Baldwin, Phillips & Terlevich (BPT, 1981) line-ratio diagram allow us to distinguish type 2 AGNs from normal star forming galaxies by considering the intensity ratios of two pairs of relatively strong emission lines. The sample of Type 2 AGN of K03 was selected taking into account the relation between spectral lines, , , and luminosities where an AGN is defined if
| (1) |
We then use Type 2 AGNs in K03 catalog. The luminosity of emission line will be used as a tracer of AGN activity.
2.1 SSDS-DR4 galaxy pair catalog
In our previous works (Lambas et al., 2003; Alonso et al. 2004; 2006), we selected galaxies in pairs adopting projected relative distance and relative velocity thresholds: kpc and km . We found that these limits are adequate to define galaxy pairs with enhanced star formation activity. In these works we also detected a clear correlation between star formation activity and the proximity to a close neighbour supporting the physical scenario where tidal torques generated during the interactions trigger gas inflows, feeding the star formation activity.
For the purpose of analysing the effects of close interactions, which are known to produce the strongest effects, we selected close pair galaxies by requiring kpc and km . With this further restriction to closer relative separations, the effects of interactions are largely increased as shown by Lambas et al. (2003). Galaxy pairs are only selected within a redshift range in order to avoid strong incompleteness at larger distances as well as significant contributions from peculiar velocities at low redshift. The final pair catalog in the SDSS-DR4 comprises 1607 close galaxy pairs. Following the procedure explained by Lambas et al. (2003), we constructed a control sample by selecting those galaxies without a close companion within kpc and km . The control sample is also required to have the same redshift and magnitude distribution as our close galaxy pair catalog.
As discussed in Alonso et al. (2006), the effects of incompleteness or aperture (e.g see also Balogh et al.2004ab) do not introduce important bias in the galaxy pair catalogs. Regarding incompleteness, by combining the spectroscopic and photometric surveys, Alonso et al. (2006) estimated that the spectroscopic catalog has only an incompleteness of 9.5. Hence, neither effect is expected to have a strong impact in our close galaxy pair catalog.
3 The Hosts of Type 2 AGNs in Galaxy Pairs
As a first step, we identify AGN hosts in our close pair catalog (i.e. pairs with kpc and km ) by cross-correlating it with the AGN catalog. We found 498 galaxy pairs with one member exhibiting AGN activity. This represent 30 of the total close pair catalogue. We also detected that 108 close pairs have both members classified as AGNs ( 7). Then, the final SDSS-DR4 AGN-pair catalog comprises 606 pairs.
For the purpose of properly assessing the significance of the results obtained from AGN galaxies in pairs, we defined a sample of isolated AGN galaxies from the SDSS-DR4 by selecting those galaxies without a companion galaxy within kpc and km , within the same redshift range of the AGN close pair catalog. The procedure followed to construct the sample of isolated AGN galaxies, assures that it will have the same selection effects than AGN galaxy pair sample, and consequently, it can be used to estimate the actual difference between AGN galaxies in pairs and isolated AGNs, unveiling the effect of the interactions. A similar reasoning motivated the definition of a non-AGN galaxy sample with the same luminosity distribution than galaxies in the AGN-pair catalog.
The distribution of absolute magnitude in r-band () and the stellar mass (), of AGNs in pairs, isolated AGNs, and a control sample of non-AGN galaxies with a similar luminosity distribution than the hosts of AGNs are shown in Fig.1. It can be seen that the luminosity distribution is similar in the three samples, but the fraction of large stellar mass objects among AGN hosts is larger than that of non-AGN hosts: the percentage of galaxies with is for AGNs in pairs, for isolated AGNs and for non-AGN hosts. In fact, there are very few AGNs in galaxies with . As it is well know, the majority of low mass galaxies have young stellar population and a significant fraction are currently experiencing strong star formation activity.
In Fig.1, we plot the () distributions for the same samples. As it can be appreciated from this figure colour distribution of the control sample of non-AGN galaxies is clearly bimodal as expected (e.g. Baldry et al. 2003). However AGNs, regardless of being in pairs or in isolation, have () colours consistent with a red host population. Fig.1 shows the concentration parameter distribution ,, defined as the ratio between the radii enclosing 90 % and 50% of the galaxy light in the Petrosian r-band. Recall that Strateva et al. (2001) found that galaxies with are mostly early-type galaxies, whereas spirals and irregulars have . From the distributions of Fig.1, it can be appreciated that AGNs reside preferentially in bulge dominated galaxies in contrast to the control sample of non-AGN galaxies which show the expected bimodality.
In Fig.2 we show the BPT diagnostic diagram, plotting the ratio versus ratio for AGN pair galaxies and AGNs without a near companion. As it can be appreciated, there is not an evident difference between isolated and AGNs in pairs.
Hence, colours, morphology as measured by , or luminosity, do not provide evidence that interactions could play a role in the triggering or regulation of the AGN activity. AGN hosts show similar distributions regardless of the presence of a close companion. However, taking into account previous results such as those of Strochi-Bergmann et al. (2001), a clear signal of correlation between the AGN activity and interactions could be detected by restricting to active star forming systems. In our previous studies of galaxies in pairs we found that there is an important fraction of galaxies that, although being close in projected space, do not exhibit strong star formation activity. It is very unlikely that at these close projected distances ( kpc and km ) pairs could be strongly affected by interlopers (Alonso et al. 2004; Perez et a. 2005). However, it is possible that, owing to particular characteristics of the orbital parameters or internal structure, these pairs do not experience strong tidal torques that can drive gas inflows. Motivated by these facts, in the next Section we discuss a new classification for close galaxy pairs based on a visual morphological analysis of their members.

3.1 Classification of pair galaxies
By using the photometric SDSS-DR4, we classified all galaxies in the close pair catalogue taking into account the eye-ball detection of features characteristics of interactions. Three categories have been defined:
-
•
Pairs with evidence of an ongoing merging process (: merging pairs)
-
•
Pairs with signs of tidal interactions but not necessarily merging (:tidal pairs)
-
•
Pairs showing no evidence of distorted morphologies (: non-interacting pairs).
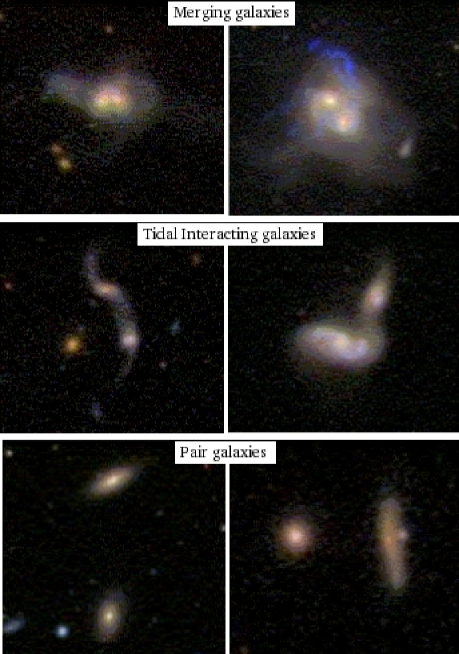
Fig.3 shows images of typical examples of close pair galaxies for the three different visual classification: , and . Hereafter we will carry out the analysis by distinguishing them according to these categories. Note that although the category referes to systems in advance stages of interactions, the two systems could be still individualized by the SDSS survey.
| Categories | Total Pairs | Total Control | |||
|---|---|---|---|---|---|
| Number of close pairs | 1607 | 383 | 688 | 536 | 14359 |
| of AGNs | 32% | 31 | 32 | 28 | 23% |
3.1.1 Analysis of deblending for Merging Pair Galaxies
In order to analyse the effects of how reliable SDSS photometric deblending procedure works in merging galaxy pairs () for which we expect the largest uncertainties, we have carried out suitable tests to determine independent magnitudes for this sample.
For this purpose we have studied directly galaxy images extracted from SDSS and we have used SExtractor routines to derive galaxy magnitudes. We have used first, a set of isolated galaxies which serve as a control sample for testing the photometry. For this sample, our photometry gives r-band magnitudes with 0.02 rms difference compared to those quoted in SDSS, indicating the consistency of our results with SDSS magnitudes when no deblending procedure is required. The second sample is composed of 50 merging galaxy pairs () extracted at random from our total sample of 383 m-pairs (with typical projected separation 12 kpc ). We calculated the total magnitude of the pair which acording to our previous analysis should be within 0.02 magnitudes compared to SDSS measurements in the case that deblending is accurately working. We find, however, that the deblending procedure in SDSS introduces a larger uncertainty since by adding the quoted luminosities in SDSS, the typical difference raises to 0.12 rms. In Fig.4 we show r-band magnitud derived from SExtractor routines versus r-band magnitud extracted from SDSS, for a sample of isolated galaxies and for a subsample of 50 merging pairs. This simple and robust test gives useful estimates of the uncertainties introduced by the deblending procedure adopted in SDSS which we argue are about 0.12 mag. We also notice the lack of systematics in SDSS deblending procedures, since the difference between our Sextractor measurements and quoted SDSS magnitudes have an approximately zero mean.
In sum, this analysis indicates that SDSS magnitudes can be suitably used in our analysis in the following sections provided a rms scatter of 0.12 magnitudes is not seriously affecting the results.

3.1.2 Frequency of AGNs
For the three categories defined above, we calculate the percentage of pairs with AGNs. As we can notice from Table 1, we found that 30 of close galaxy pairs host AGNs, regardless of the category they belong to, and that isolated galaxies without companions have a lower AGN frequency ().
Since AGN phenomenon is a strong function of host luminosity, we analysed the fraction of AGNs in each of the pair categories and in the control sample, for different stellar mass content and luminosity intervals. In Fig.5, we display the fraction of AGNs as a function of r-band luminosity and stellar mass The results indicate that the fraction of host with AGN activity increases with luminosity in a similar fashion for AGNs in pairs or in isolation. However, we notice that, at a given mean luminosity or mean stellar mass, merging pairs tend to have a higher frequency of AGNs than pairs in the two other categories or in the control sample. Nevertheless, this excess is approximately .

3.1.3 Stellar population ages in AGN hosts
The strongest discontinuity occurring at 4000 in the optical spectrum of a galaxy arises of the accumulation of a large number of spectral lines in a narrow wavelength region where the main contribution to the opacity comes from ionized metals. The break index (Kauffmann et al. 2002) is defined as the ratio of the average flux density by using narrow continuum bands (3850-3950 and 4000-4100 ). The indicator is suitably correlated to the mean age of the stellar population in a galaxy and can be used to estimate the star formation rate per unit stellar mass, , (Brinchmann et al. 2004). The majority of star formation takes place preferentially in galaxies with low values, for instance, only and of the total SFR density are associated to galaxies with and respectively.
We have analysed the behaviour of this parameter as a function of stellar mass and luminosity for AGNs in pairs and in isolation. The results are given in Fig.6 where it can be seen that AGNs in merging pairs have significantly lower values of . This finding suggests that these galaxies have experienced more recent episodes of star formation as expected since they are effectively in an ongoing merger event.
The trends shown in Fig.5 and Fig.6 support the scenario where interactions could drive both star formation and AGN activity via the triggering of gas inflows to the central region. The fact that we are actually detecting the strongest signal for merging pairs could be indicating that fusions could be more efficient than tidal torques produced during the orbital decay to feed both AGN and star formation activity.

4 Properties of AGNs in interacting Galaxies: O[III] Luminosity and Black Hole Mass
As a tracer of the AGN activity, we focus here on the luminosity of the [OIII]5007 line, calculated by Kauffmann et al. (2003) in SDSS-DR4 AGN galaxies. Although this line can be excited by massive stars as well as by AGNs, it is known to be relatively weak in metal-rich, star-forming galaxies. The [OIII] line also has the advantage of being strong and easily detected in most galaxies. It should be noticed that the narrow-line emission is likely to be affected by dust within the host galaxy (Kauffmann 2003). Thus it is important to correct the L[OIII] luminosities for the effects of extinction. For AGNs in SDSS, Kauffmann et al. (2003) measured the extinction using the Balmer decrement finding that the best approximation for a dust correction to L[OIII] is based on the ratio H/H. We will considered the luminosity as a limit between weak and powerful AGNs. A weak L[OIII] emission indicates that the black hole is not rapidly growing (Heckman et al. 2004).
We estimated black holes masses, , for both AGNs with and without companion, by using the observed correlation between and the bulge velocity dispersion (Tremaine et al. 2002)
| (2) |
We restrict this analysis to AGN galaxies with 70 km , corresponding to log 6.3, because the instrumental resolution of SDSS spectra is 60 to 70 km . The aperture corrections to the stellar velocity dispersions are small in early-type galaxies in SDSS (Bernardi et al. 2003), so we do not apply such corrections.
In Fig.7a, we show the distribution of for AGNs in galaxies in merging pairs, tidal-pairs, non-interacting pairs and without a close companions. As it can be clearly appreciated, AGNs in pairs with evidence of ongoing merging processes () show larger luminosities than AGNs in isolation or in the other two pair categories. In fact, while of AGNs in merging pairs have , only of isolated AGNs show such a powerful activity. Note that the other two pair categories have AGN luminosity distributions similar to that of isolated AGNs.
In Fig.7b , we show the distribution of black holes masses, , for AGNs grouped similarly to Fig.7a. It can be appreciated in this figure that although there is a trend for to be systematically larger for AGNs in merging pairs, the difference is not as significant as the signal detected for , being only of less than 0.15 dex.
It is interesting to further investigate the strength of AGNs as a function of host luminosity and stellar mass. Therefore, we calculated the mean as a function of r-band luminosity and stellar mass content of the corresponding host galaxies. These relations have been estimated for AGNs in the three pair categories (, , ) and for isolated AGNs. From the results shown in Fig.8a, it can be clearly appreciated that, in general, most luminous hosts show the highest . We can also see that AGNs in merging pairs show higher , regardless of the luminosity and stellar mass of the host galaxy, indicating that the black hole activity is stronger for AGNs in advance stages of interactions. In fact, for host galaxies with , the mean of merging pairs is larger by half an order of magnitude than the mean of the rest of the samples. A similar estimation for confirms the trend found in Fig.7b. Black hole masses are slightly larger for AGNs in merging pairs than for the rest of the categories.
The ratio of [OIII] luminosity to black hole mass ( = log(/)) provides a useful measure of the accretion rate onto a black hole (Heckman et al. 2004). In our calculations we have not converted the to volume-averaged luminosities but by using the relations displayed in Fig. 2 of Heckman et al. (2004) it is possible to infer an accretion time for AGNs in pairs. In Fig.9 we show as a function of host luminosity (a), stellar mass (b) and BH mass (c), for AGNs in the three defined pair categories (, , ) and in isolated hosts. In agreement with the previous results, we found that black holes in smaller or fainter systems are more active than black holes in larger or brighter systems. Heckman et al. (2004) concludes that the most rapidly growing black holes are those with with an implied growth time twice the age of the universe. From Fig.9c we can appreciate that have significantly higher accretion rates than larger ones.
The relations shown in Fig.9 indicate that, although in general the smallest black holes are the ones that exhibit the highest rates of accretion, AGNs in merging pairs host the most rapidly growing black holes. In fact, AGNs in merging pairs have the most powerful black holes and the ones that are growing faster, besides hosting stellar populations which show clear signal of being importantely rejuvenated by recent starbursts.
Finally, we have also investigated the role played by the AGN companion in powering the AGN activity. This was accomplished by calculating, for each AGN in pairs, the OIII luminosity and / as a function of its r-band luminosity and stellar mass content, considering separately pairs with a bright and a faint companion. For that purpose, we adopted as the magnitude threshold. The results shown in Fig.10 clearly indicate that AGN activity in hosts with bright companions is significantly enhanced with respect to that of AGNs with faint companions, being both the AGN power and accretion rate significantly larger. This finding provides evidences that nuclear activity is not only affected by the presence of a very close companion but that the relative mass (or luminosity) is also an important issue to take into account.


5 Summary and Conclusions
We have performed a statistical analysis of both, host characteristics and nuclear activity, of AGNs in pairs and without close companions. Our study is based on the sample of AGNs derived from the SDSS-DR4 release by Kauffmann et al. (2003) and the pair galaxies obtained from the same data release. We have complemented the SDSS-DR4 data with the addition of a eye-ball classification of images of 1607 close pairs (25 kpc , 350 km ) according to the evidence of interaction through distorted morphologies and tidal features. Also, we have performed a photometric analysis to assess the reliability of the SDSS magnitude deblending procedure in merging pairs, finding negligible systematic effects.
Our main results are:
1- The fraction of AGNs as a function of r-band luminosity or stellar mass is larger for merging pairs. However, this is a relative small effect accounting for an increase of less due to tidal interactions.
2- AGN hosts are redder and with a larger concentration morphological index than non-AGN galaxies. This effect is similar for AGN hosts in pairs or in isolation.
3- We find that the locus of AGNs with and without close companions in the BPT diagram are consistent with each other.
4- At a given host r-band luminosity or stellar mass, we find the AGN OIII luminosity to be enhanced for AGNs with strong interaction features (i.e. merging pairs). We found that while of AGNs in merging pairs have this percentage decreases to in the case of isolated AGNs.
5- Estimations of the mean accretion rates onto the black holes of AGNs in pairs in the three defined categories and in isolation indicate that AGNs in merging pairs have more active black holes than other AGNs, at a given r-band luminosity or stellar mass content. We estimated than of AGNs in merging pairs have and and can be considered as being feeding their black holes with high efficiency (Heckmann et al. 2003). In the case of isolated AGNs (selected to have the same , this percentage decreases to . On the other hand, all AGNs in merging pairs have which indicates that they also have active star formation formation. Interestingly we also found that of isolated AGNs have powerful emission, and have also experienced important star formation activity in recent past with . These trends open the possibility that isolated AGNs with active black holes have experienced a recent merger. It is also possible that secular evolution could be responsible of feeding the black hole and the star formation activity if a gaseous disk is present. More detail data are needed to draw a conclusion on this point.
6- We find that the luminosity (or mass in stars) of the companion galaxy is a key parameter to determine the activity of the black hole. Both the OIII luminosity and the accretion rates for AGNs with bright close companions are significantly larger than for those of AGNs with faint neighbours.
Acknowledgements
We thank Guinevere Kauffmann for useful comments.
This work was partially supported by the European Union’s ALFA-II program, through LENAC, the Latin American European Network for Astrophysics and Cosmology and Conicet from Argentina.
Funding for the creation and distribution of the SDSS Archive has been provided by the Alfred P. Sloan Foundation, the Participating Institutions, the National Aeronautics and Space Administration, the National Science Foundation, the U.S. Department of Energy, the Japanese Monbukagakusho, and the Max Planck Society. The SDSS Web site is http://www.sdss.org/.
The SDSS is managed by the Astrophysical Research Consortium (ARC) for the Participating Institutions. The Participating Institutions are The University of Chicago, Fermilab, the Institute for Advanced Study, the Japan Participation Group, The Johns Hopkins University, the Korean Scientist Group, Los Alamos National Laboratory, the Max-Planck-Institute for Astronomy (MPIA), the Max-Planck-Institute for Astrophysics (MPA), New Mexico State University, University of Pittsburgh, University of Portsmouth, Princeton University, the United States Naval Observatory, and the University of Washington.
References
- [1] Alonso, M.S., Tissera, P.B., Coldwell, G. & Lambas, D.G., 2004, MNRAS, 352, 1088.
- [2] Alonso, M.S., Lambas, D.G., Tissera, P.B. & Coldwell, G., 2006, MNRAS, 367, 1029.
- [3] Antonucci, R., 1993, ARA&A, 31, 473.
- [4] Baldry, I. K.; Glazebrook, K.; Brinkmann, J.; Ivezic, Z.; Lupton, R. H.; Nichol, R. C.; Szalay, A. S., 2004, ApJ, 600, 681.
- [5] Baldwin, J. A., Phillips, M. M. & Terlevich, R., 1981, PASP, 93, 5.
- [6] Balogh M., Baldry I. K., Nichol R., Miller C., Bower R., Glazebrook K., 2004, ApJ Letters, 615, 101.
- [7] Balogh M., et al., 2004, MNRAS 348, 1355.
- [8] Barnes, J. E. & Hernquist, L., 1992, ARA&A, 30, 705.
- [9] Barnes, J. E. & Hernquist, L., 1996, ApJ, 471, 115.
- [10] Barrow, J. D., Bhavsar, S. P., & Sonoda, B. H., 1984, MNRAS, 210, 19p.
- [11] Begelman, M. C., Blandford, R. D., & Rees, M. J., 1980, Nature, 287, 307.
- [12] Bernardi, M. et al. , 2003, AJ, 125, 1817.
- [13] Brinchmann, J., Charlot, S., White, S. D. M., Tremonti, C., Kauffmann, G., Heckman, T. & Brinckmann, J., MNRAS, 2004, 351, 1151.
- [14] Coldwell, G. V. & Lambas, D. G., 2006, MNRAS, in press.
- [15] Gunn, J. E., 1979, in Active Galactic Nuclei, ed. C. Hazard & S. Milton (Cambridge: Cambridge Univ. Press), 213.
- [16] Dahari, O., 1985, ApJS, 57, 643.
- [17] Fuentes-Williams, T. & Stocke, J.T., 1988, AJ, 96, 1235.
- [18] Heckman, T. M.; Kauffmann, G.; Brinchmann, J.; Charlot, S.; Tremonti, C.; White, S. D. M., 2004, ApJ, 613, 109.
- [19] Kauffmann, G., et al. , 2003, MNRAS, 341, 33.
- [20] Kauffmann, G., et al. , 2003, MNRAS, 346, 1055.
- [21] Keel, W. C. 1996, AJ, 111, 696.
- [22] Kelm, B., Focardi, P. & Zitelli, V., 2004, A&A, 418. 25.
- [23] Lambas, D.G., Tissera, P.B., Alonso, M.S. & Coldwell, G., 2003, MNRAS, 346, 1189.
- [24] Martinet, L., 1995, FCPh, 15, 341.
- [25] Mihos J. C. & Hernquist L., 1996, ApJ, 464, 641.
- [Perez] Pérez M. J., Tissera P., Lambas D. G., Scannapieco C., 2006, A&A, 449, 23.
- [26] Sanders, D.B., Soifer, B.T., Elias, J.H., Madore, B.F., Matthews, K., Neugebauer, G. & Scoville, N., 1988, ApJ, 325, 74.
- [27] Schmitt, H. R., 2001, AJ, 122, 2243.
- [28] Schwartz, M. P., 1981, ApJ, 247,77.
- [29] Shlosman, I., Begelman, M. C. & Frank, J., 1990, Nature, 345, 679.
- [30] Storchi-Bergmann, T.; González Delgado, R. M.; Schmitt, H. R.; Cid Fernandes, R.; Heckman, T., 2001, ApJ, 559, 147.
- [31] Strateva, I. et al. , 2001, AJ, 122, 1861.
- [32] Strauss, M. et al. , 2002, AJ, 124, 1810.
- [33] Toomre, A. & Toomre, J., 1972, AJ, 178, 623.
- [34] Tremaine, S. et al. , 2002, ApJ, 574, 740.
- [35] York D. O. et al., 2000, ApJ, 120, 1579.