The stellar population of bulges
Abstract
This review summarizes the properties of the stellar population in bulges as observed in nearby or distant spiral galaxies. It gives a particular emphasis to the comparison with elliptical galaxies, when possible. The criteria of sample selection and choices in data analysis are addressed when they may be involved in discrepant results reached by different studies.
1 Introduction

Studying bulges of spirals is not restrictive to a particular class of galaxies, or even further to their central regions. There is a growing body of evidence that it is crucial to understanding galaxy formation in general. Indeed the light distribution of most large galaxies is dominated by two components, a bulge and a disk. Even very early-type galaxies harbor a variety of luminosity profiles, which are interpreted as due to a varying contribution of a disk component (Saglia et al. 1997; de Jong et al. 2004). Along the Hubble sequence, the variation in bulge magnitude is twice the amount of the disk (Simien & de Vaucouleurs, 1986; de Jong, 1996), i.e., the properties of bulges are keys to inferring the nature of the Hubble sequence.
Despite the prospect of yielding crucial information on galaxy formation and galactic assembly history, bulges have received significantly less attention than elliptical galaxies. This is a direct consequence of the considerable challenge of avoiding disk light contamination. Figure 1 illustrates this point. Galaxies, nearby and face-on, are from Jablonka, Arimoto & Martin (1996). It appears clearly that within a fixed aperture, classically of the order R 1-2 arcsec for integrated spectroscopy, it is nearly impossible to get totally rid of the disk light. Even more importantly, one can get very different bulge-to-disk light ratios, from one galaxy to the other, prejudicing our understanding of trends with physical quantities.
Nevertheless, observational efforts intensify, improving our vision of bulges’ properties. Although no definitive certainties have emerged yet, new lines of research are now underway.
2 Metallicity distribution
It will be a long time before it is possible to get spectra of individual stars in our closest spiral neighbor, M31. Jablonka et al. (2000) using the MCS deconvolution technique counted 40 bright RGB stars per arcsec2 at 1 to 1.5 kpc from the galaxy center. Therefore, attempts to derive a metallicity distribution function (MDF) in the bulge of M31 have to be based on high spatial resolution images and analyzed with isochrones. At the moment, there are two studies addressing this issue, one in the optical (Sarajedini & Jablonka, 2005), and the other in the infrared (Olsen et al., 2006), both based on HST data. Sarajedini & Jablonka analyze a field located at about 1.5 kpc from the nucleus of M31 in V and I bands. The MDF that they derive is presented in Figure 2 and compared with the metallicity distribution of the bulge of the Milky Way from Zoccali et al. (2003). Within 0.1-0.2 dex, the range of metallicity covered by the two galaxy bulges is the same, and so are the peaks of the distributions. Had bulges straightforwardly reflected the differences between the halos of the two galaxies, one would have expected a differential shift of at least 1 dex between their MDFs (Ryan & Norris, 1991 ; Durrell Harris & Pritchet, 2001). On the contrary, it seems that the bulge of M31 does not know about the metal-richness of its halo. Besides, the M31 bulge MDF shows a total absence of metal-poor stars, just like does the Milky Way bulge. This is a secure result, as the lowest metallicities identified (1.5 dex) are well away from the grey zone of the very low metallicities where isochrones are degenerated in colors.
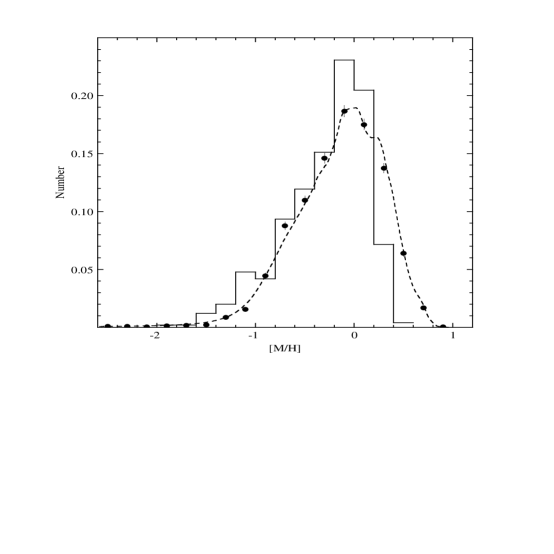
Contrary to Sarajedini & Jablonka, Olsen et al (2006) leave the age of the stellar population as a free parameter in their analysis. Also, instead of trying to reproduce the complete color-magnitude diagrams, they fit model stellar populations to the K luminosity functions of their fields, using a maximum likelihood method. They find the stellar population mix of their 12 fields to be dominated by old (defined as having ages 6 Gyr), nearly solar-metallicity stars. This old population seems to dominate the star formation history at all radii, independent of the relative contributions of bulge and disk stars. In their Figure 19, Olsen et al. show the population integrated over all their fields. Neglecting the possibly spurious intermediate-age metal-poor component, possibly due to crowding, they measure a metallicity distribution function that is a bit more sharply peaked than that of Sarajedini & Jablonka, but still in excellent qualitative agreement.
Assembling these observational facts suggest that the first stars in bulges formed from an already pre-enriched gas. It remains unclear whether this is resulting from the halo first stellar generations or is due to the location of the observed fields. Indeed, as we will see later, bulges do exhibit radial gradients in metallicity and one might not have yet probed the outermost regions of the M31 and Milky Way bulges. In any case, the bulk of the bulge formation must have taken place before the mergers, whose traces are witnessed today (Ferguson et al., 2002; Ibata et al., 1994 ; Yanny et al., 2003), could influence the bulge evolution. Otherwise, the large difference between the M31 and Milky Way halos should have been reflected in the properties of their bulges.
3 Scaling relations - central indices
With the exception of the Milky Way and M31, in which we can resolve individual stars, studies of bulges have to deal with integrated properties.
Spectroscopic studies of the central parts of bulges were pioneered by Bica (1988). He gave the first evidence for a relative independence of the bulge spectral properties with respect to the morphological type of the parent galaxies. He also showed that changes in age/metallicity were linked to the galaxy luminosity. The following years, a central metallicity-luminosity () relation for bulges was more firmly established and studies stressed its similarity with the relation derived for ellipticals (Jablonka, Martin & Arimoto, 1996; Idiart, de Freitas Pacheco & Costa, 1996). This similarity appears both in the slope of the relation and in similar [/Fe] ratios. Interestingly, both the above studies observed face-on spirals and varied their integration apertures, either by adapting their spectroscopic apertures at the time of the observations, fixing a low and constant bulge-to-disk light ratio for all galaxies, or by inspecting the light profiles along the slit width when extracting the spectra.
Subsequent works sampled inclined galaxies and advocate distinctions between late-type and early-type spiral bulges. Prugniel, Maubon & Simien (2001) bulges are located below the Mg2- relation obtained for ellipticals. Falcón-Barroso, Peletier & Balcells (2002) find a steeper slope than for ellipticals and S0 galaxies by 20%. Proctor & Sansom (2002) report that small bulges (low ) depart from the relation between spectral indices and drawn by large bulges: While large bulges populate the same region as elliptical galaxies, the smaller ones have relatively lower spectral indices. However, Thomas & Davies (2006), reanalyzing Proctor and Sansom’s sample, point out that this apparent discrepancy vanishes when the same range of central velocity dispersion is considered for both types of systems, i.e., when low bulges are compared to low ellipticals.
Figure 4 in Falcón-Barroso, Peletier & Balcells (2002) could serve as a warning : the dispersion between the different studies is rather large, likely due to the various observational strategies. In particular, it is of the order of the difference claimed between different types of bulges and with elliptical galaxies. Nevertheless, there are true points of convergence among the studies quoted here which can be summarized as such: there is a range of properties of the bulge stellar populations as sampled by their inner regions. They are related to the bulge mass or maybe even more to the total gravitational potential of the parent galaxy. Indeed, Prugniel, Maubon & Simien (2001) and more recently Moorthy & Holtzman (2006) find a tighter relation between Mg2 and the galaxy rotation velocity than with the central bulge velocity dispersion, for example. The bulge central luminosity weighted metallicities range from to 0.5 dex and the luminosity weighted [/Fe] from the solar value to 0.4 dex. Ages are more subject to debate, but a broad consensus would certainly be reached for a range between very old stellar population to a few giga years younger.
4 Spatial distribution
We would dramatically limit our understanding of bulges if one would circumscribe the analyses to their central regions. Substantial progress is enabled with spatially resolved spectroscopy, so that radial gradients of stellar population can be measured. Investigations of such radial gradients using large surveys have until recently only been addressed in early-type galaxies i.e., elliptical and lenticular galaxies, with only very modest and rare excursions into the case of later type galaxies (e.g., Sansom, Peace & Dodd, 1994 ; Proctor, Sansom & Reid , 2000 ; Ganda et al., 2006).
Recently, Moorthy & Holtzman (2006) published a large study of 38 bulges, composed for about half the sample of nearly face-on spirals and for the other half of highly inclined ones. Most of their bulges show a steady decrease in metallicity sensitive indices with radius and positive increase in [/Fe], with the exception that their small bulges have generally weak or no gradients, sometimes positive ones. While age gradients are generally absent in their sample galaxies, some exhibit positive ones, the majority in barred spirals. Very interestingly, they find a correlation between line strength gradients in the bulge and in the disk.
Most of these qualitative results are confirmed by Jablonka, Gorgas & Goudfrooij (2007) who chose a different strategy. In order to get totally rid of the disk population, they selected 32 genuine (or close to) edge-on spiral galaxies with Hubble types from S0 to Sc. They obtained spectra along the bulge minor axes, out to the bulge effective radius and often much beyond. Most of their bulges do present radial stellar population gradients. The outer parts of bulges do show weaker metallic absorption lines than the inner regions. The distribution of the gradient amplitudes are generally well peaked, but they also display a real intrinsic dispersion, implying the presence of a variety of star formation histories.
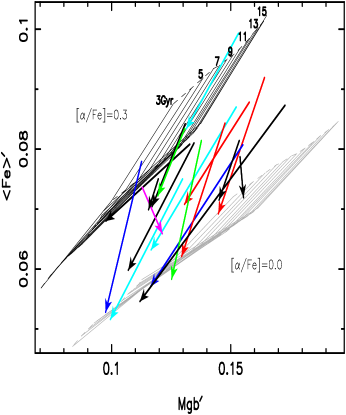
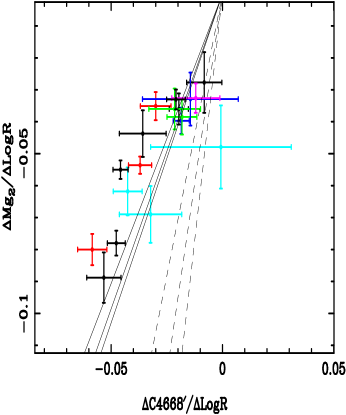
The left panel of Figure 3 illustrates the decrease in [/Fe], from the bulge effective radii to their central regions, for galaxies exhibiting clear gradients. The colors code different Hubble types. Alike the case of the central spectral properties, the morphology of the parent galaxy is not a driving parameter of the gradient amplitudes. The right panel of Figure 3 shows the models of pure metallicity (plain lines) and pure age variation (dotted lines) from Thomas, Maraston & Bender (2003). Bulges populate the region close to the pure metallicity lines, leaving some room, but on a much smaller magnitude for [/Fe] and age variations. A quantitative analysis indicates that radial gradients in luminosity-weighted mean metallicity are twice larger (in logarithmic scale) than the gradients in age. While [Fe/H] at the bulge effective radii is on average 0.4 dex lower than in the bulge central regions, the age difference is of the order of 1.5 Gyr, the inner regions being younger. The changes in [/Fe] are small (of the order of 0.1 dex) and rather constant among bulges. These various points indicate that the outer regions of bulges reveal their earliest stages of star formation. Interestingly, the sensitivity of the gradients to the central velocity dispersion is very different from what is reported for the bulge central indices. Literally, there is no correlation between the gradient amplitude and the bulge central velocity dispersion. Instead, one sees that bulges with large velocity dispersions can exhibit both strong or negligible gradients. The probability to get strong gradient diminishes at lower velocities until it gets null. The same had been observed for elliptical galaxies. This gradual build-up of the index vs. relation can only be clearly observed for indices with large dynamical range, such as Mg2 or Mg1.
5 High redshift
There are still very few studies focusing on bulges at high redshift, and only one is addressing the comparison between bulges in field and cluster environments.
Ellis, Abraham & Dickinson (2001) analyze a sample of early-type and spiral galaxies from the northern and southern Hubble Deep Fields. They compare the central (inner 5%) colors of spirals with clearly visible bulges with the integrated colors of ellipticals in their sample up to a redshift of 1. They find that both ellipticals and bulges show a dispersion in their colors at a given redshift, but that their distributions are different : a smaller fraction of ellipticals is blue. It seems that there is an almost total absence of bulges as red as those predicted by a passive evolution, while this scenario provides on the contrary a good description for the majority of the early-type population. The authors conclude that the optical luminosity weighted ages of bulges, to at least a redshift of 0.6, are younger than those of the reddest ellipticals. At even higher redshifts some bulges are found to be as red as ellipticals though, suggesting that some kind of rejuvenation is at play at intermediate redshift.
Koo et al. (2005a) present a sample of ellipticals and bulges from the DEEP Groth Strip Survey with redshift between 0.7 and 1. This time, the images are decomposed into bulge and disk components by fitting a de Vaucouleurs light profile for the former and an exponential one for the latter. They find that red bulges (85% of them) are nearly as red or redder than the integrated color of either local early-type or distant cluster galaxies. The color-magnitude relations have similar shallow slope and small scatter. Blue bulges are among the least luminous ones, and are of similarly low surface brightness as local bulges of similar size. The authors consider that they cannot be genuine proto-bulges and are instead mostly residing in morphologically peculiar galaxies. Interestingly, in most red objects, they detect emission lines indicative of a continuous star formation, although at low level.
As stated by Koo et al. themselves, the fact that Ellis et al.’s sample encompasses faint bulges, while their sample is restricted to luminous ones, together with the very different way of deriving the bulge colors might be at the origin of the contradictory results between the two works.
Koo et al. (2005b) present the analysis of luminous bulge (MB 19.5) in a cluster and in the field at redshift 0.8. They demonstrate that the rest-frame colors, slope and dispersion of the color-magnitude of cluster and field bulges are nearly the same. This also means no larger than in samples at lower redshift. This is in sharp contrast with some theoretical expectation for an increasing fraction of recent star formation with redshift and/or longer time scale of formation in the field as compared to clusters. However, here again the consequence of the selection of luminous bulges must be investigated.
6 Conclusion
This review definitely concentrated on the observational properties of bulges. These were determined with increasing accuracy by an ever-growing number of bulge studies. Here we reviewed three major areas of bulge characterization: exploring resolved stellar populations, line indices from integrated spectra, and direct lookback studies of bulge colors at redshifts out to 1. Despite these diverse approaches, however, there is still a large number of viable models for bulge formation, e.g. gradual accretion of disk material through the action of the bars, gravitational collapse (or nearly equivalently, early and fast mergers), the accretion of dwarf systems in the center of disks, etc. These models are not mutually exclusive and in reality bulge growth may combine some of these modes. The lack of agreement in the conclusions between some analyses mentioned here serves to guide us towards questions that remain open. Among those: at which point in their history do the disks influence their central bulges ? If they do, then in which proportion? Could this influence become dominant in small systems ? Do we have/use the appropriate comparison samples of elliptical galaxies ? Which gravitation potential governs most closely the formation of bulges: theirs or the total galaxy one ?
References
- [Bica(1988)] Bica, E. 1988, A&A, 195, 76
- [Durrell et al.(2001)] Durrell, P. R., Harris, W. E., & Pritchet, C. J. 2001, AJ, 121, 2557
- [Ellis et al.(2001)] Ellis, R. S., Abraham, R. G., & Dickinson, M. 2001, ApJ, 551, 111
- [Ferguson et al.(2002)] Ferguson, A. M. N., Irwin, M. J., Ibata, R. A., Lewis, G. F., & Tanvir, N. R. 2002, AJ, 124, 1452
- [Falcón-Barroso et al.(2002)] Falcón-Barroso, J., Peletier, R. F., & Balcells, M. 2002, MNRAS, 335, 741
- [Ganda et al.(2006)] Ganda, K., Falcón-Barroso, J., Peletier, R. F., Cappellari, M., Emsellem, E., McDermid, R. M., de Zeeuw, P. T., & Carollo, C. M. 2006, MNRAS, 367, 46
- [Ibata et al.(1994)] Ibata, R. A., Gilmore, G., & Irwin, M. J. 1994, Nature, 370, 194
- [Idiart et al.(1996)] Idiart, T. P., de Freitas Pacheco, J. A., & Costa, R. D. D. 1996, AJ, 112, 2541
- [Jablonka et al.(1996)] Jablonka, P., Martin, P., & Arimoto, N. 1996, AJ, 112, 1415
- [Jablonka et al.(2000)] Jablonka, P., Courbin, F., Meylan, G., Sarajedini, A., Bridges, T. J., & Magain, P. 2000, A&A, 359, 131
- [Jablonka (2007)] Jablonka, Gorgas, & Goudfrooij, 2007, submitted to A&A
- [de Jong(1996)] de Jong, R. S. 1996, A&A, 313, 45
- [de Jong et al.(2004)] de Jong, R. S., Simard, L., Davies, R. L., Saglia, R. P., Burstein, D., Colless, M., McMahan, R., & Wegner, G. 2004, MNRAS, 355, 1155
- [Koo et al.(2005)] Koo, D. C., et al. 2005a, ApJS, 157, 175
- [Koo et al.(2005)] Koo, D. C., Datta, S., Willmer, C. N. A., Simard, L., Tran, K.-V., & Im, M. 2005b, ApJL, 634, L5
- [Moorthy & Holtzman(2006)] Moorthy, B. K., & Holtzman, J. A. 2006, MNRAS, 371, 583
- [Olsen et al.(2006)] Olsen, K. A. G., Blum, R. D., Stephens, A. W., Davidge, T. J., Massey, P., Strom, S. E., & Rigaut, F. 2006, AJ, 132, 271
- [Proctor et al.(2000)] Proctor, R. N., Sansom, A. E., & Reid, I. N. 2000, MNRAS, 311, 37
- [Proctor & Sansom(2002)] Proctor, R. N., & Sansom, A. E. 2002, MNRAS, 333, 517
- [Prugniel et al.(2001)] Prugniel, P., Maubon, G., & Simien, F. 2001, A&A, 366, 68
- [Ryan & Norris(1991)] Ryan, S. G., & Norris, J. E. 1991, AJ, 101, 1865
- [Saglia et al.(1997)] Saglia, R. P., Bertschinger, E., Baggley, G., Burstein, D., Colless, M., Davies, R. L., McMahan, R. K., Jr., & Wegner, G. 1997, ApJS, 109, 79
- [Sansom et al.(1994)] Sansom, A. E., Peace, G., & Dodd, M. 1994, MNRAS, 271, 39
- [Sarajedini & Jablonka(2005)] Sarajedini, A., & Jablonka, P. 2005, AJ, 130, 1627
- [Simien & de Vaucouleurs(1986)] Simien, F., & de Vaucouleurs, G. 1986, ApJ, 302, 564
- [Thomas et al.(2003)] Thomas, D., Maraston, C., & Bender, R. 2003, MNRAS, 343, 279
- [Thomas & Davies(2006)] Thomas, D., & Davies, R. L. 2006, MNRAS, 3
- [Yanny et al.(2003)] Yanny, B., et al. 2003, ApJ, 588, 824
- [Zoccali et al.(2003)] Zoccali, M., et al. 2003, A&A, 399, 931