XMM-Newton observations reveal the X-ray counterpart of the very-high-energy -ray source HESS J1640–465
Abstract
We present X-ray observations of the as of yet unidentified very high-energy (VHE) -ray source HESS J1640–465 (catalog ) with the aim of establishing a counterpart of this source in the keV energy range, and identifying the mechanism responsible for the VHE emission. The 21.8 ksec XMM-Newton observation of HESS J1640–465 in September 2005 represents a significant improvement in sensitivity and angular resolution over previous ASCA studies in this region. These new data show a hard-spectrum X-ray emitting object at the centroid of the H.E.S.S. source, within the shell of the radio Supernova Remnant (SNR) G338.3–0.0. This object is consistent with the position and flux previously measured by both ASCA and Swift-XRT but is now shown to be significantly extended. We argue that this object is very likely the counterpart to HESS J1640–465 and that both objects may represent the Pulsar Wind Nebula of an as of yet undiscovered pulsar associated with G338.3–0.0.
1 Introduction
The last years brought an emerging new population of Galactic VHE -ray sources. More than 20 new objects are now established as sources of -rays above 100 GeV by Atmospheric Cherenkov Telescopes such as H.E.S.S. (Hinton, 2004). In particular a first unbiased survey of the Inner Galaxy by H.E.S.S. found more than a dozen new sources (Aharonian et al., 2005a, 2006a). While several Galactic -ray sources can be identified with counterparts at other wavebands, such as RX J1713.7–3946 (catalog ) (Aharonian et al., 2004, 2006b) or MSH–15-52 (catalog ) (Aharonian et al., 2005b), most of them have not yet been identified with a striking positional counterpart (Aharonian et al., 2006a; Funk, 2006). A counterpart search proceeds in several steps: first, a positional counterpart at other wavebands must be established, typically through high-angular resolution observations in the radio and X-ray bands. In these bands non-thermal particle populations can be studied through their synchrotron emission without being strongly absorbed by interstellar dust. Following the detection of an astrometric counterpart, a firm identification requires both a viable -ray emission mechanism and a consistent multi-frequency picture of the positional counterpart. Here we report on X-ray observations on HESS J1640–465 with the X-ray XMM-Newton satellite as part of an ongoing programme to study unidentified VHE -ray sources with X-ray satellites.
HESS J1640–465 was first detected by H.E.S.S. in a survey of the inner Galaxy (Aharonian et al., 2005a, 2006a) in 2004. Following the initial discovery the source was re-observed in pointed observations with a resulting statistical significance of in 14.3 hours of lifetime, with a total of 313 -ray events above the background of events. The -ray emission profile is Gaussian and rather compact in nature with an rms width of , less extended than most of the sources detected in the survey. The -ray energy spectrum was reported to follow a simple power-law with photon index and a total integrated flux above 200 GeV of cm-2 s-1 (corresponding to erg cm-2 s-1). HESS J1640–465 is located in the Galactic plane at an RA-Dec2000 of , (or ). This direction on the sky lines up with the prominent 3-kpc-arm-tangent region of the Galaxy at a distance of 8 kpc.
HESS J1640–465 was found to show compelling positional coincidence with the shell-type Supernova remnant (SNR) G338.3–0.0 (Green, 2004). This broken-shell SNR with a diameter of 8′ was detected in the 843 MHz radio survey using the Molonglo Observatory Synthesis Telescope (MOST) (Green et al., 1999). G338.3–0.0 is located at a RA-Dec2000 position of , and is not particularly well studied by radio telescopes (Green, 2004). A reanalysis of the MOST data (T. Cheung, private communication) yields a total radio emission from the remnant of Jy on a background of mJy per beam outside of the remnant. The central point source within the remnant shows a flux of mJy with a peak flux of mJy. The connection between this central source and the remnant is as of yet not evident. The radio emission from the interior of the remnant away from the central point-source amounts to mJy. No pulsar is known within G338.3–0.0 in the current ATNF pulsar catalogue (Manchester et al., 2005). The projection of G338.3–0.0 is located at the edge of a bright HII-region (Whiteoak & Green, 1996) (located at a distance of 3 kpc) with ongoing star formation and dust emission. This region seemingly connects the radio emission of G338.3–0.0 with the close-by Green’s catalogue SNR G 338.5+0.1 (Green, 2004). The best distance estimate of G338.3–0.0 so far comes from the relation of surface brightness to distance which places G338.3–0.0 at a distance of 8.6 kpc, right within the 3-kpc-arm-tangent region (and leaves it thus unrelated to the HII-region). At X-ray energies the region has been observed in the ASCA Galactic plane survey, resulting in the detection of AX J1640.7–4632 in positional coincidence with the SNR (Sugizaki et al., 2001). The ASCA source showed a rather soft photon index of , a total unabsorbed flux between 2 keV and 10 keV of erg cm-2 s-1, and a rather high absorption of n compared to the total column density in this direction (n as reported by Dickey & Lockman (1990)). Recent Swift XRT observations on HESS J1640–465 revealed one X-ray point-source within the radio shell and in coincidence with AX J1640.7–4632 (source #1 in Landi et al., 2006). The XRT data confirm the spectral parameters found by ASCA resulting in still rather unconstrained values of the photon index and the 2–10 keV flux erg cm-2 s-1.
At -ray energies above 100 MeV, 3EG J1639–4702, an unidentified EGRET source (Hartman et al., 1999), is found spatially compatible with HESS J1640–465 at an angular distance of 34′. 3EG J1639–4702 was only accepted for inclusion in the 3EG catalogue based on its cumulative significance over 4 years of EGRET observation, but never satisfied the detection threshold in any individual EGRET observation. Consequently, there is no reliable variability estimate available for this source, and a classification based on the available EGRET observables appeared impossible. 3EG J1639–4702 was labelled as an extended and confused -ray source, which puts the rather tight positional coincidence of 34′ with HESS J1640–465 somewhat into perspective. Various positional counterparts were found: a rather speculative suggestion was to associate it both with the unidentified ASCA source AX J1639.0–4642 (Sugizaki et al., 2001), and the INTEGRAL source IGR J16393–4643 (Malizia et al., 2004), concluding that 3EG J1639–4702 is a dust-enshrouded microquasar candidate (Combi et al., 2004). This suggestion was revised by the detection of a heavily obscured X-ray pulsar in XMM-Newton and RXTE observations coincident with IGR J16393–4643 (Bodaghee et al., 2006; Thompson et al., 2006). The corresponding mass estimates allowed for a classification of IGR J16393–4643 as a high-mass X-ray binary system. AX J1640.7–4632 and IGR J16393–4643 might therefore not be related to 3EG J1639–4702 given that this would constitute the first association between an unidentified EGRET source and a highly obscured INTEGRAL-detected HMXB. This scenario currently lacks both viable multi-waveband modelling and predictions for GeV energies. Other associations for 3EG J1639–4702 were suggested, including positionally coincident radio pulsars (PSR J1637–4642, PSR J1640–4648, and PSR J1637–4721) (Torres et al., 2001) and SNRs (G337.8–0.1, G338.1+0.4, and G338.3–0.0) (Romero et al., 1999). Two of these pulsars can be disregarded on energetics grounds (Torres et al., 2003), leaving only PSR J1637–4721 with a moderate required efficiency of 12% for conversion of spin down power into EGRET -radiation. Finally, Romero et al. (1999) also listed the stellar cluster and OB-associations NGC 6204, and Ara 1A A as positional coincidences, the latter additionally coinciding with 3EG J1655-4554. Summarising the possible associations of 3EG J1639–4702, the typical situation of an observationally weakly constrained EGRET detection allows for a variety of interpretations. A unique counterpart association will only be possible if the source location uncertainty is refined (using GLAST-LAT), or intriguing features at other wavebands are discovered, as perhaps in this case from H.E.S.S. observations.
The positional coincidences of HESS J1640–465 with G338.3–0.0 and AX J1640.7–4632 (and possibly also 3EG J1639–4702) suggests a connection between these objects. However, from the described multi-frequency data it remains so far unclear whether the X-ray and -ray emission originates within the shell of the radio SNR or rather in connection with a central X-ray object embedded within the shell. If the distance estimate of 8.6 kpc is correct, the radius of the SNR is pc and the Sedov solution for the evolutionary stage of the SNR yields ages between years (assuming a typical ambient density between cm-3 and an explosion energy of erg). In particular for densities larger than the canonical , the Sedov solution yields an age in excess of the typical VHE-bright -ray SNRs, such as RX J1713.7–3946 and RX J0852.0–4622 with ages of years or younger. In this letter we report on X-ray observations towards the G338.3–0.0/HESS J1640–465 region performed with XMM-Newton with the aim to study the connection between the radio/X-ray and -ray emitting regions in the light of higher angular resolution X-ray data.
2 XMM-Newton Observations of the region
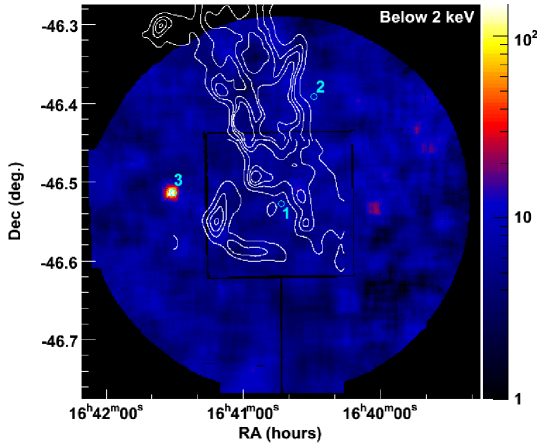
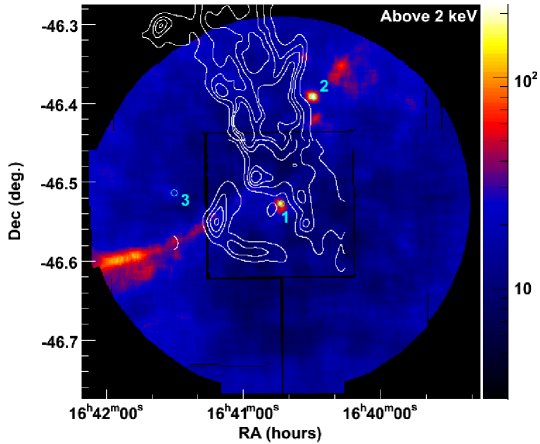
XMM-Newton observed HESS J1640–465 on the 20th of August 2005 for 21.8 ksec in satellite revolution 1043 (observation id 0302560201). All the instrument cameras (EPIC MOS1, MOS2, PN) were operated in full-frame mode with a medium filter to screen out optical and UV light. For data analysis, the XMM-Newton Science analysis software (SAS) version 7.0 was used together with the Extended Source Analysis Software package (XMM-ESAS) version 1.0 (Snowden, Collier & Kuntz, 2004). Following standard data reduction and calibration procedures, the data set was cleaned from temporally occurring background caused by soft proton flares. The resulting observation time amounts to only 7.3 ksec of useful data. Figure 1 shows an adaptively smoothed count map below 2 keV (top) and above 2 keV (bottom) combining events for the MOS-1 and MOS-2 detectors of XMM-Newton of the region surrounding HESS J1640–465. The white contours show the 843 MHz MOST-detected radio emission. Three prominent X-ray sources are visible, coinciding with the recently reported Swift XRT sources (and accordingly labelled #1, #2, and #3). Source #1 positionally coincides with the ASCA source AX J1640.7–4632 and is located within the radio shell of G338.3–0.0. No shell-like X-ray emission such as seen in the MOST data is apparent in the XMM-Newton data set. Also visible is the band of stray-light crossing the field of view from the north to the east, which can be attributed to the close-by () low mass X-ray binary GX 340.0. This stray-light contribution to the spectral analysis within a small region surrounding the X-ray source AX J1640.7–4632 seems to be rather small, since various background estimation methods using regions within the same field of view or from blank sky observations yield results comparable within the statistical uncertainties.
In a first step to characterise the X-ray sources in the region, the standard source detection algorithm emldetect has been applied to the data in the energy range from 0.5–10 keV, and as a cross-check in the restricted energy bands 0.5–2 keV, 2–4.5 keV, and 4.5–10 keV. Three X-ray sources are detected as depicted in Figure 1 by the cyan circles. The detection of source #1 in the 0.5–2 keV energy band is very weak, indicating a rather hard source with a high degree of absorption at low energies. Source #3 on the other hand is only detected in the 0.5–2 keV band, indicating a rather soft source. While these three sources are located within the several-arcsecond error bars of the Swift XRT-sources (Landi et al., 2006), the faint XRT-sources #4 and #5 are not detected in this XMM-Newton data, neither in the MOS-detectors in which they fall into gaps between the CCD chips nor in the PN-detector in which they are covered by the stray-light from GX 340.0 (catalog ). Table 1 summarises the properties of the three sources for the 0.5–10 keV energy band. Only source #1, coincident with the ASCA source AX J1640.7–4632 (in the following named XMMU J164045.4–463131) is extended in nature, consistently in all energy bands. Figure 2 shows a zoom on the region surrounding XMMU J164045.4–463131 along with the best fit positions for the XMM-Newton data presented here and the Swift XRT data (Landi et al., 2006). The source position fitting tool emldetect determines the extension of XMMU J164045.4–463131 to be incompatible with a point-source. Using a Gaussian model, the extension in the best-constrained energy band above 4.5 keV is determined to be image pixels, corresponding to a width on the sky of . For the lower energy bands, the best-fit width is larger but may be affected by stray-light, the band 4.5 keV to 10 keV was therefore chosen to provide the most reliable extension of the source. As is apparent in a slice through the source, as shown in Figure 2 (bottom), a Gaussian profile might not be the correct representation of the source morphology, which seems to exhibit a tail extending mostly southwards. As can also be seen from the slice, the contamination of a possible point-source-like pulsar within the source is expected to cover one or two bins in the slice and therefore to contaminate the emission by . The source position determined using the XMM-Newton data (see Table 1) is compatible with both the ASCA source (at , with a typical positional error of 1′ on the ASCA position and a distance of 1.3′ between the ASCA and the XMM-Newton best fit position) and the Swift XRT source (at , with a positional error of 6″ at a distance of 20″). As is apparent from Figure 2, the extended source XMMU J164045.4–463131 is positionally coincident with HESS J1640–465 and located within the radio shell G338.3–0.0, suggesting an association between the sources in these different energy bands. XMMU J164045.4–463131 does not appear to be positionally coincident with the weak point-like radio source located within the shell of G338.3–0.0 if the error on the radio position is indeed as small as several arcseconds (Green et al., 1999). Future radio studies are well motivated to identify the nature of this compact radio source.
| Id | XMMU J | RA2000 | Dec2000 | Error RA2000 | Counts |
|---|---|---|---|---|---|
| (h:m:s) | (d:′:″) | (″) | |||
| 1 | 164045.4–463131 | 16:40:45.39 | –46:31:31.1 | 8.5 | 222 |
| 2 | 164029.6–462328 | 16:40:29.58 | –46:23:28.0 | 1.5 | 153 |
| 3 | 164131.0–463048 | 16:41:30.98 | –46:30:48.0 | 0.6 | 215 |
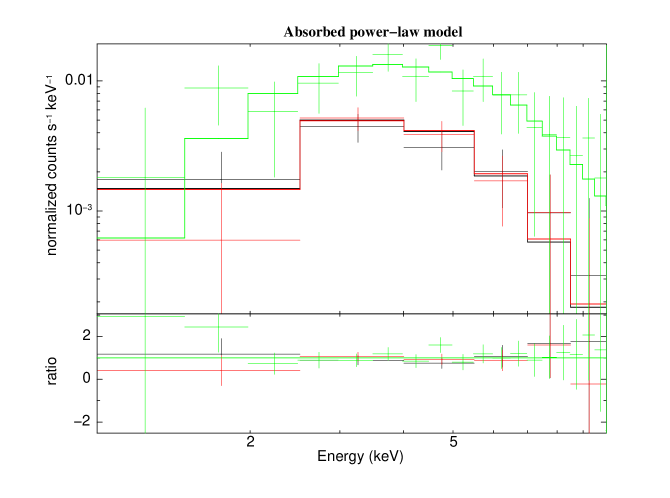
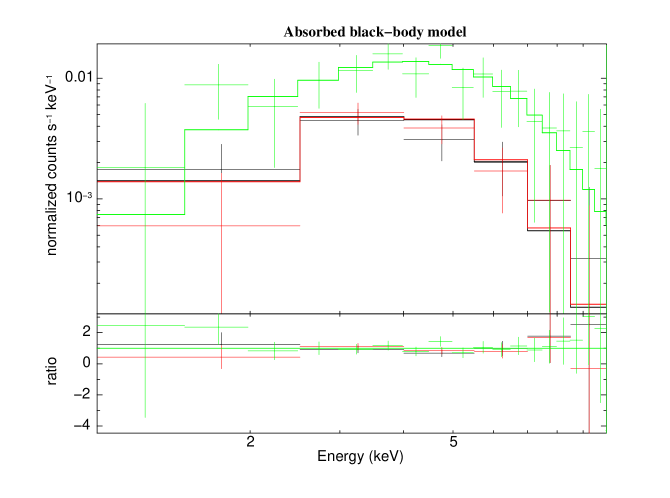
A catalogue search did not yield any obvious counterparts to sources #2 and #3. Since the angular distance to these two sources is too large to be reasonably associated with the VHE -ray emission in HESS J1640–465, the following analysis will be focused on XMMU J164045.4–463131. For the spectral analysis, the data was extracted using SAS 7.0. The reduced data set has been analysed and fitted using XSPEC (version 12.2.1). Several different background estimation techniques have been applied, including determining the background from the same field of view (both a ring around the source region and the source region mirrored at the centre of the camera) as well as from blank field observations. The different background estimation techniques agree well within the statistical errors and therefore in the following the background taken from a ring around the source in the same field of view will be used. The application of a background estimate from the same field of view has the advantage that all relevant backgrounds for this observation are included, such as the X-ray emission from the Galactic ridge, the residual particle background as well as the instrumental background. To encompass the whole extension of the source a source region of radius 75″ has been used for the spectral analysis. Consistent results with larger error bars were achieved with source extraction regions of radius 50″ and 100″. Table 2 summarises the parameters of the spectral fitting. Two spectral models were fitted to the data, an absorbed power-law and an absorbed black-body spectrum.
| Parameter | Value (powerlaw) | Value (black-body) |
|---|---|---|
| EMOS1 Counts | 321 | |
| EMOS2 Counts | 290 | |
| EPN Counts | 807 | |
| nH (cm-2) | (6.1 | |
| 1.74 | ||
| (keV) | 1.56 | |
| k1keV | ||
| F (erg cm-2 s-1) | ||
| /d.o.f. | 2702/3001 | 2694/3001 |
The power-law fit yields a hard photon index of , the source is rather faint with a total detected (i.e. absorbed) flux in the 2–10 keV range of erg cm-2 s-1. The column density cm-2 is marginally compatible with the average column density through the Galaxy in this region ( as reported by Dickey & Lockman (1990)). The black-body model yields a lower column density cm-2. It should however be noted, that the fit parameters ( and ) are somewhat correlated. Both models fit the data well as shown in Figure 3. Comparing the values of the reduced , no spectral model can be preferred over the other. While the results for the different background estimates are compatible within statistical uncertainties, the scatter might give a hint on the systematic error steming from the choise of the background and thus the systematic error was estimated to 0.2 on the photon index and 20% on the integrated flux. The result of the spectral analysis of the XMM-Newton data presented here is in agreement with the ASCA data, given the large error on the latter spectral results (photon index of , erg cm-2 s-1, ). The spectral analysis shows however, that the photon index is rather hard compared to the ASCA spectrum.
3 Interpretation of the Multi-wavelength data
The XMM-Newton data reveal the source XMMU J164045.4–463131 in positional coincidence with the unidentified ASCA source AX J1640.7–4632. The source exhibits a rather hard power-law spectrum of photon index , although a black-body spectrum of the X-ray emission with a temperature 1.56 keV, corresponding to provides an equally good fit. The source is relatively faint ( erg cm-2 s-1) and shows a rather strong absorption of cm-2. XMMU J164045.4–463131 is extended in nature with a compact core and a faint tail, resembling in morphology and spectral properties typical Pulsar Wind Nebulae (PWN). Asymmetric “trails” in PWN can be generated either a) through an asymmetric density distribution of the surrounding medium, preventing the expansion of the PWN on one side as e.g. seen in Vela X, b) dynamically by a supersonic motion of the pulsar with respect to the ISM, generating a bow-shock and a “cometary trail” (for a recent review of PWN see Gaensler & Slane, 2006). The hypothesis that XMMU J164045.4–463131 is a PWN (stemming from the hard energy spectrum and the morphology) is strengthened further by the location of this object within the boundaries of the shell-type radio SNR G338.3–0.0. This PWN scenario could finally be confirmed by the detection of a pulsar coincident with XMMU J164045.4–463131. No pulsation has been found in the current XMM-Newton data and no known radio pulsar is located towards XMMU J164045.4–463131 in the current ATNF catalogue (Manchester et al., 2005). Future deep radio or X-ray timing observations might serve to detect the associated pulsar. The “beaming fraction”, i.e. the faction of 4 steradians covered by the pulsar beam during one rotation, corresponds to the probability that the beam sweeps the line-of-sight of an observer. So far, no agreement has been reached on the relation between the beaming fraction and the period of the pulsar, and estimates range from beaming fractions of 30% to 100% for a typical 100 ms pulsar (Narayan & Vivekanand, 1983; Lyne & Manchester, 1988; Tauris & Manchester, 1998). In any case, the potential pulsar to the PWN discussed here might be beamed away from our line-of-sight. In this case, the confirmation of the PWN picture must come from the detection of electron cooling, resulting in a softening of the X-ray spectrum away from the pulsar as seen in many other PWN (e.g. in G 21.5–0.9, (catalog ) Slane et al., 2000)). Given the faintness of XMMU J164045.4–463131 the current data do not allow for the detection of such an effect. Very deep high angular-resolution Chandra studies will finally confirm or rule out this scenario. Nevertheless, the XMM-Newton data are very suggestive of a PWN, since the hard X-ray spectrum, the extended nature, the position within an radio SNR and the spatial coincidence with a VHE -ray source seem unlikely to occur by chance. In the following discussion we will therefore assume that the emission in the radio, X-rays and VHE -rays are connected and characterise a composite SNR.
The morphology of HESS J1640–465 seems to bear remarkable similarity with that of HESS J1813–178 (Aharonian et al., 2005a, 2006a; Funk et al., 2006). In both cases there is a coincidence of an extended TeV -ray source with an extended hard spectrum X-ray source located within the radio shell of an SNR. As in the case of HESS J1813–178 it is not clear, whether the -ray emission originates in the shell of the SNR, or from the core, since the angular resolution of VHE -ray instruments is too coarse to resolve the small structures seen in X-ray and radio observations. The “Gaussian equivalent width” of the radio SNR can be defined as ( and the Gaussian width in RA and Dec direction of the radio emission region smoothed with a Gaussian of size as used in the H.E.S.S. analysis). This “equivalent width” of the radio shell of G338.3–0.0 is , perfectly compatible with the size of the VHE -ray emitting region with an rms of . As in the case of HESS J1813–178 both the radio shell and the central X-ray core must therefore be considered as viable VHE -ray emitters. However, there are several notable differences to HESS J1813–178:
-
•
The X-ray emission of HESS J1640–465 is much weaker. This has several important consequences: any hard X-ray counterpart falls well below the sensitivity limit of current detectors such as INTEGRAL and Suzaku. Thus no hard X-ray counterpart to XMMU J164045.4–463131 exists as seen for HESS J1813–178 (suggesting acceleration to PeV energies). The faint X-ray emission also does not allow for an exclusion of a thermal origin of the keV emission. Future deep X-ray observations might finally distinguish between a power-law or a black-body emission model.
-
•
An unidentified EGRET source (3EG J1639–4702) (Hartman et al., 1999) is in positional coincidence with G338.3–0.0. If the sources are associated, this increases the -ray power even further.
-
•
So far, no dedicated search for a radio pulsar has been performed within the remnant and thus so far no pulsar has been found in G338.3–0.0. As discussed above, the pulsar light-cone might not sweep us as observers. There is however a weak radio point-source located at , within the remnant, that could possibly be identified as a pulsar or even a “relic” PWN in deep observations. This source, which can be seen in Figure 2, lies from XMMU J164045.4–463131.
-
•
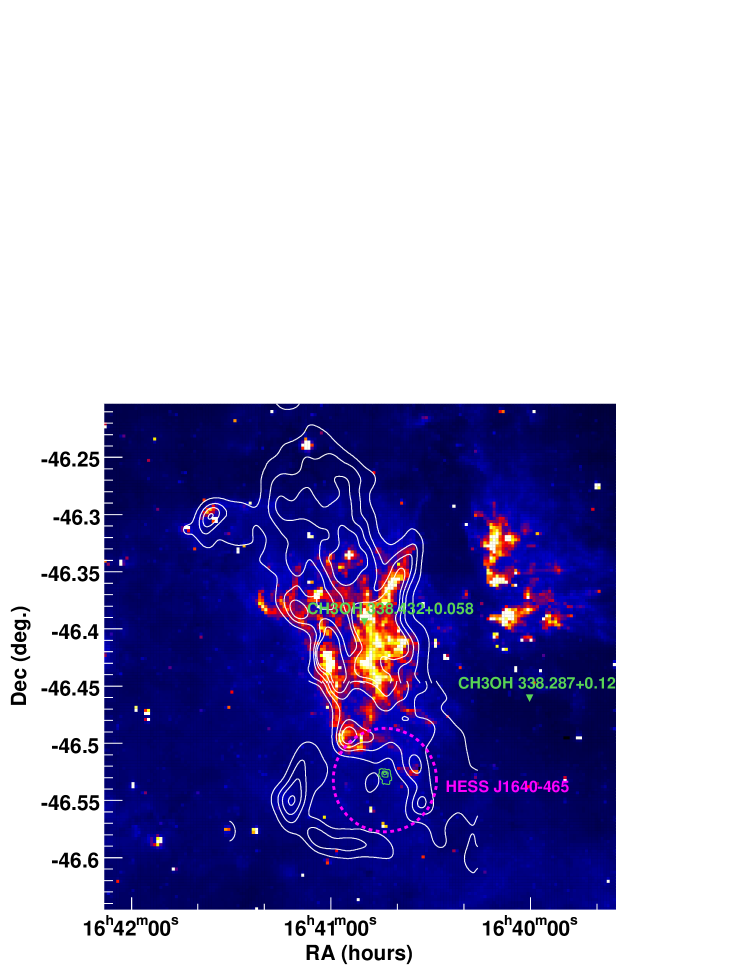
The distance to HESS J1640–465 ( kpc) is only poorly known, constrained only by the relation for G338.3–0.0 (with being the surface brightness and the distance). Such estimates are notoriously unreliable (Green, 2004). The nearby HII-regions shown in Figure 4 have measured radial velocities and implied distances of 3–4 kpc (Whiteoak & Green, 1996), and G338.3–0.0 may be associated with this region of star formation. The relatively strong H.E.S.S. and EGRET fluxes (provided that these objects are associated) would also argue for a distance kpc on energetics grounds. Nevertheless, in the following a distance of kpc will be assumed.
Whilst several morphological properties of HESS J1640–465 are very similar to HESS J1813–178, spectral properties differ quite strongly and the first two differences listed above are reminiscent of another VHE -ray source: HESS J1825–137 (Aharonian et al., 2005c, 2006c). This object is the only known VHE -ray source to exhibit energy dependent morphology (Aharonian et al., 2006c). For HESS J1825–137, an X-ray PWN was found in XMM-Newton observations of the energetic pulsar PSR J1826–1334 (Gaensler et al., 2003), extending asymmetrically to the south of the pulsar. Similarly, the VHE -ray emission shows an asymmetric emission, extending to the south of the pulsar, however on a completely different scale than the X-ray emission (the X-ray emission extends 5″, whereas the -ray emission extends to the south). Taking into account the different loss timescales of the -ray and X-ray emitting electrons, the situation can be plausibly explained by the -rays being generated by lower energy electrons than the X-rays. This scenario was strengthened by the detection of energy dependent morphology in the VHE -ray source, leading to a convincing identification of this object as the PWN of PSR J1826–1334 (Aharonian et al., 2006c). PSR J1826–1334 is a powerful “Vela-like”, 20 kyr old pulsar. For such evolved pulsars, in which the spin-down luminosity has changed substantially during the lifetime, braking effects are no longer negligible and a decrease of the particle injection rate with age must be taken into account. According to Pacini & Salvati (1973), the spin-down luminosity evolves in time as
| (1) |
(with the braking index and the initial spin-down timescale of the pulsar). If HESS J1640–465 indeed represents a PWN similar to HESS J1825–137, a relatively powerful, year old pulsar should exist within G338.3–0.0. The age of G338.3–0.0 has been estimated to years, assuming expansion in the Sedov phase into a medium of density cm-3, and using the distance estimate of kpc.
Taking into account the examples of both HESS J1813–178 and HESS J1825–137, in the following the multi-frequency properties of HESS J1640–465 will be discussed with the aim to connect the radio, X-ray and VHE -ray emission into a consistent picture. Table 3 summarises the properties of the X-ray and of the -ray emission.
| XMMU J164045.4–463131 | HESS J1640–465 | |
|---|---|---|
| Angular Size | ||
| Linear Size (pc) | ||
| Apparent Luminosity ( erg/s) | ||
| Photon Index |
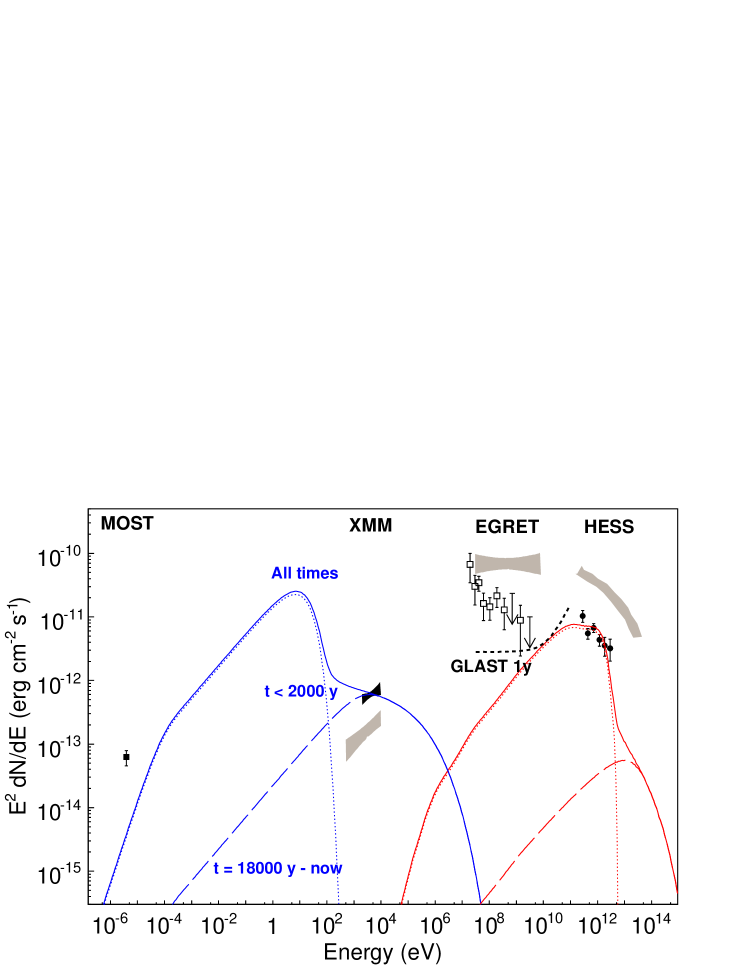
Figure 5 compares the spectral energy distributions of HESS J1640–465 and HESS J1825–137. The main characteristics that have to be explained by the modelling are that the VHE -ray source is an order of magnitude larger than the X-ray source and that the VHE -ray power is more than an order of magnitude larger than the X-ray power. As in the case of HESS J1825–137, it is rather difficult to establish a multi-wavelength connection in a leptonic one-zone model (Aharonian & Atoyan, 1999) with constant injection and a single population of electrons responsible for the whole emission. For plausible radiation and magnetic field energy densities, such models generally predict X-ray synchrotron fluxes equal to or greater than the associated TeV IC fluxes, unless suppressed magnetic fields or rather peculiar environments like in the Galactic Centre are invoked (Hinton & Aharonian, 2006). As it seems hardly possible to find satisfactory parameters for such a simple model, a time-dependent rate of injection of electrons into the nebula will be considered. For the following argument, the existence of a year old pulsar produced in the supernova explosion of G338.3–0.0 will be assumed. For younger ages, no satisfactory fit to the data can be found in the frame of the model described here. It will be further be assumed that the size of the X-ray source is limited by electron synchrotron cooling which in turn limits the age of particles seen at X-ray energies. To explain the different sizes of the emission regions in X-ray and VHE -rays, cooling times of the X-ray emitting electrons must be short in comparison to the age of the source, while cooling times for the VHE -ray emitting electrons must be long in comparison to the age of the source. This situation is rather likely for a system of this age: For a typical G field, 4 keV synchrotron X-rays are generated by TeV electrons, which lose their energy on timescales of 1,200 years. In contrast, 0.8 TeV IC -ray are emitted by TeV electrons, which cool on timescales of years. A natural explanation for the different sizes of the emission regions is to invoke different populations of electrons with different cooling timescales and hence propagation distances. In this scenario the size of the X-ray nebula is limited by electron cooling on year timescales, in contrast the angular size of the -ray source reflects the propagation speed of electrons injected soon after the birth of the pulsar years ago.
The curves in Figure 5 illustrate the model scenario invoked to connect XMMU J164045.4–463131 to HESS J1640–465 for populations of electrons injected at different slices in time during the lifetime of the pulsar. A canonical injection spectrum was used with a lower energy cut-off at 10 GeV and an exponential cut-off at 1 PeV, as the rather hard X-ray spectrum yields a lower limit for the cutoff energy of a few hundreds of TeV. A time-independent magnetic field strength of 10 G was assumed for the whole nebula. The injection rates of electrons varies with time, assuming that the power injected into electrons follows the spin-down power of the pulsar which varies according to Equation 1 (with and years). The dotted line shows the electrons injected in the first 2000 years after the birth of the pulsar (20,000 years ago), i.e. “old” electrons. The injected electron population evolves in time, taking into account synchrotron and IC energy losses. The population of “old” electrons totally dominates the synchrotron emission below X-ray energies and is responsible for the VHE -rays detected in HESS J1640–465. The populations of “youngest” electrons (dashed curve) injected in the last 2000 years are less drastically cooled, as can be seen in Figure 5. According to the model shown here, these youngest electrons are responsible for the bulk of the X-ray emission as seen in the compact X-ray source. To explain the X-ray source as synchrotron emission from a PWN, the required (present day) luminosity in accelerated electrons is erg/s, or about 50% of the spin-down power of a pulsar like PSR J1826–1334 ( erg/s), assumed to be a representative of the pulsars powering these VHE -ray PWN systems. The total electron luminosity integrated over the lifetime of the pulsar amounts to ergs. An upper limit from the 8 m GLIMPSE Spitzer data, integrating within the area of the VHE -ray source, yields an unconstraining upper limit of erg cm-2 s-1 (at eV). It should however be noted that in the derivation of this limit no subtraction of prominent IR sources has been applied. Although the figure shows how to accommodate the different sizes and fluxes of the X-ray and VHE -ray production regions, it must still be seen as an oversimplified picture. A realistic model requires the inclusion of the time (and space) dependence of the magnetic field, as well as a proper treatment of the propagation of particles within the nebula.
Also apparent from these model curves is that it is rather difficult to connect HESS J1640–465 and XMMU J164045.4–463131 with the unidentified EGRET source 3EG J1639–4702 within the framework of an IC scenario. However, an association of 3EG J1639–4702 and HESS J1640–465 is rather natural in two alternative scenarios: a model in which the VHE -rays are generated by electron Bremsstrahlung or in a hadronic emission model. If the ISM density in this region is high ( is more than about 100 cm-3), then Bremsstrahlung may be the dominant -ray emission mechanism at TeV energies for a population of ultra-relativistic electrons. If HESS J1640–465 and 3EG J1639–4702 are indeed associated, Bremsstrahlung may be the most natural mechanism to explain the high energy part of the SED.
Alternatively, the EGRET and H.E.S.S. detected -rays could be generated by hadronic interactions of accelerated protons via -decays. In this case the 2–10 keV X-ray flux can be connected to these accelerated hadrons by secondary electrons generated in the hadronic interactions. Assuming a distance of kpc, the measured -ray flux above 200 GeV suggests a total energy in the accelerated hadrons of erg. This energy represents a plausible injection from a single SNR for values of more than 1 cm-3 and/or distances significantly closer than 8 kpc. However, in this scenario, secondary electrons would be produced in the same region as the TeV -rays, and similar sizes for the X-ray and -ray sources might naively be expected. The observed factor of six difference in size therefore counts against an association of XMMU J164045.4–463131 and HESS J1640–465 in this scenario. Whilst a hadronic scenario for -ray emission remains viable, if XMMU J164045.4–463131 and HESS J1640–465 are unrelated, then the excellent positional agreement between these two sources can be considered somewhat surprising.
Given the fact that there are several other prominent candidates for 3EG J1639–4702 (as described above) and that the EGRET source is the least well measured object in this context, it seems that a strong claim of a possible connection has to await the launch of the upcoming GLAST satellite. The dashed line in Figure 5 shows the 1-year sensitivity of the GLAST-LAT, including the diffuse Galactic background and the instrumental background. The curve demonstrates that the LAT is well suited to shed new light on this region in the MeV to GeV range via its superior angular resolution (and sensitivity) in comparison to EGRET.
4 Summary and conclusion
The detailed XMM-Newton X-ray data taken towards HESS J1640–465 show a hard-spectrum extended object towards the centre of the SNR G338.3–0.0, suggesting the detection of a new composite SNR in which the X-rays are generated by synchrotron emission from a central PWN. The ultimate proof of this scenario requires the detection of a coincident pulsar, in either X-ray or radio observations, or the detection of spectral cooling characteristic of PWN systems. Both the shell of the SNR and a central PWN are viable VHE -ray emitters and the two scenarios cannot be distinguished at this point (the situation is similar to the case of HESS J1813–178). If the VHE -ray are generated by inverse Compton emission associated with a PWN, the spectral energy distribution shows an interesting similarity to another VHE -ray PWN HESS J1825–137. As is the case for that object the low ratio of the X-ray power to the VHE -ray power in HESS J1640–465 suggests a time dependent rate of injection for the relativistic electrons responsible for the X-ray emission and an older (and more numerous) population of electrons producing the VHE -ray emission. IR to soft X-ray measurements of the synchrotron nebula associated with HESS J1640–465 could confirm this picture. However, any synchrotron emission from HESS J1640–465 in this energy range appears to be buried beneath thermal emission. An extension of the -ray spectrum to higher energies (for example from a deeper observation with H.E.S.S.) would allow us to probe the IC emission of the electrons responsible for the keV synchrotron emission. The detection of the extended X-ray source in the centre of the Supernova remnant G338.3–0.0 following the detection of a VHE -ray source demonstrates that X-ray follow-up observations of TeV -ray are well motivated and provide important insights into the nature of these objects.
References
- Aharonian & Atoyan (1999) Aharonian, F. A., & Atoyan, A., 1999, A&A 351, 330
- Aharonian et al. (2004) Aharonian, F. A, et al. (H.E.S.S. Collaboration), 2004 Nature, 432, 75
- Aharonian et al. (2005a) Aharonian, F. A., et al. (H.E.S.S. Collaboration) 2005a, Science 307, 1938
- Aharonian et al. (2005b) Aharonian, F. A., et al. (H.E.S.S. Collaboration), 2005b, A&A 435, L17
- Aharonian et al. (2005c) Aharonian, F. A., et al. (H.E.S.S. Collaboration), 2005c, A&A 442, L25
- Aharonian et al. (2006a) Aharonian, F. A., et al. (H.E.S.S. Collaboration) 2006a, ApJ 636, 777
- Aharonian et al. (2006b) Aharonian, F. A., et al. (H.E.S.S. Collaboration), 2006b, A&A 449, 223
- Aharonian et al. (2006c) Aharonian, F. A., et al. (H.E.S.S. Collaboration), 2006c, A&A 460, 365
- Benjamin et al. (2003) Benjamin, R. A. et al., PASP 115, 953
- Bodaghee et al. (2006) Bodaghee, A., et al., 2006, A&A 447, 1027
- Combi et al. (2004) Combi, J. A., Rib , M., Mirabel, I. F., & Sugizaki, M., 2004, A&A 422,
- Dickey & Lockman (1990) Dickey, J. M., & Lockman, F. J., 1990, ARA&A. 28, 215
- Funk (2006) Funk, S., 2006, Astrophys Space Science, in press (astro-ph/0609586)
- Funk et al. (2006) Funk, S., et al., 2006, submitted to A&A (astro-ph/0611646)
- Gaensler et al. (2003) Gaensler, B. M., et al., 2003, ApJ 588, 441
- Gaensler & Slane (2006) Gaensler, B. M., & Slane, P. O., 2006, ARA&A 44 (1), 17
- Green et al. (1999) Green, A. J., Cram, L. E., Large, M. I., Ye, T. 1999, ApJS, 122, 207
- Green (2004) Green, D. A. 2004, BASI, 32, 335
- Hartman et al. (1999) Hartman, R. C., et al., 1999, ApJS, 123, 79
- Hinton (2004) Hinton, J. A. (H.E.S.S. Collaboration), 2004, New Astron. Rev. 48, 331.
- Hinton & Aharonian (2006) Hinton, J. A., & Aharonian, F. A., 2006, ApJ in press (astro-ph/0607557)
- Koralesky et al. (1998) Koralesky, B., et al., 1998, AJ 116, 1323
- Landi et al. (2006) Landi, R., et al., 2006, ApJ, 651, 190
- Lyne & Manchester (1988) Lyne, A. G., & Manchester, R. N., 1988, MNRAS 235, 477
- Malizia et al. (2004) Malizia, A., et al., 2004, ATel 227, 1
- Manchester et al. (2005) Manchester, R. N., Hobbs, G. B., Teoh, A., & Hobbs, M. 2005, AJ 129, 1993
- Narayan & Vivekanand (1983) Narayan, R., & Vivekanand, M., 1983, A&A. 122, 45
- Porter et al. (2006) Porter, T. A., Moskalenko, I. V., & Strong, A. W., 2006, ApJ 648, L29
- Pacini & Salvati (1973) Pacini F, Salvati M., 1973, ApJ 186, 249
- Romero et al. (1999) Romero, G. E., Benaglia, P., & Torres, D. F., 1999, A&A 348, 868
- Slane et al. (2000) Slane, P., et al., 2000, ApJ 533, L29
- Snowden, Collier & Kuntz (2004) Snowden, S. L, Collier, M. R, & Kuntz, K. D., 2004, ApJ 610, 1182
- Sugizaki et al. (2001) Sugizaki, M., et al, 2001, ApJS 134, 77
- Tauris & Manchester (1998) Tauris, T. M., & Manchester, R. N., 1998, MNRAS 298, 625
- Thompson et al. (2006) Thompson, T. W. J., et al., 2006, ApJ 649, 373
- Torres et al. (2001) Torres, D. F., Butt, Y. M., & Camilo, F., 2001, ApJ 560, L155
- Torres et al. (2003) Torres, D. F., et al., 2003, PhR, 382, 303
- Whiteoak & Green (1996) Whiteoak, J. B. Z., Green, A. J. 1996, A&AS, 118, 329