Modeling the X-ray fractional variability spectrum of Active Galactic Nuclei using multiple flares
Abstract
Using Monte-Carlo simulations of X-ray flare distributions across the accretion disk of active galactic nuclei (AGN), we obtain modeling results for the energy-dependent fractional variability amplitude. Referring to previous results of this model, we illustrate the relation between the shape of the point-to-point fractional variability spectrum, , and the time-integrated spectral energy distribution, . The results confirm that the spectral shape and variability of the iron K line are dominated by the flares closest to the disk center.
Astronomical Institute, Academy of Sciences, Prague, Czech Republic
Copernicus Astronomical Center, Warsaw, Poland
Laboratoire ApC, Université Denis Diderot, Paris, France
Dipartimento di Astronomia, Università di Bologna, Bologna, Italy
The fractional variability spectrum of AGN describes the variability properties as a function of photon energy (see e.g. Edelson et al. 2002; Vaughan et al. 2003). In Goosmann et al. (2006) we present modeling of AGN fractional variability spectra for distributions of magnetic flares co-rotating with the accretion disk. Using a Monte-Carlo method, we sample the time evolution of the flare distribution for different choices of the global parameters. These determine the radial distribution of the flare number and luminosity across the disk, the individual flare life times, the average X-ray luminosity of the object, the mass of the black hole, and its spin. By using a ray-tracing method, the computations include general relativistic and Doppler corrections.
For this proceedings note we present an extension of our work by emphasizing the connection between and for a given model setup. We consider parameter sets that only differ in the radial distribution of the individual flare luminosity, ruled by the parameter . All other parameters are set as for our best fit to the variability spectrum of MCG-6-30-15, which was computed from a 95 ksec XMM-Newton observation (for details see Goosmann et al. 2006).
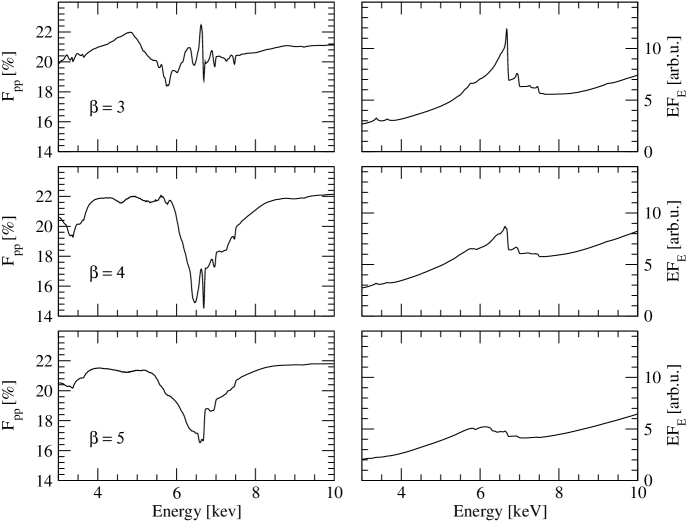
In Fig. 1 we show results for and with 3, 4 and 5. The normalization (but not the shape) of can vary for the same parameter set within the limits of Monte-Carlo statistics. Therefore, we normalize the spectra in Fig. 1 to the variability level of as obtained for our best fit to MCG-6-30-15. Thus, we only investigate the shape of and not the normalization.
For , when the radial profile of the X-ray luminosity is roughly proportional to the radial profile of the disk luminosity, the variations of with energy are relatively low. For higher values of the variability is significantly depressed around the iron K line, and the iron line profile is more strongly smeared out. Hence, if the X-ray luminosity is due to individual, localized flares, and if their luminosity rises more strongly than the disk luminosity toward the center, then we expect not only a broadened iron-line profile, but also a significant depression of the spectral variability across the line. Note that such a strong rise of the disk irradiation toward the center is predicted by the light-bending models (see e.g. Suebsuwong et al. 2006).
Acknowledgments.
We are grateful to A.-M. Dumont and A. Różańska for their help with computing the local flare spectra used in this model.
References
- Edelson et al. (2002) Edelson, R., Turner, T. J., Pounds, K., Vaughan, S., Markowitz, A., Marshall, H., Dobbie, P., & Warwick, R. 2002, ApJ, 568, 610
- Goosmann et al. (2006) Goosmann, R. W., Czerny, B., Mouchet, M., Ponti, G., Dovčiak, M., Karas, V., Różańska, A., & Dumont, A.-M. 2006, A&A, 454, 741
- Suebsuwong et al. (2006) Suebsuwong, T., Malzac, J., Jourdain, E., & Marcowith, A. 2006, A&A, 453, 773
- Vaughan et al. (2003) Vaughan, S., Edelson, R., Warwick, R. S., & Uttley, P. 2003, MNRAS, 345, 1271