Discovery of an Unusual Dwarf Galaxy in the Outskirts of the Milky Way
Abstract
In this Letter, we announce the discovery of a new dwarf galaxy, Leo T , in the Local Group. It was found as a stellar overdensity in the Sloan Digital Sky Survey Data Release 5 (SDSS DR5). The color-magnitude diagram of Leo T shows two well-defined features, which we interpret as a red giant branch and a sequence of young, massive stars. As judged from fits to the color-magnitude diagram, it lies at a distance of kpc and has an intermediate-age stellar population with a metallicity of [Fe/H]= -1.6, together with a young population of blue stars of age Myr. There is a compact cloud of neutral hydrogen with mass and radial velocity kms-1 coincident with the object visible in the HIPASS channel maps. Leo T is the smallest, lowest luminosity galaxy found to date with recent star-formation. It appears to be a transition object similar to, but much lower luminosity than, the Phoenix dwarf.
Subject headings:
galaxies: dwarf — galaxies: individual (Leo) — Local Group1. Introduction
The last two years have seen the discovery of 10 faint, new Milky Way satellites in data from the Sloan Digital Sky Survey (SDSS). This is made up of 8 new Milky Way dwarf galaxies, together with 2 unusually extended globular clusters (Willman et al., 2005; Zucker et al., 2006a, b; Belokurov et al., 2006a, 2007). The purpose of this Letter is to announce the discovery of an additional dwarf galaxy in the Local Group. At a heliocentric distance of kpc, this is at the very outskirts of the Milky Way’s sphere of influence.
The dwarf is faint with roughly circular isopleths from the majority intermediate-age stellar population. These properties are shared by other Local Group dwarf spheroidal (dSph) galaxies. However, Leo T also has a population of bright, blue stars, which is evidence for an epoch of recent star-formation. It must therefore have contained some gas in the recent past, and there is evidence of a compact, neutral gas cloud still associated with the object today. These properties are characteristic of the dwarf irregular (dIrrs) galaxies. As the dwarf possesses transitional properties – intermediate between those of dSphs and dIrrs – we propose to call it Leo T . Other transitional dwarf galaxies are known, in particular Phoenix, Pisces and Leo A (see e.g., Grebel, 2001), which are at comparable distances from the Galaxy and M31.
| ParameteraaSurface brightnesses and integrated magnitudes are accurate to and are corrected for the mean Galactic foreground reddening, AV, shown. | |
|---|---|
| Coordinates (J2000) | 09:34:53.4 +17:03:05 |
| Coordinates (Galactic) | |
| Position Angle | |
| Ellipticity | |
| (Plummer) | |
| AV | |
| (Plummer) | |
| (mM)0 | |
| Mtot,V | |
| bbFrom HI data, no stellar velocities measured to date | +35 kms-1 |
2. Data and Discovery
SDSS imaging data are produced in five photometric bands, namely , , , , and (Fukugita et al., 1996; Gunn et al., 1998; Hogg et al., 2001; Adelman-McCarthy et al., 2006; Gunn et al., 2006). The data are automatically processed through pipelines to measure photometric and astrometric properties (Lupton, Gunn, & Szalay, 1999; Stoughton et al., 2002; Smith et al., 2002; Pier et al., 2003; Ivezić et al., 2004) and de-reddened with the help of Schlegel et al. (1998). Data Release 5 (DR5) primarily covers square degrees around the North Galactic Pole (NGP).
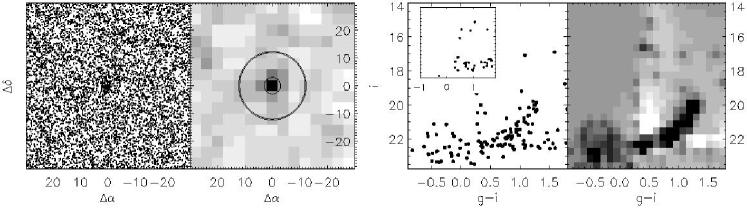
As part of our systematic survey of stellar overdensities in DR5 (Belokurov et al., 2006b, 2007), we identified a new candidate in the constellation of Leo. A roughly spherical overdensity of objects classified by the SDSS pipeline as stars is readily visible in the left panel of Figure 1. Plotting these stars in a color-magnitude diagram (CMD) and using it to construct a Hess diagram (right panels of Figure 1) reveals a clear red giant branch (RGB). Although sparsely populated, the CMD looks like those of the dwarf irregular or transition galaxies with detected young, blue populations, such as Phoenix (Martínez-Delgado et al., 1999) and Leo A (Tolstoy et al., 1998). The bright, blue sequence in the CMD may be a nearly zero-age main sequence or blue loop, or even blue straggler stars. Some of the stars may even be blue horizontal branch stars scattered into this region of the CMD by photometric errors. Precise interpretation needs deeper photometry, but the general conclusion is clear – the Leo T dwarf contains a population of young, recently formed ( 1 Gyr) stars.

The distance, metallicity and age of the object were constrained by applying a colour-magnitude diagram (CMD) fitting technique to the SDSS photometry. Using the MATCH software (Dolphin, 2002; de Jong et al., 2007) together with isochrones from Girardi et al. (2004), model stellar populations with fixed age range, metallicity and distance were fit to the versus data for all stars within of the center. The background was estimated using stars located suitably far from the object. Figure 2 shows the goodness-of-fit contours for two different age bins, namely 4-5 and 8-10 Gyrs. The inset shows the improvement in the maximum-likelihood goodness-of-fit parameter Q (Dolphin 2002) for the ages probed with respect to fitting a control field CMD. While the age of the stellar population is not well-constrained, the best-fit metallicity and distance values do not change significantly. These fits imply a rather metal-poor stellar population with [Fe/H]-1.6 at a distance modulus of 23.3 magnitudes, corresponding to a heliocentric distance of kpc. The fits are heavily weighted towards the most numerous population in the CMD, in this case the RGB population.

3. Physical Properties and Stellar Population
Follow-up observations of Leo T were made on 30 November 2006 (UT) using the 2.5 INT telescope with the WFC mosaic camera. This contains 4 2k4k pixel EEV CCDs with a field of view of roughly 3030 arcminutes and a scale of 0.33 arcseconds per pixel at the field centre. Leo T was observed with single exposures of 1200s and 900s in SDSS-like , bands, and calibrated on the SDSS AB system. Data were processed in Cambridge using a general purpose pipeline for processing wide-field optical CCD data (Irwin & Lewis, 2001). Images were de-biased and trimmed, cross-talk corrected, and then flatfielded and gain-corrected to a common internal system using clipped median stacks of nightly twilight flats. For each image frame an object catalogue was generated using the object detection and parameterisation procedure discussed by Irwin et al. (2004). Objects in the catalogues were morphologically classified as stellar or non-stellar (or noise-like). The detected objects in each passband were then merged by positional coincidence (within 1 arcsec) to form a combined catalogue.
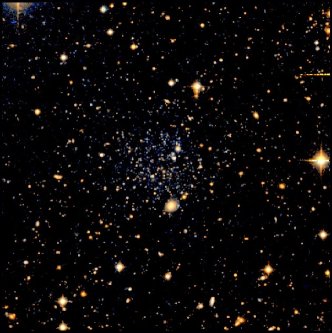
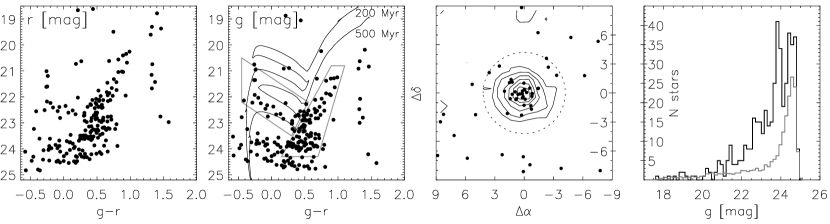
Figure 3 shows an INT image derived from the and band data. The Leo T dwarf is clearly visible, together with its population of blue stars. The left panels of Figure 4 show the CMD within a radius of the centre. Even though the giant branch is sparsely populated, the tip must be as bright as (see Fig. 1), which corresponds to , using the transformations given in Smith et al. (2002) and allowing an extra mag for extinction in the i-band. Using the calibration (Bellazzini et al., 2001), we find that the distance modulus is therefore at most .
The rightmost panel of Figure 4 shows the luminosity functions of stars detected in the -band image (see Figure 3), which is complete to . The black line shows the number of stars within a circle of radius . This is compared with the grey line, which shows the appropriately normalised luminosity function for the background region. There is an obvious excess of counts peaking at , which is where we would expect to see the horizontal branch. This unambiguous detection, which is readily apparent in the CMDs shown in the left panels, allows us to improve on the distance estimate. Assuming in the g-band at 0 after allowing for extinction implies a distance modulus of , consistent with the sparsely populated RGB near the tip. The middle left panel of Figure 4 shows overlaid isochrones from Girardi et al. (2004), corresponding to stellar populations of age 200 and 500 Myrs at a distance modulus of 23.1. Blue stars brighter than and blueward of the giant branch are therefore most likely to be helium burning blue loop stars associated with a young component. Two zones from the color-magnitude diagram, indicated by the gray boxes were used for the spatial analysis. The RGB candidates were used to produce the density contours in the middle right panel of the figure. The object is seen to be almost circular in the inner parts. The young blue stars are shown as filled circles in this figure and are concentrated near the centre, thus confirming that they are physically associated with the Leo T dwarf.
To estimate the properties in Table 1, we use the INT data to derive the centroid from the density-weighted first moment of the distribution and use the second moments to investigate the ellipicity. Athough circular in general appearance the ellipicity at different contour levels averages but has a position angle that varies by 90 degrees. The radial profile shown in Figure 5 is derived from all stars with and satisfying . We compute the average density within circular annuli after first subtracting a constant asymptotic background level (0.8 arcminute-2), reached at large radii, and then fit the radial profile with a standard Plummer law. At a distance of kpc, the best-fitting half-light radius of corresponds to pc. This is the typical scale length of some of the recently discovered Galactic dSph galaxies (Belokurov et al., 2007), but smaller than the classical Local Group dIrr galaxies (van den Bergh, 2000).
The flux (AB magnitudes) in stars within a 5 arcmin radius relative to a control background region is and computed by integrating to the horizontal branch level. To estimate the contribution from young stars between the horizontal branch and main-sequence turn-off, we used the deep HST luminosity function of Phoenix provided by Holtzman et al. (2006) to obtain a correction of 0.5 mag. By allowing 0.3 mag for stars fainter than turn-off, and 0.1 mag for extinction, we obtain a total flux estimate of . Using the transformations in Smith et al. (2002) and assuming the measured average colour of holds for the entire stellar population, this equates to (Vega). At a distance modulus , this corresponds to an absolute magnitude of . Assuming a Plummer profile, this yields an observed band central surface brightness of mag arcsec-2. For the new dwarfs this is a relatively high surface brightness, which is consistent with the easy visibility on the image in Figure 3
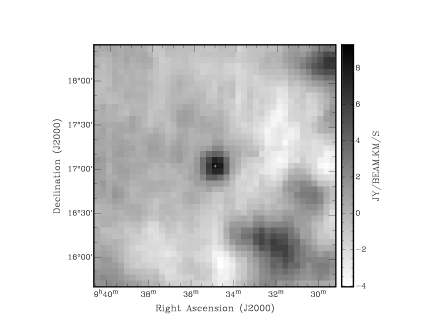
Finally, Figure 6 shows an HI flux density map centered on the coordinates of the Leo T dwarf using data from the Northern HI Parkes All Sky Survey (HIPASS, Wong et al. 2006). Located at the same spot is a significant HI overdensity. At a distance of kpc, the HI mass of this cloud would be . Its flux-weighted heliocentric velocity is 35 km s-1, corresponding to a Galactic Standard of Rest velocity of -61 km s-1, consistent with gentle Galactic infall. It is clearly isolated from the filamentary foreground of HI clouds, which have similar velocities. The stellar center of Leo T lies within the same HIPASS pixel that contains the centroid of the HIPASS gas cloud. This suggests that there is a high probability that the cloud is physically associated with the dwarf. Although HIPASS does not have adequate velocity resolution to measure the dispersion directly the non-appearance of the compact HI cloud in adjacent channels either side of the two detection channels constrains the velocity dispersion to be less than kms-1, which is within the realm of low luminosity dwarfs.
The stellar luminosity of Leo T is , which corresponds to a mass of , assuming a stellar mass-to-light ratio of . This gives a ratio of mass in HI to mass in luminous material of about unity, consistent with that found in dIrrs in the Local Group. The source is unresolved in HIPASS, however the inferred average column density of HI within the Plummer radius is . Although this average is slightly below the threshold required for star formation (Elmegreen & Parravano, 1994), the surface density of HI is likely to contain local peaks (van Zee et al., 1997).
4. Conclusions
We have discovered a new dwarf galaxy in the constellation of Leo, which we have named Leo T . Its CMD has a clear red giant branch, from which we derive a tentative age of 6-8 Gyrs and a metallicity of [Fe/H] . Its distance, derived from the position of the horizontal branch, is kpc. Given this distance, Leo T is unlikely to have been strongly affected by the tides of the Milky Way. This suggests that its very low luminosity is intrinsic and not the result of disruption or stripping. Clearly visible in the CMD is a sequence of bright blue stars indicative of recent star formation. Coincident with the position of the dwarf is an HI cloud of . The Leo T dwarf has some of the characteristics of transition galaxies like Phoenix or Pisces, but, with an absolute magnitude of , it is much fainter. It is the least luminous galaxy found to date with recent star-formation.
References
- Adelman-McCarthy et al. (2006) Adelman-McCarthy, J. K., et al. 2006, ApJS, 162, 38
- Bellazzini et al. (2001) Bellazzini, M., Ferraro, F. R., & Pancino, E. 2001, ApJ, 556, 635
- Belokurov et al. (2006a) Belokurov, V. et al. 2006a, ApJ, 647, L111
- Belokurov et al. (2006b) Belokurov, V. et al. 2006b, ApJ, 642, L137
- Belokurov et al. (2007) Belokurov, V. et al. 2007, ApJ, 654, 897
- de Jong et al. (2007) de Jong, J. et al. 2007, ApJ, submitted
- Dolphin (2002) Dolphin, A. E. 2002, MNRAS, 332, 91
- Elmegreen & Parravano (1994) Elmegreen, B. G., & Parravano, A. 1994, ApJ, 435, L121
- Fukugita et al. (1996) Fukugita, M., Ichikawa, T., Gunn, J. E., Doi, M., Shimasaku, K., & Schneider, D. P. 1996, AJ, 111, 1748
- Girardi et al. (2004) Girardi, L., Grebel, E. K., Odenkirchen, M., & Chiosi, C. 2004, A&A, 422, 205
- Grebel (2001) Grebel, E. K. 2001, Astrophysics and Space Science Supplement, 277, 231
- Gunn et al. (1998) Gunn, J.E. et al. 1998, AJ, 116, 3040
- Gunn et al. (2006) Gunn, J.E. et al. 2006, ApJ, in press
- Hogg et al. (2001) Hogg, D.W., Finkbeiner, D.P., Schlegel, D.J., Gunn, J.E. 2001, AJ, 122, 2129
- Holtzman et al. (2006) Holtzman, J. A., Afonso, C., & Dolphin, A. 2006, ApJS, 166, 534
- Irwin & Lewis (2001) Irwin, M.J., & Lewis, J. 2001, New Astronomy Review, 45, 105
- Irwin et al. (2004) Irwin, M. J., et al. 2004, Proc. SPIE, 5493, 411
- Ivezić et al. (2004) Ivezić, Ž. et al., AN, 2004, 325, 583
- Lupton, Gunn, & Szalay (1999) Lupton, R., Gunn, J., & Szalay, A. 1999, AJ, 118, 1406
- Martínez-Delgado et al. (1999) Martínez-Delgado, D., Gallart, C., & Aparicio, A. 1999, AJ, 118, 862
- Pier et al. (2003) Pier, J.R., Munn, J.A., Hindsley, R.B, Hennessy, G.S., Kent, S.M., Lupton, R.H., Ivezic, Z. 2003, AJ, 125, 1559
- Schlegel et al. (1998) Schlegel, D. J., Finkbeiner, D. P., & Davis, M. 1998, ApJ, 500, 525
- Smith et al. (2002) Smith, J. A., et al. 2002, AJ, 123, 2121
- Stoughton et al. (2002) Stoughton, C. et al. 2002, AJ, 123, 485
- Tolstoy et al. (1998) Tolstoy, E., et al. 1998, AJ, 116, 1244
- van den Bergh (2000) van den Bergh, S., 2000, The Galaxies of the Local Group, Cambridge University Press, Cambridge
- van Zee et al. (1997) van Zee, L., Haynes, M. P., Salzer, J. J., & Broeils, A. H. 1997, AJ, 113, 1618
- Willman et al. (2005) Willman, B., et al. 2005, ApJ, 626, L85
- Wong et al. (2006) Wong, O. I., et al. 2006, MNRAS, 371, 1855
- Zucker et al. (2006a) Zucker, D. B., et al. 2006a, ApJ, 643, L103
- Zucker et al. (2006b) Zucker, D. B., et al. 2006b, ApJ, 650, L41