HI imaging of Galaxy Clusters at z0.2,
a Pilot Survey of Abell 963 and Abell 2192
Abstract
A pilot study with the new powerful backend of the Westerbork Synthesis Radio Telescope (WSRT) of two galaxy clusters at z=0.2 has revealed neutral hydrogen emission from 39 galaxies. At these redshifts, the WSRT provides an instantaneous velocity coverage of 18,054 km/s. The volume probed for each cluster is Mpc3, with spatial and velocity resolutions of 5486 kpc2 and 19.7 km/s, covering both clusters and the large scale structure in which they are embedded.
The spatial distribution of the H I detected galaxies is very different for the two clusters. In Abell 963, most of the gas rich galaxies are located to the northeast, at 13 Mpc from the cluster center in projection. Their velocities are slightly redshifted with respect to the cluster mean. This could be a gas rich group falling in from the front. Abell 2192 is less massive and more diffuse, with the gas rich galaxies more uniformly spread over a large region around the cluster. The H I masses of the detected galaxies range from 5109 to 41010 M⊙. Some H I rich galaxies are spatially resolved and rudimentary rotation curves are derived, showing the prospect for Tully-Fisher studies of different galaxy populations in these environments.
Only one galaxy is detected within a 1 Mpc radius from the center of the Butcher-Oemler cluster Abell 963, and none of the blue B-O galaxies which are all located within the central Mpc. The H I detected galaxies outside the central Mpc are of similar colour and magnitude as the non-detected B-O galaxies, indicating that the blue B-O galaxies are gas poor compared to their counterparts in the field.
keywords:
galaxy clusters: general , galaxy clusters: individual(Abell 963, Abell 2192), , , , ,
1 Introduction
The morphological mix of galaxy types is very different in the centers of clusters than in the field. Ellipticals and S0’s dominate in dense clusters, spirals and irregulars dominate elsewhere. Recent studies have shown that the galaxy population in clusters at intermediate redshifts evolves over relatively short timescales. Beyond z0.2, clusters have a larger fraction of blue galaxies, indicative of ongoing star formation; the so called Butcher-Oemler (B-O) effect (Butcher and Oemler, 1978). The morphological mix in clusters also changes with redshift. Although the fraction of ellipticals remains unchanged from z=1 to 0, clusters at z0.5 have a significant fraction of spirals and hardly any S0’s, while at z0.2 the situation is reversed (Dressler et al 1997, Fasano et al 2000, Lubin, Oke & Postman 2002). Recent data from the local universe, however, suggest that the changes occur more gradually. There are smooth gradients in star formation rate, gas content and morphological mix, out to several Mpc from the cluster centers (Goto et al 2003; Balogh et al 1998; Solanes et al 2001). There is an ongoing debate whether it is the cluster environment that drives the morphological evolution of galaxies or whether it is the field population, that continues to accrete onto clusters, that evolves with redshift.
Despite all these data, nothing is known about the actual gas content of cluster galaxies beyond z=0.08. The gas content is a critical parameter in environmentally driven galaxy evolution, since gas is the fuel for star formation. The main impediments to obtaining data on the H I content of galaxies at larger redshifts are the necessarily long integration times and the occurrence of man-made interference at those frequencies. So far, H I emission has been detected from only one galaxy at z=0.176 (Zwaan et al 2001).
However, if one samples a large volume and observes many galaxies at once, it would be worth the long integration. Radio synthesis telescopes, with their large field of view and high angular resolution, are the ideal instruments for this. One drawback of synthesis arrays has been their limited instantaneous velocity coverage, insufficient to cover the range of velocities usually seen in clusters (3000-5000 km/s). This has now changed with the new backend of the WSRT. In a single pointing, one can cover up to 18,000 km/s with sufficient resolution, probing the entire velocity range of the cluster and a very significant volume in front of and behind it. Such an observation would provide the much needed gas content of all cluster galaxies and simultaneously observe a control sample from the field. We have performed a pilot study for just such a survey.
We selected two clusters, known to be very different in their dynamical state and star formation properties. Abell 963, at z=0.206, has a velocity dispersion of 1350 km/s and is one of the nearest B-O clusters with a high fraction (19%) of blue galaxies (Butcher et al 1983). This massive lensing cluster is among X-ray selected clusters currently being studied at many wavelengths. A963 is unusually relaxed with less than 5% substructure (Smith et al 2005). Abell 2192, at z=0.188, has a velocity dispersion of 650 km/s and is more diffuse with significant substructure. A2192 has not been detected in X-rays.
2 Observations
Abell 963 was observed for 2012 hrs in February 2005, and Abell 2192 was observed for 1512 hrs in July 2005, each with a single pointing. The correlator was configured to give eight partially overlapping 10 MHz bands (IVC’s) with 256 channels per band and 2 polarizations per channel. The frequency range covered is 12201160 MHz. The main challenge in the data processing is the presence of low level radio frequency interference and we used a combination of visual inspection and various filtering algorithms to remove bad data. To calculate the bandpasses of the IVC’s, we used narrow median window filtered versions of the spectra of the flux calibrators, and applied these corrections to the cluster data. A linear fit in frequency was then made to the UV data and data deviating by more than 8 were clipped. The data from all 8 IVCs were combined into a single datacube for each cluster, comprising 1600 channels. The typical rms noise levels per frequency channel are 68 Jy/beam at 1178 MHz for A963, and 91 Jy/beam at 1196 MHz for A2192. After Hanning smoothing, the restframe velocity resolution is 19.7 km/s while the synthesized beam is 1727 arcsec2 at 1190 MHz.
In search of H I emission, we smoothed the data to a restframe velocity resolution of 40 km/s and visually inspected both datacubes. We have identified 20 H I detections in the field of A963, and 30 in that of A2192. Subsequently, we searched the Sloan Digital Sky Survey for optical counterparts within the synthesized beam and found 17 objects for A963 and 22 for A2192. We consider these 39 H I detections as secure and the remaining 11 as tentative. Based on the local H I mass function (Zwaan et al 2003), the surveyed volume, the achieved noise levels, and a homogeneous distribution of galaxies, the predicted number of detected galaxies is 22 for A963 and 17 for A2192. Therefore, the observed detection rate in our pilot data is as expected.
3 Results
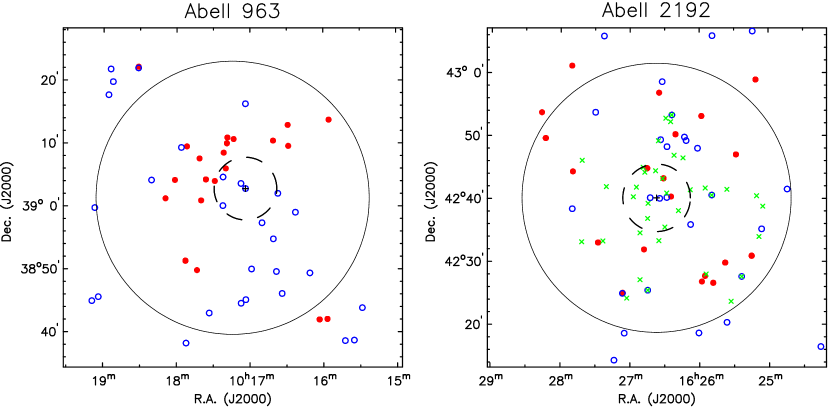
Figure 1 shows the distributions of H I detected galaxies on the sky (filled circles) which are very different for the two clusters. The gas rich galaxies in the field of A963 are strongly clustered toward the northeast; many gas-rich galaxies are within a projected distance of 3 Mpc from the cluster center, but only one galaxy is detected within 1 Mpc. In the field of A2192, the gas rich galaxies are more uniformly distributed over the surveyed area. This difference in the spatial distributions is to some extent also reflected in the velocity distribution of the H I detected galaxies. The H I rich galaxies in A963 are more strongly clustered in velocity, and slightly redshifted with respect to the cluster mean. Most likely, this is a group of gas rich galaxies falling into A963 from the front.
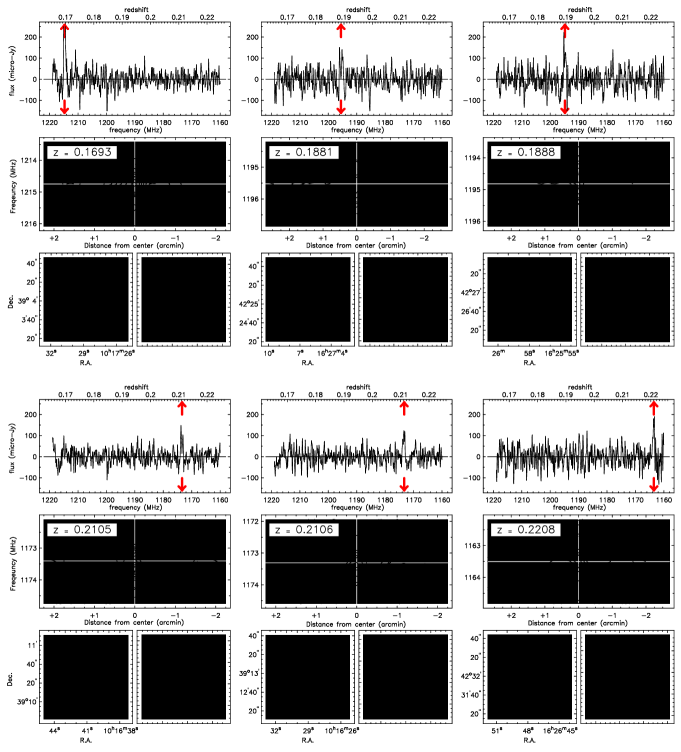
Figure 2 shows examples of data on individual galaxies at increasing redshifts. The individual H I detections have H I masses between 5109, close to our detection limit, and 41010 M⊙. Depicted are a small group of interacting galaxies in the foreground of A963 (upper left), several spatially resolved galaxies at the redshifts of the clusters, and a background galaxy in the field of A2192 (lower right). The latter represents the highest redshift H I emission detected to date. Although the synthesized beam is rather large, the galaxies are clearly resolved both kinematically and spatially. The position velocity diagrams show rudimentary rotation curves and look promising for future Tully-Fisher studies of galaxies in different environments. Note that some of the optical images show disturbed galaxies and several seem to have close companions.
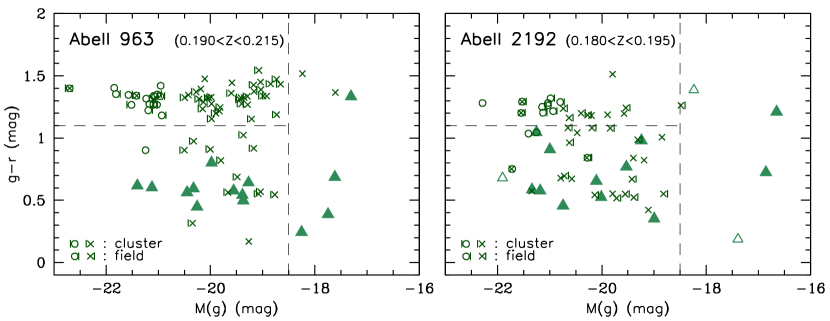
Figure 3 shows SDSS-based colour-magnitude diagrams for all galaxies with various optical (circles and crosses) and HI (triangles) redshifts within the velocity range of the clusters. For A963, the red sequence and blue cloud can be clearly discerned, but for A2192 the red sequence is less obvious. The optical magnitudes and colours of the H I detected galaxies are similar to those of the blue galaxies with optical redshifts in both fields. Although none of the blue galaxies in the center of A963 are detected in H I, those that are detected in H I outside the centers have similar magnitudes and colours as the blue B-O galaxies. This suggests that it is the location of the blue B-O galaxies that affects the H I detection rate.
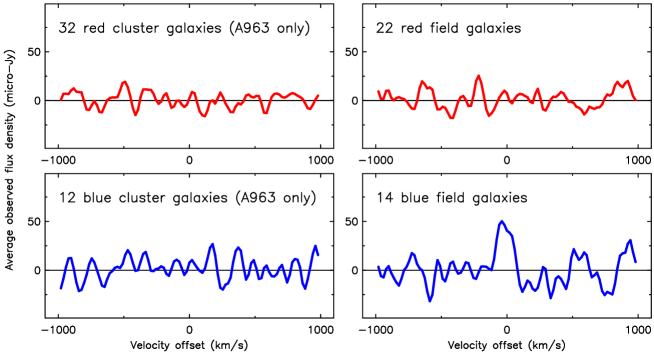
We can probe even deeper by stacking the H I spectra of galaxies with known optical redshifts. This is done separately for the blue and red galaxies of Lavery and Henry (1986) in the central Mpc of A963, and for the red and blue galaxies in both fields. The stacked spectra are shown in Figure 4. Even in the stacked spectra there is no statistical detection of the blue B-O galaxies in the central Mpc of A963. In contrast, the blue galaxies in the fields outside the central Mpc do show a statistical detection in the stacked H I spectra.
4 Discussion
We present the results of a pilot study to demonstrate the feasibility of an H I emission line survey at z=0.2. Our detection rate and achieved noise levels show that it is now entirely feasible to do deep searches for H I in emission at cosmologically interesting distances. While our detection rate is similar for both clusters, the distribution of the H I detections is more highly clustered for the dense B-O cluster. Most noticeably, in A963 we detect 17 gas rich galaxies outside a radius of 1 Mpc from the cluster center, and only one just within that radius. At the same time we know that A963 has a significant fraction of blue galaxies in its central region. Our stacked H I spectra suggest that the blue B-O galaxies have significantly smaller H I masses (on average) than similar blue galaxies outside the central Mpc. Since the H I detected galaxies are of similar colour and magnitude as the non-detected B-O galaxies in the central region, we conclude that it is the location that matters. These results are at odds with recent claims that the B-O effect predominantly occurs in subclusters and groups (Kodama et al 2001, Tran et al 2005). Although we can not rule out projection effects, the most straight forward interpretation of our results is that the blue B-O galaxies have lost (a significant fraction of) their gas when they came to within 1 Mpc of the center of A963.
Our final survey will probe a huge volume around each cluster down to an H I mass limit of 8108 M⊙. We expect to detect hundreds of galaxies in the clusters and the large scale structure in which they are embedded. This will give the first optically unbiased H I survey at z=0.2 with enough sensitivity to detect even galaxies like the LMC in a volume similar to that of the entire local Universe out to 25 Mpc.
The WSRT is operated by the ASTRON with support from the Netherlands Foundation for Scientific Research (NWO). This work was partially supported by an NSF grant to Columbia University. We are grateful to R. Lavery for providing unpublished redshifts of galaxies in A963. The full SDSS acknowledgement can be found at http://www.sdss.org.
References
- Balogh et al (1998) Balogh, M.L., Schade, D., Morris, S. et al 1998, ApJL, 504, L75
- Butcher et al (1983) Butcher, H., Wells, D.S. & Oemler, A. Jr. 1983, ApJ Suppl, 52, 183
- Butcher and Oemler (1978) Butcher, H. & Oemler, A. Jr. 1978, ApJ, 219, 18
- Dressler et al (1997) Dressler, A.,Oemler, A. Jr., Couch, W.J, et al 1997, ApJ, 490, 577
- Fasano et al (2000) Fasano, G., Poggianti, B.M., Couch, W.J. et al 2000, ApJ, 542, 673
- Goto et al (2003) Goto, T., Yamauchi, C., Fujita, Y. et al 2003, MNRAS, 346, 601
- Kodama et al (2001) Kodama, T, Smail, I., Nakata, F. et al 2001, ApJL, 562, L9
- Lavery and Henry (1986) Lavery, R.J. & Henry, J.P. 1986, ApJL, 304, L5
- Lubin et al (2002) Lubin, L.M., Oke, J.B., & Postman, M. 2002, AJ, 124, 1905
- Smith et al (2005) Smith, G.P., Kneib, J.-P., Smail, I. et al 2005, MNRAS, 359, 417
- Solanes et al (2001) Solanes, J.M., Manrique, A., Garcia-Gomez, C. et al 2001, ApJ, 548, 97
- Tran et al (2005) Tran, K.-V., van Dokkum, P.G., Illingworth, G.D. et al 2005, ApJ, 619, 134
- Zwaan et al (2001) Zwaan, M.A., van Dokkum, P.G. & Verheijen, M. 2001, Science, 293, 1800
- Zwaan et al (2003) Zwaan, M.A., Staveley-Smith, L., Koribalski, B.S. et al 2003, AJ, 125, 2842