XMM-Newton and Chandra Spectroscopy of the Variable High-Energy Absorption of PG 1115+080: Refined Outflow Constraints
Abstract
We present results from multi-epoch spectral analysis of XMM-Newton and Chandra observations of the mini broad absorption line (BAL) quasar PG 1115+080. This is one of the few X-ray detected mini-BAL quasars to date that is bright enough in the X-ray band, mostly due to large gravitational-lensing magnifications, to allow in-depth spectral analysis. The present XMM-Newton observations of PG 1115+080 have provided the highest signal-to-noise X-ray spectra of a mini-BAL quasar obtained to date. By modeling the spectra of PG 1115+080 we have obtained constraints on the column density and ionization state of its outflowing absorbing gas. A comparison between these constraints over several epochs indicates significant variability in the properties of the outflowing absorbers in PG 1115+080. The depths of the high-energy broad absorption features in PG 1115+080 show a significant decrease between the first two observation epochs separated by a rest-frame timescale of 1 year. This variability supports the intrinsic nature of these absorbers. Assuming the interpretation that the high-energy absorption features arise from highly ionized Fe XXV we constrain the fraction of the total bolometric energy released by quasars PG 1115+080 and APM 08279+5255 into the IGM in the form of kinetic energy to be (68% confidence), and , respectively. According to recent theoretical studies this range of efficiencies is large enough to influence significantly the formation of the host galaxy and to regulate the growth of the central black hole.
1 INTRODUCTION
In recent years there has been mounting evidence from both theoretical and observational studies for the importance of quasar outflows in regulating the growth of supermassive black holes, controlling the formation of host galaxies, and enriching the Intergalactic Medium (IGM). Models of structure formation in a -CDM cosmology are not consistent with observations unless feedback, either from star formation or active galactic nuclei, is included in the simulations. Recently, the potential importance of quasar outflows has been explicitly demonstrated in theoretical models of structure formation and galaxy mergers that incorporate the effects of quasar outflows [e.g., Scannapieco & Oh 2004 (SO04); Granato et al. 2004 (G04); Springel, Di Matteo, & Hernquist 2005 (SDH05); Hopkins et al. 2005, 2006]. A basic assumption in the models of SO04 is that all quasars host outflows. SO04 find that by choosing the fraction of the total bolometric energy released over a quasar’s lifetime into the Interstellar Medium (ISM) and IGM in the form of kinetic energy to be =0.05, they can successfully model the observed evolution of the -band quasar luminosity function between redshifts of 0.25 and 6.25. In a recent study SDH05 simulated the growth of black holes in gas-rich galaxies with and without the presence of accretion feedback. The feedback in their model is thought to occur through energetic quasar outflows that interact with the gas of the host galaxy. It is assumed that about 5% of the radiated luminosity is thermally coupled via these outflows to the surrounding gas. They find that the growth of the black-hole mass is self-regulated and eventually saturates at a final value that depends on the initial amount of gas available for accretion. These authors also found that feedback from stars and quasars in their simulations of galaxy mergers can heat and expel gas from the centers of the merged galaxies. This loss of gas during the final stages of the merger can halt nuclear starburst activity and cause the merger galaxy to become a gas-poor elliptical.
With the advent of XMM-Newton and Chandra it has become possible to infer the kinematic and ionization properties of highly ionized X-ray absorbers in Seyfert 1 galaxies (e.g., Kaspi et al. 2002; Kaastra et al. 2002; Netzer et al. 2003). Approximately 60% of Seyfert 1 galaxies show outflowing X-ray and UV absorption by ionized gas with velocities up to 2,500 km s-1 (e.g., Crenshaw et al. 1999; Kriss 2002). The absorbing outflow properties of more luminous quasars appear to differ in several ways from those of Seyfert 1s. The fraction of occurrence of X-ray and UV absorption has been reported to be lower in quasars (e.g., Ganguly et al. 2001; George et al. 2002); however, the claims for a lower occurrence of X-ray absorption have been challenged by Porquet et al. (2004) who find that about half of their sample of 21 low-redshift PG quasars harbor ionized absorbers. UV spectroscopic observations indicate that about 20% of quasars show broad absorption lines blueward of their resonant UV emission lines (e.g., Hewett & Foltz 2003). Outflow velocities of the UV absorbers in BAL quasars have been found to be as high as 60,000 km s-1.
Recent X-ray observations of the mini-BAL quasar PG 1115+080 and BAL quasar APM 08279+5255 have suggested the presence of relativistic outflows of highly ionized (ionization parameter of the order of ) absorbing material detected in the iron region ( keV) with velocities of up to 0.4 (Chartas et al. 2002, 2003). The inferred hydrogen column densities ranging between 1022-23 cm-2 and relativistic velocities of these outflowing X-ray absorbers imply mass-outflow rates that are comparable to the estimated accretion rates. The presence of massive, highly ionized, and high-velocity outflows from quasars indicates that these winds may be providing significant feedback to the surrounding gas. Additional observational evidence to support the presence of quasar feedback came with the detection of high-velocity blueshifted absorption-line features in the X-ray spectra of several quasars and Narrow-Line Seyfert 1 galaxies (Reeves et al. 2003; Pounds et al. 2003a, 2003b). We note, however, that some of these claims have been disputed in recent re-analyses of the data (e.g., Kaspi & Behar 2006; McKernan et al. 2004, 2005).
The relatively small velocity spread observed for the UV absorption in PG 1115+080, compared to the typical range of 5,000 – 25,000 km s-1 observed in BAL quasars, suggests that PG 1115+080 be classified as a mini-BALQSO (Turnshek 1988; Barlow, Hamann, & Sargent 1997). We will consider PG 1115+080 as a mini-BAL throughout this paper with the following model in mind. According to the ”unification” model for BAL quasars most quasars have outflowing winds, however, BAL and mini-BAL quasars correspond to quasars with relatively large inclination angles. In particular, in BAL quasars it is commonly thought that our line of sight intersects a large portion of the outflowing absorber whereas in mini-BAL quasars our line of sight intersects a shorter portion. According to this model mini-BAL quasars would be expected to have smaller absorbing columns, and smaller velocity gradients than traditional BAL quasars.
In this work we present recent results from monitoring X-ray observations of the mini-BAL quasar PG 1115+080 ( = 1.72). The goal of these observations was to monitor the time variability of the absorption features and thereby constrain the kinematic, ionization, and absorption properties of the quasar outflows in this X-ray-bright mini-BAL quasar. Such constraints will allow us to estimate the contribution of quasar winds to the enrichment of the ISM and IGM and obtain a better understanding of the connection between black-hole and bulge growth in the host galaxy.
Throughout this paper we adopt a -dominated cosmology with = 70 km s-1 Mpc-1, = 0.7, and = 0.3.
2 OBSERVATIONS AND DATA ANALYSIS
PG 1115+080 was observed with XMM-Newton (Jansen et al. 2001) on 2001 Nov 25, 2004 June 10, and 2004 June 26, for 62.9 ks, 81.2 ks and 86.3 ks, respectively. It was also observed with the Advanced CCD imaging Spectrometer (ACIS; Garmire et al. 2003) on board the Chandra X-ray Observatory (hereafter Chandra) on 2000 June 2 and 2000 Nov 3 for 26.8 ks and 10.0 ks, respectively. The spectral analysis of the Chandra observations of PG 1115+080 has been presented in Gallagher et al. (2002) and Chartas et al. (2003). Because of recent significant improvements in the calibration of the instruments on board Chandra and XMM-Newton since the publication of thePG 1115+080 results, we have re-analyzed all observations. Updates on the calibration of Chandra and XMM-Newton are reported on the Chandra X-ray Center (CXC) and XMM-Newton Science Operations Centre (SOC) World Wide Web (WWW) sites, respectively.111The WWW sites listing the updates are located at http://asc.harvard.edu/ciao/releasenotes/history.html and http://xmm.vilspa.esa.es/external/xmm_sw_cal/calib/rel_notes/index.shtml, respectively. We analyzed the XMM-Newton data for PG 1115+080 with the standard analysis software SAS version 6.1 provided by the XMM-Newton SOC. The Chandra observations of PG 1115+080 were analyzed using the standard software CIAO 3.2 provided by the CXC. A log of the observations that includes observation dates, observed count rates, total exposure times, and observational identification numbers is presented in Table 1. We note that the count rate and total number of counts (31,430 counts from the three XMM-Newton observations) for PG 1115+080 are the highest of any mini-BAL quasar X-ray spectrum observed to date.
For the reduction of the XMM-Newton observations we filtered the PN (Strüder et al. 2001) and MOS (Turner et al. 2001)
data by selecting events corresponding to instrument PATTERNS
in the 0–4 (single and double pixel events) and 0–12 ranges, respectively.
Several moderate-amplitude background flares were present
during the XMM-Newton observations of UM 425 and PG 1115+080.
The PN and MOS data were filtered to exclude times when the full-field count rates
exceeded 20 cnts s-1 and 4 cnts s-1, respectively.
The extracted spectra from the PN and MOS
were grouped to obtain a minimum of 100 and 40 counts, respectively, in each energy bin,
allowing use of statistics.
Background spectra for the PN and MOS detectors were extracted
from source-free regions near UM 425 and PG 1115+080.
The PN and MOS spectra were then fitted
simultaneously with a variety of models employing
XSPEC version 11.3 (Arnaud 1996). The energy ranges used for fitting the PN and MOS
data were 0.2–10 keV and 0.4–9 keV, respectively.
For the reduction of the Chandra observations we used standard CXC threads to screen the data for status, grade, and time intervals of acceptable aspect solution and background levels. The pointings of the observatory placed PG 1115+080 on the back-illuminated S3 chip of ACIS. To improve the spatial resolution we removed a 025 randomization applied to the event positions in the CXC processing and employed a sub-pixel resolution technique developed by Tsunemi et al. (2001).
In both the XMM-Newton and Chandra analyses we tested the sensitivity of our results to the selected background and source-extraction regions by varying the locations of the background regions and varying the sizes of the source-extraction regions. We did not find any significant change in the background-subtracted spectra. For all models of PG 1115+080 we included Galactic absorption due to neutral gas with a column density of =3.5 1020 cm-2(Stark et al. 1992). All quoted errors are at the 90% confidence level unless mentioned otherwise with all parameters conservatively taken to be of interest except absolute normalization.
2.1 Spectral Analysis of the XMM-Newton Observations of PG 1115+080.
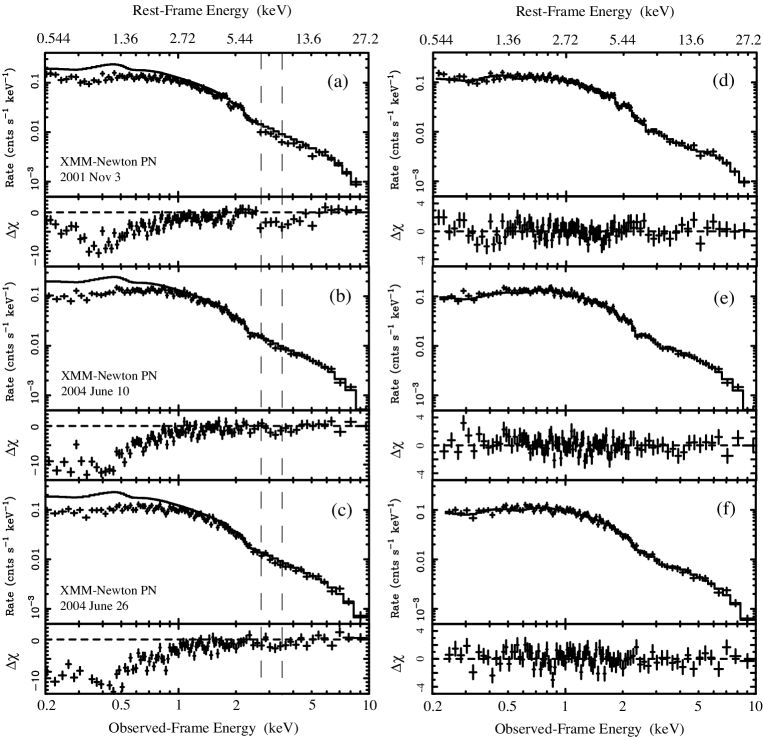
We first simultaneously fitted the PN, MOS1 and MOS2 spectra of PG 1115+080 at each of the three epochs with a model consisting of a power law with neutral intrinsic absorption at (model 1 of Table 2). These fits support the presence of an intrinsic absorber with column densities of = 2.2 1021 cm-2, 4.6 1021 cm-2, and 2.9 1021 cm-2, for the three XMM-Newton observations of PG 1115+080. The fits are not acceptable in a statistical sense (see the reduced values in Table 2). The fit residuals show significant absorption at observed-frame energies of 2.5–5 keV. To illustrate the presence of these features and absorption features below 0.6 keV, we fit the spectra from observed-frame 2–2.5 keV and 5–10 keV with a power-law model (modified by Galactic absorption) and extrapolated this model to the energy ranges not fit (see Figure 1). For clarity we only show the higher S/N ratio PN data in Figure 1; however, all fits were performed simultaneously using the PN and MOS1+2 data unless mentioned otherwise. The lower panels in Figure 1 show the residuals between the best-fit power-law model and the PN data. We note that the apparent variability in the amplitude of the absorption features is not due to variations in the best-fit value of for the spectral fits performed within the observed-frame ranges of 2–2.5 keV and 5–10 keV. The best-fit values of the photon indices for epochs 1, 2 and 3 were , , and . For the purpose of comparing the absorption residuals between epochs the photon indices for epochs 1, 2, and 3 were set to = 1.9. We proceed in fitting a variety of models to the data guided by the shape and location of these identified absorption residuals. As our first refinement we considered an absorbed power-law model with Gaussian absorption lines near the absorption features appearing between observed-frame energies of 2 and 5 keV (see model 2 of Table 2). Hereafter, we refer to these absorption features as and . The fits to the spectra of PG 1115+080 for epochs 1 and 2 contained two absorption lines, and the fits for epoch 3 contained one absorption line. The inclusion of these absorption lines in model 2 resulted in significant improvements of the fits compared to the previous ones in model 1 at the 99.9%, 99.2% and 93.6% confidence levels (according to the -test) for epochs 1, 2 and 3, respectively.
The remaining most significant contributions to the large values of for model 2
arise from the residuals below 0.6 keV.
To model these residuals we replaced the neutral absorber in our spectral model
with an ionized intrinsic absorber (see model 3 of Table 2).
These low-energy residuals are commonly detected in moderate
S/N spectra of BAL quasars and are thought to
arise from absorption by multiple ions of O, Ne, Na, Mg, and Fe and/or partial covering.
In particular, we used the absori model contained in
XSPEC (Done et al. 1992).
We note that the absori model is just
a first approximation to what is likely a more complex situation.
The temperature of the ionized absorber is not calculated
self-consistently by proper thermal balance in
the absori model but considered as an input parameter.
We found a significant improvement in fit quality at the 99.9%
confidence level according to the -test (see model 3 of Table 2).
The best-fit rest-frame energies and widths
of the absorption features for model 3 for epochs 1, 2 and 3 are listed in Table 2.
We note that the best-fit energies of these features are quite stable
when trying different models for the low-energy spectral complexity.
As an independent check of the accuracy of the fits that used the absori model we also
repeated several of these fits using the warm absorber model XSTAR.
XSTAR calculates the physical conditions and emission spectra of photoionized gases.
In the current analysis we use a recent implementation of the XSTAR model that can be used within
XSPEC.
We found that the best-fit parameters of the low-energy ionized absorber derived using the XSTAR model
were consistent with the values found using the absori model.
We performed fits to the spectra of PG 1115+080 at the three epochs using both absori and XSTAR
to compare results and performed the estimates of the confidence contours of
the best-fit parameters using the more time-efficient absori model.
We investigated whether the observed flux variability of the high-energy absorption features was consistent with a decrease in the strength of two absorption lines used to model the absorption features. The energies and widths of the absorption lines were held fixed between epochs. Specifically, we performed a simultaneous fit to all epochs incorporating model 2 of Table 2 with the difference that the energies and widths of the absorption lines were constrained to be the same and only the normalizations of the absorption lines were allowed to vary. These fits were performed in the 1–10 keV band of the higher S/N PN data. We obtained a of 137.1 for 137 dof, and the best-fit rest-frame energies of the lines were 7.5 0.3 keV and 10.0 0.4 keV. Allowing the energies and widths of the lines to vary resulted in a similar of 132.0 for 129 dof. We note that for the fits where the energies and widths were constrained to be the same between epochs we found that the best-fit values of the optical depths for the absorption lines at 7.5 keV were consistent with zero for epochs 2 and 3. This was expected since an inspection of Figure 1 indicates that there are no residuals for epochs 2 and 3 near the rest-frame energy of 7.5 keV (left vertical dashed line) . We conclude that the strengths of the absorption lines for epochs 2 and 3 are too weak to infer any variability of their energies or widths.
We next replaced the ionized absorber with a partial-covering model and repeated the fits for each epoch. We find that fits that include partial-covering (see model 4 of Table 2) provide values and quality-of-fit parameters comparable to those that included an ionized absorber. Models that included absorption edges for the high-energy absorption features of PG 1115+080 for epoch 1 were considered and rejected in the current analysis, that includes the new calibration, as previously found in Chartas et al. (2003). The basic problem with such edge models is that, for plausible iron abundances, they predict too much absorption at low energies. The inclusion of a broad (width allowed to vary in fits) Fe K emission line in all models in Table 2 for epoch 1 resulted in larger reduced values compared to those with no line included; therefore, there is no evidence for statistically significant Fe emission. We also tested the sensitivity of the best-fit parameters to the energy ranges used for fitting the PN data by varying the low-energy boundary of the fits from 0.2 keV to 0.4 keV. We did not find any significant change in the parameters of the high-energy absorption lines. The exclusion of the 0.2–0.4 keV PN data, however, did result in slightly poorer constraints on the ionization parameter of the gas causing the low-energy absorption. A detailed description of the current calibration status of the XMM-Newton instruments can be found on the XMM-Newton SOC WWW site. A recent energy-dependent re-working of the PN response has resulted in a significant improvement in the calibration down to 0.2 keV and brings the PN and MOS detectors into better agreement.
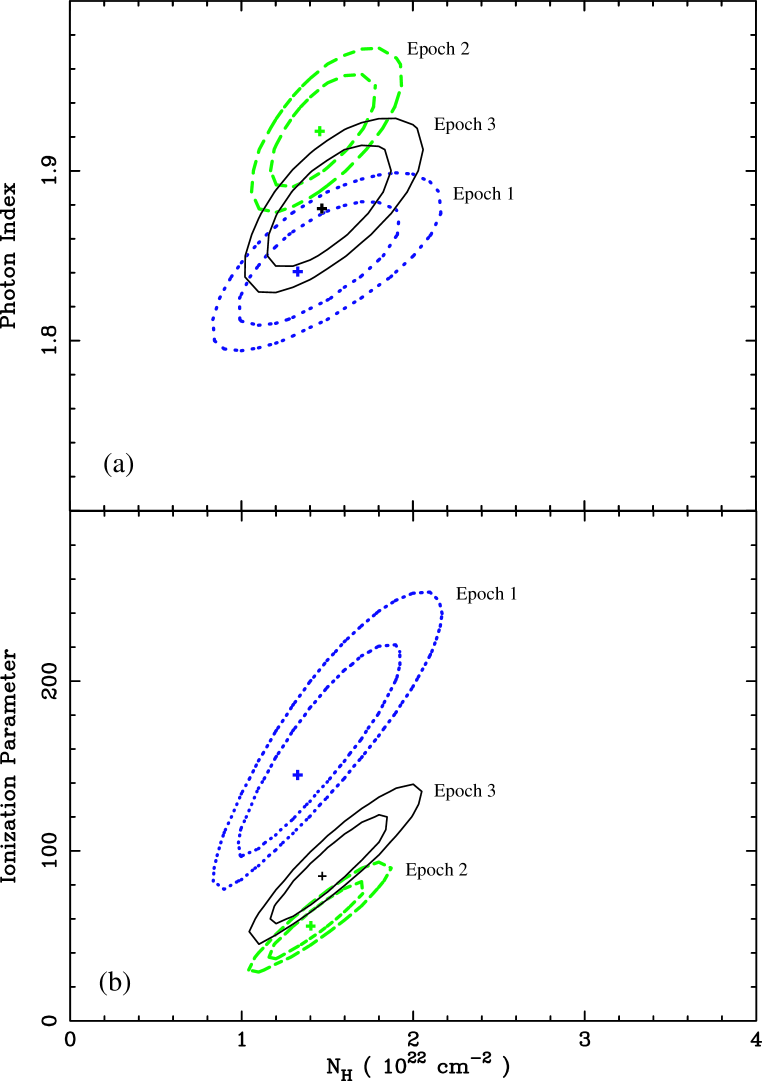
In Figure 2a we show the 68% and 90% confidence contours (based on model 3 of Table 2) for the photon indices versus column densities for the three epochs. The column densities for the low-energy absorbers in models 3 and 4 are consistent with no variation. A possible weak variation of the photon index between epochs 1 and 3 is detected. 68% and 90% confidence contours for the ionization parameter of the low-energy absorber versus column density are presented in Figure 2b. The absorber in PG 1115+080 appears to have been more ionized during epoch 1. In particular, during epoch 1 the ionized absorber is characterized by an ionization parameter of erg cm s-1 and a hydrogen column density of 1022 cm-2, and during epoch 2 by erg cm s-1 and a hydrogen column density of 1022 cm-2, where is the integrated 5 eV–300 keV incident luminosity, is the electron number density of the absorber, and is the distance between the absorber and ionizing source.
Figure 2 suggests that the ionization parameter decreased in the order of epochs 1, 3, and 2. This trend in ionization parameter is evident in the PN data shown in Figure 1. For epoch 1, as shown in Figure 1a, the spectrum at low energies 0.2–0.4 keV appears less absorbed relative to epochs 2 and 3, as expected for a more highly ionized absorber where the opacity from low-z metals is smaller. Additional confirmation for the trend in ionization parameter is provided in §3.1.
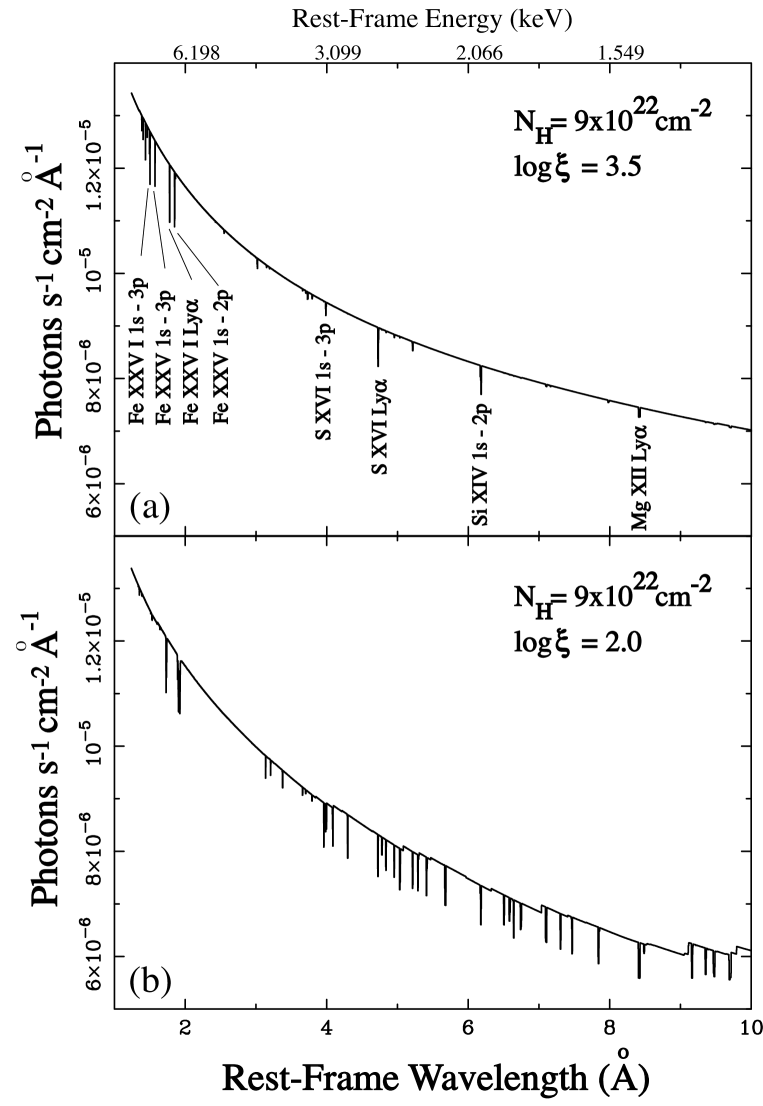
Our spectral analysis of PG 1115+080 implies the existence of two distinct absorbers with very different ionization parameters. In particular, if we interpret the apparent detection of absorption lines at rest-frame energies of 7.27 keV and 9.79 keV as being due to Fe, the most conservative assignment (giving the lowest outflowing velocity) is to highly ionized Fe XXV which requires . In contrast, the significant absorption features below rest-frame energies of 1.6 keV are best fit with an ionization parameter of the order of (see Table 2). A justification of the interpretation of the absorption lines is given in §3 and presented in more detail in Chartas et al. (2002, 2003). To illustrate better the absorption lines that can arise at these two distinct ionization levels we show in Figure 3 the expected absorption spectrum of PG 1115+080 in the rest-frame range as derived with the photoionization code XSTAR assuming a slab-like stationary absorber with = 9 1022 cm-2, , and . The assumed column density of 9 1022 cm-2 lies between the estimated values of the column densities of the high ionzation absorbers of PG 1115+080 listed in Table 4. At ionization levels of and rest-frame wavelengths in the range 1.5–2 Å (see panel a of Figure 3) the Fe lines are quite isolated and are therefore apparent even with low-resolution spectroscopy. At rest-frame wavelengths in the range of 6.2–10 Å and at ionization parameters of the spectra contain a larger density of strong absorption lines that are difficult to resolve and identify (see panel b of Figure 3).
The derived column densities for the low-ionization absorber of PG 1115+080 (see Table 2) for the three epochs described in this paper are lower than those found in X-ray observations of typical BAL quasars. For example, the column densities of BAL quasars as inferred from X-ray observations lie in the range of 0.4–250 1023 cm-2 (e.g., Gallagher et al. 2002 and Punsly 2006 present BAL-quasar column densities derived from X-ray observations). We emphasize that most current column-density estimates derived from X-ray observations are poorly constrained due to the limited S/N of most existing X-ray spectra of BAL and mini-BAL quasars. The presence of ionized or partially covering absorption cannot be accurately inferred from the analysis of individual X-ray spectra of most BAL quasars and if present would in general lead to an underestimate of the column densities. On the other hand, the large lensing magnifications of APM 08279+5255 and PG 1115+080 have provided moderate S/N X-ray spectra for these objects resulting in improved constraints compared to unlensed quasars. We note that the column density of PG 1115+080 appears to have varied significantly since an earlier observation. Specifically, during a ROSAT PSPC observation of PG 1115+080 on 21 November 1991 the 0.2–2 keV X-ray flux of this object was found to be at a minimum level (low-state) of about 0.4 10-13 erg s-1 cm-2 (see Figure 6 of Chartas 2000) and the intrinsic column was constrained to be 1.2 1.1 1023 cm-2. This column density is consistent with the typical values observed in BAL quasars. We estimated the optical-to-X-ray spectral slope, quantified as (Tananbaum, et al. 1979), where and are the flux densities at 2 keV and 2500 Å in the quasar rest-frame, respectively. For the cases of unabsorbed(absorbed) flux densities at 2 keV for the epoch 1 XMM-Newton observation of PG 1115+080 we find = -1.63(-1.67). We note that from the absorbed flux density at 2 keV for the 1991 ROSAT PSPC observation (low-state) of PG 1115+080 we find = -1.97. Due to the limited quality of the ROSAT PSPC spectrum useful constraints on the unabsorbed value of could not be obtained for the 1991 observation. For comparison the value of expected for a typical AGN with a 2500 Å luminosity density similar to that of the epoch 1 observation of PG 1115+080 based on the recent empirical relation of Steffen et al. 2006 (see equation 2 of Steffen et al.) is = -1.58. The rms of at = 30.8 is about 0.2 (see Table 5 of Steffen et al.). We conclude that PG 1115+080 is slightly X-ray weak during the three observation epochs presented in this paper but still within the scatter of detected in typical AGN.
3 DISCUSSION
Our analyses of the Chandra and XMM-Newton spectra of PG 1115+080 and APM 08279+5255 presented here and in the discovery papers of Chartas et al. (2002, 2003) indicate that the high-energy broad absorption features detected in these objects are significant at the 99.9% confidence level. Our claimed detections of relativistic winds in the X-ray spectra of PG 1115+080 and APM 08279+5255 were based on the following steps:
a) We chose a standard approach to fitting the X-ray spectra of PG 1115+080 and APM 08279+5255. In particular, we first started with a simple model and added components of increasing complexity motivated both by the residuals of the spectral fits and our understanding of the physics and structure of mini-BAL and BAL quasars. The first model consisted of a simple power-law modified by intrinsic absorption. This choice was inspired by numerous empirical and theoretical studies that indicate that the main X-ray continuum emission component of quasars (e.g., rest-frame 2–30 keV) is produced by inverse Compton scattering of soft photons from the accretion disk by hot electrons in a corona (e.g., Haardt & Maraschi 1991; Reeves & Turner 2000). An inspection of the residuals to fits with simple absorbed power-law models indicated the presence of significant complex absorption residuals at rest-frame energies above 6.4 keV and rest-frame energies below 1.5 keV.
b) To account for these fit residuals we considered a variety of spectral models. Several of these models were rejected in the discovery papers and this work. The list of rejected models includes the following: Broken power-law models with and without a soft blackbody component, models that included one and two absorption edges to account for the high-energy absorption, models that included neutral absorption at the source to account for the low-energy absorption, and absorption by possible intervening material to account for the high-energy absorption. Single and double partial-covering models that try to fit the high-energy features of PG 1115+080 with iron edges require a curvature of the low-energy continuum that is inconsistent with our data. Additional data would be required to rule out even more complex partial-covering models.
c) Motivated by the structure of the low and high-energy residuals, the fact that PG 1115+080 and APM 08279+5255 exhibit broad absorption lines in the UV (e.g., the properties of the UV broad absorption lines in PG 1115+080 and APM 08279+5255 have been presented in Michalitsianos et al. (1996) and Irwin et al. (1998), respectively), and previous claims of detections of low-energy ionized absorption in the X-ray spectra of BAL quasars, we fitted the spectra with a model that consisted of a power-law modified by ionized absorption at the source and two iron lines at the source to account for the high-energy absorption. This model produced acceptable fits to the X-ray spectra of PG 1115+080 and APM 08279+5255 and resulted in a significant improvement over all other models considered. We note that models that included high-energy absorption lines in PG 1115+080 and APM 08279+5255 resulted in improvements in the fits compared to models that did not include absorption lines at the greater than 99.9% confidence level. In the present work we also confirm this significant detection by re-analyzing the same data with updated instrumental calibration files.
d) We made a plausibility argument based on the energies of the identified lines, and the known energies of absorption lines from all the abundant elements, that the detected absorption lines are associated with highly ionized Fe K absorption. Based on this identification we estimated the velocities of the outflowing X-ray absorbing material.
Several of the key derivations that follow in this section assume our interpretation that the high-energy absorption is due to lines arising from highly ionized Fe XXV and/or Fe XXVI and that the outflow velocities of these absorbers range between 0.1 and 0.4. Here we provide a summary of our justification of this interpretation that was presented in more detail in Chartas et al. (2002, 2003).
Our analyses of the Chandra spectrum of APM 08279+5255 and the XMM-Newton spectrum of PG 1115+080 showed strong evidence for the presence of absorption lines at rest-frame energies of 8.05 keV and 9.79 keV for APM 08279+5255 and rest-frame energies of keV and keV for PG 1115+080. For APM 08279+5255 we assumed that the two lines are produced by resonant absorption due to Fe xxv 1s–2p (Fe XXVI Ly), and inferred that the X-ray absorbers are outflowing with velocities of (0.15) and (0.36), respectively. For PG 1115+080 we assumed that the high energy absorption is due to two lines produced by resonant absorption due to Fe xxv 1s–2p (Fe XXVI Ly), and inferred that the X-ray absorbers are outflowing with velocities of (0.05) and (0.36), respectively. The wind geometry that we assume is based on the unified BAL model (e.g., Weymann et al. 1991; Murray et al. 1995; Proga 2000; Elvis 2000). In this model the AGN outflow originates in the accretion disk from a narrow range of radii. This wind rises initially almost perpendicular to the accretion disk and becomes more radial and equatorial at larger radii to form a bi-cone. The unified BAL model proposes that most of the observed range of absorption line-widths can be explained with orientation and with a velocity gradient in the outflowing stream. The hydrodynamical models of Proga et al. (2000) indicate that the density of the wind peaks near an inclination angle of about 70 degrees and most of the outflow is confined within 10 degrees of this angle. We note that Proga & Kallman (2004) showed that the wind inclination angle can be smaller and the wind does not need to be equatorial if it is mostly driven by UV radiation from the accretion disk.
For the velocity calculations we considered the special-relativistic velocity correction and assumed that the angle between the wind velocity and our line of sight is 20∘. This angle is not constrained with the present data; however, hydrodynamical simulations indicate that the BAL wind divergence angle may range between 10∘–30∘ depending on the location of the inner radius of the disk. The velocity estimates are not sensitive to this range of angles. For example, the inferred outflow velocity (assuming 20∘) for the 9.79 keV absorption line detected in PG 1115+080 would vary from 6% to 13% for ranging between 10∘–30∘.
Of all the abundant elements, iron absorption lines would be the closest in energy to the observed features. As shown in Figure 3 the strongest lines with rest-frame energies indicated in parenthesis near the observed ones are: Fe XXV 1s–2p (6.7 keV), Fe XXV 1s–3p (7.88 keV), Fe XXVI Ly (6.97 keV), Fe XXVI 1s–3p (8.25 keV), S XV 1s–2p (2.46 keV), S XVI Ly (2.62 keV) Si XIV Ly (2.005 keV), Ar XVIII Ly (3.321 keV), and Ca XX Ly (4.104 keV) (based on the energies of permitted resonance lines of Verner et al. 1996). In this sense, our interpretation that the absorption lines are associated with highly ionized Fe K absorption is the most conservative one possible (e.g., absorption lines from relativistic sulfur or oxygen would require much larger blueshifts). We also investigated whether intervening absorbers in the lens galaxies or in possible damped Lyman alpha systems along the line of sight could explain the high-energy absorption features. We concluded that the observed high-energy absorption features cannot be produced by absorption in intervening systems and the most likely origin is intrinsic absorption by highly ionized iron. The intrinsic origin of the absorption has been confirmed with the detection of significant flux variability of the absorption features in APM 08279+5255 (see Figure 7 in Chartas et al. 2003) and now with the detection of significant variability in PG 1115+080 (see Figure 4) as discussed in more detail in §3.1. From the present data we can infer significant variability of the normalization of the absorption lines, however, higher quality spectra will be required to distinguish if there is any energy variability of the absorption lines.
Assuming this interpretation for the relativistic X-ray absorbing material, we present in the following sections estimates of the mass-outflow rate and efficiency of the outflow in PG 1115+080 and APM 08279+5255. These estimates are important for addressing the fundamental issue of whether quasar outflows are capable of influencing their host galaxies and black-hole growth. Since the present observations of PG 1115+080 do not resolve the lensed images we also estimate the influence of this effect on our main conclusions.
3.1 Variability of the outflow in PG 1115+080
Our spectral analysis of the XMM-Newton observations of PG 1115+080 presented in §2.1 indicates possible variability of the X-ray broad absorption features between different epochs. To quantify the significance of these variations we determined the sum of the residuals of between the best-fit 2–2.5 keV and 5–10 keV continuum model and data in the energy range 2.5–5.0 keV based on the spectral fits presented in Figure 1. As described in §2.2 we fit the spectra within the energy ranges of 2–2.5 keV and 5–10 keV with Galactic absorption and a power-law model and extrapolated this model to the energy ranges not fit (see §2.1). For this summed- method to be statistically valid, the best-fit 2–2.5 keV and 5–10 keV models and the S/N of the spectra need to be similar for all epochs. The best-fit 2–2.5 keV and 5–10 keV spectral slopes for all three epochs have essentially the same value of for epochs 1, 2, and 3 respectively, and the S/N of the three observations are similar with effective exposure times and source count rates listed in Table 1. We therefore do not expect variations of the best-fit models or S/N of the spectra to contribute strongly to the variations in the high-energy residuals. We find total residuals of = 40 3, = 26 4, and = 20 3 for epochs 1, 2, and 3, respectively.
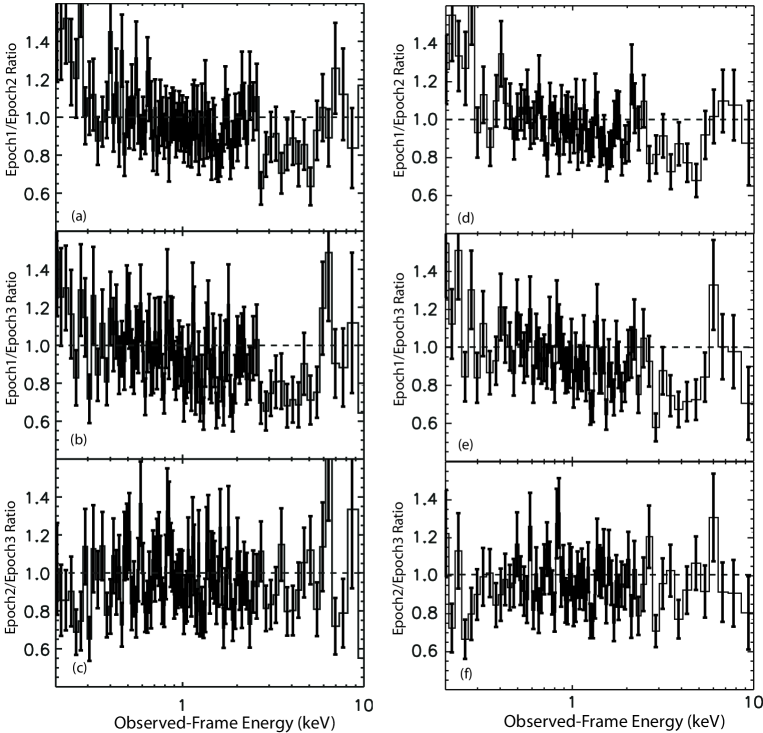
A second approach to quantifying variability of the high-energy absorption features relies on taking ratios of the spectra. This approach is independent of model assumptions and takes into account the uncertainties in each bin. For the purpose of this analysis the grouping of the spectra was made identical for the three epochs. In Figure 4 we show the ratios of the spectra of epoch 1 to epoch 2 (), epoch 1 to epoch 3 (), and epoch 2 to epoch 3 (). We find the mean of the ratios within the high-energy absorbed range 2.5–5.0 keV to be = 0.83 0.05, = 0.73 0.05, and = 0.88 0.05.
As a third method of estimating the variability of the X-ray broad absorption features we compared the strengths of the best-fit Gaussian lines for the three epochs. Specifically, we found the total absorbed photon fluxes in the Gaussian absorption lines for epochs 1, 2, and 3 were (2.4 1.1) 10-5 photons cm-2 s-1, (0.49 0.20) 10-6 photons cm-2 s-1, and (0.34 0.16) 10-6 photons cm-2 s-1, respectively. The decrease in the total absorbed photon fluxes in the absorption lines is consistent with the results of the other two methods.
All approaches imply significant variability of the X-ray broad absorption features in PG 1115+080 between epochs 1 and 2 separated by 0.92 yr (rest-frame) and marginal variability of the X-ray broad absorption features between epochs 2 and 3 separated by 5.9 d (rest-frame). The 5.9 d variability, if real, is consistent with a relatively small launching radius of the X-ray absorber. Specifically, assuming a radiatively driven wind 222 We find the bolometric luminosity of PG 1115+080 to be = 3.3 1046 erg s-1. To estimate we used the empirical relation = , where is the luminosity-dependent bolometric correction obtained from equation (21) of Marconi et al. (2004) and is the flux magnification assumed to be 25 based on lensing models of this system (e.g., Impey et al. 1998). The value of = 1.57 1032 erg s-1 Hz-1 for PG 1115+080 was taken from Neugebauer et al. (1987). and using equation 1 of Chartas et al. (2003) we estimate that a launching radius of about is needed for the absorber to reach a terminal velocity of about 0.4 . At a launching radius of the time to reach 90% of the terminal velocity is about 9 d. This time-scale is consistent with the marginal detection of variability of the Fe absorption lines between epochs 2 and 3.
A model-independent confirmation of the trend of the ionization parameter presented in §2.1 can also be seen in Figure 4. In particular, Figure 4 shows significant positive residuals of the ratios and and negative residuals of the ratio within the 0.2–0.4 keV band. This indicates that the 0.2–0.4 keV flux decreased in the order of epochs 1, 3, and 2. This trend in soft X-ray flux is consistent with the observed trends of the 0.2–0.4 keV residuals shown in Figure 1 and the observed trend in ionization parameter derived from our spectral analysis and shown in Figure 2. We note that the ratio of the EPIC PN spectra is not sensitive to the precise value of the calibrated effective area (the effective area cancels out in the ratio) as long as the response of the PN detector remained the same between observations. The PN detector response is known to be stable with time according to the calibration status of the XMM-Newton instruments (see footnote 4).
Significant variability of PG 1115+080 has also been reported in the optical, UV and X-ray bands. Weymann et al. (1980) report several absorption lines as being visible in the May 1980 observations of this quasar. Young et al. (1982) detect only weak absorption features bluewards of the CIV line in their December 1980 spectrum of PG 1115+080 and do not detect the lines seen in the May 1980 observations. Strong and rapid variability of broad absorption lines blueward of OVI in PG 1115+080 were reported by Michalitsianos et al. (1996). Chartas et al. (2000) reported a decrease by a factor of about 13 of the 0.2–2 keV flux between 1979 December 5 and 1991 November 21 and an increase by a factor of about 5 between the 1991 November 21 and 1994 May 27 observations of PG 1115+080.
Several recent theoretical studies of high-velocity outflows from quasars (e.g., Everett & Ballantyne 2004; Sim et al. 2005) assume that the high-ionization absorption lines of S XIV, S XVI and Fe XXV observed in several quasars (i.e., PG 1211+143 and PG 0844+349 reported by Pounds at al. 2003a,b) originate from gas that has reached its terminal velocity. This terminal velocity is then approximated with the escape velocity from the region from which the wind is launched, resulting in the approximation , where is the observed outflow velocity and is the Schwarzschild radius. For in the range 0.1–0.4 the expected launching radii for PG 1115+080 will lie in the range 100 – 6. For an estimate of the black-hole mass we used the empirical relation (equation 7) of Vestergaard & Peterson (2006). Specifically, we find the mass of the black hole and the Schwarzschild radius to be = 1.1 109 M⊙ and = 2G/ = 3.1 1014 cm, respectively, based on the FWHM of CIV of 4700 km s-1 taken from the Hale spectrum of PG 1115+080 (Young et al. 1982), and the 1350 luminosity density of = 9.48 1031 erg s-1 Hz-1 taken from Neugebauer et al. (1987), where is the flux magnification assumed to be 25 based on lensing models of this system (e.g., Impey et al. 1998).
One of the assumptions in these recent theoretical studies is that the absorbers are observed near their terminal velocities. As we proposed in our previous study of APM 08279+5255 another possibility is that we are observing the absorber as it is being accelerated near the launching radius. We speculate that initially the absorbing material supplied by the accretion disk has a relatively low ionization parameter because of the large gas density at the base of the wind. A low ionization parameter results in a large value of the force multiplier that can lead to significant acceleration through scattering in atomic resonance lines (line-driving; the force multiplier represents the ratio by which the line opacity of the absorbing material increases the radiation force relative to that produced by Thomson scattering alone). Because of the intense radiation field of the central source the absorbing gas becomes increasingly ionized within a time that is much shorter than the time it takes for the absorber to reach its terminal velocity. When the ionization parameter reaches values of about 1000 erg cm s-1 absorption from highly ionized lines such as Si XIV, S XVI and Fe XXV are expected to be produced. As the ionization parameter increases the absorber becomes completely ionized and line-driving becomes no longer important. This interpretation predicts rapid changes (compared to those observed in UV broad absorption lines) in the observed energies and equivalent widths of the X-ray BALs. We note that magnetically driven outflows is also a possibility, as this might be needed to reach such high velocities if the material becomes highly ionized quickly.
The average continuum flux of PG 1115+080 has not varied by more than 20% between epochs as indicated by the observed PN count rates listed in Table 1. The fractional change of the continuum flux can also be seen in the ratio plots shown in Figure 4. There is thus no correlation between the depth of the high-energy broad absorption features and continuum flux level.
3.2 Efficiency of the quasar outflow in PG 1115+080.
One of the key and highly uncertain parameters used in recent theoretical models that describe black-hole growth and structure formation is the efficiency of the quasar outflow. The efficiency is defined as the fraction of the total bolometric energy released over a quasar’s lifetime into the ISM and IGM in the form of kinetic energy injection and can be expressed as:
| (1) |
where is the mass-outflow rate of component , is the outflow velocity of the X-ray absorber of component , is the global covering fraction of the absorber of component , is the thickness of the absorber at radius of component , is the hydrogen column density of component , and is the bolometric photon luminosity of the quasar. We focus on estimating for the outflow in PG 1115+080 observed during epoch 1. The velocities of the different outflowing X-ray absorbers are listed in Table 3. We assume a conservatively wide range for the covering factor of =0.1–0.3 based on the observed fraction of BAL quasars (e.g., Hewett & Foltz 2003) and a fraction ranging from 1–10 based on current theoretical models of quasar outflows (e.g., Proga & Kallman 2000). As we argued in 3.1 we are likely observing the absorbers as they are accelerated near their launching radii. We have assumed absorber radii ranging from 3–15 based on the maximum observed X-ray velocity components. We used a Monte Carlo approach to estimate the errors of and . The values of , , and were assumed to have uniform distributions within their error limits. By multiplying these three distributions and with the appropriate constants from equation 1 we obtained the distributions of and . We finally determined the means of the distributions of and and estimated the 68% confidence ranges.
We note that the last stable orbit can be even smaller in a Kerr black hole and the disk can extend down to the event horizon. This may also be possible even for a Schwarzschild black hole, as argued recently by Agol & Krolik (2000). However, at radii smaller than 3 the gravitational redshift would begin to become important with Eobs/Eemis and one would have to invoke even larger outflow velocities to explain the detected blue-shifted Fe lines.
The total hydrogen column densities of the Fe XXV K components and are consistent with the ones determined in Chartas et al. (2003). The mass-outflow rates and efficiencies of the outflowing components are listed in Table 4.
There are several systematic errors in estimating the radii and column densities of the absorbers that are difficult to constrain and have not been included in the present calculations of the outflow efficiencies. However, both these systematic uncertainties are one sided in the sense that they lead to underestimates of the outflow efficiencies. Specifically, we have allowed the radii of the absorbers to range between the last stable orbit of the black hole to 15 based on the maximum inferred outflow velocities. We therefore expect any errors in the estimates of the radii of the absorbers to lead to larger values of outflow efficiencies. Possible saturation of the absorption lines will lead to an underestimate of the column densities and therefore to an underestimate of the outflow efficiencies as well.
3.3 Contamination from unresolved lensed images
The lensed images of PG 1115+080 cannot be resolved with XMM-Newton, and therefore
the spectra used in our analyses contain contributions from all images.
We estimate how this effect influences our previous results
by first determining X-ray flux ratios based on recent Chandra observations
of PG 1115+080 that do resolve the lensed images.
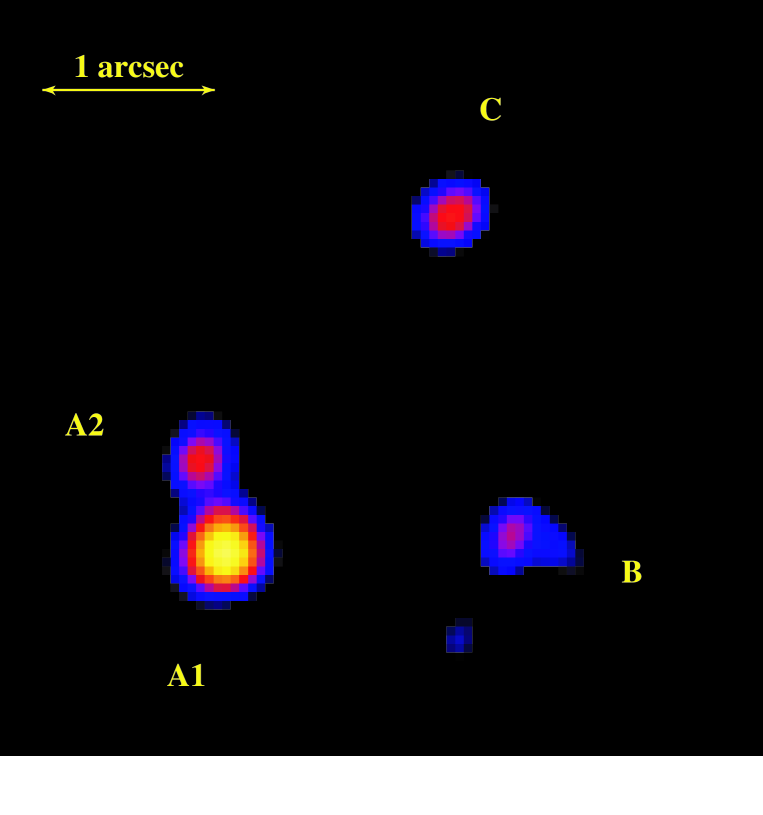
To estimate the X-ray flux ratios of PG 1115+080 we modeled the Chandra images of
A1, A2, B and C, with
point-spread functions (PSFs) generated by the simulation tool MARX (Wise et al 1997).
The X-ray event locations were binned with a bin-size of 00246 to sample the PSF
sufficiently (an ACIS pixel subtends 0491).
The simulated PSFs were fitted to the Chandra data by minimizing the
-statistic formed between the observed and simulated images
of PG 1115+080. The relative positions of the images were fixed to
the observed NICMOS values taken from the CfA-Arizona Space Telescope Lens Survey (CASTLES).
In Figure 5 we show the Lucy-Richardson deconvolved image of the Chandra observation of
PG 1115+080.
We find that the relative X-ray flux ratios in the 0.2–8 keV band
are [A1/C]full = 3.86 0.42, [A2/C]full = 1.85 0.22,
and [B/C]full = 0.93 0.14.
For comparison, the HST H-band flux ratios
are [A1/C]H = 4.06 0.17, [A2/C]H = 2.56 0.12,
and, [B/C]H = 0.65 0.04. The H-band magnitudes
were taken from the CASTLES WWW site.333The CASTLES WWW site is located at http://cfa-www.harvard.edu/glensdata/.
The X-ray flux ratios of PG 1115+080 indicate that about 75% of the X-ray flux originates
from the close-separation images A1 and A2. Since the observed time delay
between images A1 and A2 is = 0.149 0.006 d
there may be variability of the X-ray BALs within this time-scale only if the absorbers are launched
near the last stable orbit of the black hole.
The “long” time delays between images were presented in Schechter et al. (1997)
and have image C leading images A1+A2 by 9.4 3.4 d and image C leading image B by
23.7 3.4 d.
Since images B and C are considerably weaker than A1+A2
they are unlikely to be able to
produce a significant change in the combined spectrum of PG 1115+080.
3.4 Comparison with APM 08279+5255
BAL quasars are relatively weak in X-rays making the detection of broad absorption features difficult with XMM-Newton and Chandra. We have previously presented evidence for a relativistic outflow in the gravitationally lensed =3.91 BAL quasar APM 08279+5255. Following an approach similar to the one described in §3.1 and using the derived outflow properties presented in Chartas et al. (2003), we find that the mass-outflow rates and efficiencies of the outflows associated with the two Fe absorbers in APM 08279+5255 are yr-1, , yr-1, and . The total efficiency of the outflow will be the sum of all components of all species over time. Because of the low S/N of the available spectra of APM 08279+5255 additional components cannot be constrained, and we should consider the estimated total mass-outflow rates and efficiencies as lower limits. The estimated outflow rate is an order of magnitude smaller than the accretion rate in APM 08279+5255 which we estimate to be 1.8 10-3(/) yr-1 40 yr-1, where we assumed a typical accretion efficiency of = 0.1.
4 CONCLUSIONS
High-energy X-ray absorption is detected in three epochs of monitoring observations of the mini-BAL quasar PG 1115+080. We interpret this absorption as due to lines arising from highly blueshifted Fe XXV 1s–2p and/or Fe XXVI Ly. We find that the depths of the X-ray broad absorption features decreased significantly between epochs 1 and 2 separated by 0.92 yr (proper-time) and detect a marginal decrease between epochs 2 and 3 separated by 5.9 days (proper-time). The case for a relativistic flow on the basis of either the epoch 2 or 3 observations of PG 1115+080 alone is less compelling. We note that models that included high-energy absorption lines in PG 1115+080 and APM 08279+5255 resulted in improvements in the fits compared to models that did not include absorption lines at the greater than 99.9% confidence level. We had previously reported rapid variability over timescales of 1.8 weeks (proper-time) of X-ray BALs in the quasar APM 08279+5255. Variability of similar magnitude and over similar time-scales has never been observed in UV BALs.
Assuming the interpretation that the high-energy absorption features are due to lines arising from highly ionized Fe XXV we used the measured outflow velocities, column densities, and estimated launching radii to constrain the mass-outflow rates and outflow efficiencies for PG 1115+080 and APM 08279+5255. We find the outflow efficiencies to be (68% confidence), and (68% confidence), respectively. These estimates include only contributions from observed components and therefore should be considered as lower limits. Our derived estimates of the efficiency of the outflows in mini-BAL quasar PG 1115+080 and BAL quasar APM 08279+5255, when compared to values predicted by recent models of structure formation (SO04; G04; SDH05), imply that these winds will have a significant impact on shaping the evolution of their host galaxies and in regulating the growth of the central black hole.
We note that our reported values of the mass-outflow rates and outflow efficiencies represent instantaneous quantities. Because of the detected variability of the outflows in PG 1115+080 and APM 08279+5255 it is appropriate to compare the outflow efficiency incorporated in theoretical models with the average of this observed quantity over a period that covers the range of variability. Additional monitoring observations are needed to constrain better the variability of the outflow properties.
The fraction of BAL quasars with highly blueshifted Fe absorption lines is not well constrained from available X-ray observations because of the relatively poor-to-moderate S/N X-ray spectra of BAL quasars observed to date. We have shown that the two X-ray brightest mini-BAL and BAL quasars, APM 08279+5255 and PG 1115+080, show significant highly ionized and blueshifted Fe lines. The third brightest BAL quasar known to date CSO 755 shows a hint of an Fe absorption feature in the rest-frame energy range 7.1–9.3 keV (Shemmer et al. 2005). Higher quality observations are required to confirm this result. The X-ray spectra of the remaining observed BAL quasars are of lower S/N and do not provide interesting constraints on the presence of high-energy Fe absorption features.
To date, the most interesting constraints on quasar outflows are derived from X-ray and UV spectroscopic analyses. Current observations of BAL quasars imply that the X-ray and UV bands may be sampling different parts of the absorbing outflows. A large fraction of the high velocity BAL outflow is apparently visible only in the X-ray band. Unfortunately, the limited number and quality of available X-ray spectra leave large uncertainties in the mass-outflow rate. Absorption studies of quasars such as PG 1115+080 and APM 08279+5255 with future high resolution, high throughput X-ray spectroscopic missions such as Constellation-X hold great promise for pinning down this crucial quantity.
We thank Michael Eracleous for fruitful discussions related to AGN outflows. We thank Ohad Shemmer for pointing us to the luminosity-dependent bolometric correction. We greatly appreciate the useful comments made by the referee that led to improved estimates of the black-hole mass and bolometric luminosity of PG 1115+080. GC acknowledges financial support from NASA grants NNG04GK83G and NAG5-13543. WNB acknowledges financial support from NASA LTSA grant NAG5-13035. Support for SCG was provided by NASA through the Spitzer Fellowship Program, under award 1256317. DP acknowledges support provided by NASA through grants HST-AR-10305.05-A and HST-AR-10680.05-A from the Space Telescope Science Institute, which is operated by the Association of Universities for Research in Astronomy, Inc., under NASA contract NAS5-26555.
References
- (1)
- (2) Agol, E., & Krolik, J. H. 2000, ApJ, 528, 161
- (3)
- (4) Aldcroft, T. L., & Green, P. J. 2003, ApJ, 592, 710
- (5)
- (6) Arav, N., Li, Z., & Begelman, M. C. 1994, ApJ, 432, 62
- (7)
- (8) Arav, N., Barlow, T. A., Laor, A., Sargent, W. L. W., & Blandford, R. D. 1998, MNRAS, 297, 990
- (9)
- (10) Arnaud, K. A. 1996, ASP Conf. Ser. 101: Astronomical Data Analysis Software and Systems V, 5, 17
- (11)
- (12) Barlow, T. A., Hamann, F., & Sargent, W. L. W. 1997, ASP Conf. Ser. 128: Mass Ejection from Active Galactic Nuclei, 128, 13
- (13)
- (14) Braito, V., Della Ceca, R., Piconcelli, E., et al., 2004, A&A, 420, 79
- (15)
- (16) Chartas, G. 2000, ApJ, 531, 81
- (17)
- (18) Chartas, G., Brandt, W. N., Gallagher, S. C., & Garmire, G. P. 2002, ApJ, 579, 169
- (19)
- (20) Chartas, G., Brandt, W. N., & Gallagher, S. C. 2003, ApJ, 595, 85
- (21)
- (22) Crenshaw, D. M., Kraemer, S. B., Boggess, A., Maran, S. P., Mushotzky, R. F., & Wu, C. 1999, ApJ, 516, 750
- (23)
- (24) Crenshaw, D. M., Kraemer, S. B., Gabel, J. R., et al., 2003, ApJ, 594, 116
- (25)
- (26) Done, C., Mulchaey, J. S., Mushotzky, R. F., & Arnaud, K. A. 1992, ApJ, 395, 275
- (27)
- (28) Elvis, M., Wilkes, B. J., McDowell, J. C., Green, R. F., Bechtold, J., Willner, S. P., Oey, M. S., Polomski, E., & Cutri, R., 1994, ApJS, 95, 1
- (29)
- (30) Elvis, M. 2000, ApJ, 545, 63
- (31)
- (32) Everett, J. E., & Ballantyne, D. R. 2004, ApJ, 615, L13
- (33)
- (34) Everett, J. E. 2005, ApJ, 631, 689
- (35)
- (36) Gallagher, S. C., Brandt, W. N., Chartas, G., & Garmire, G. P. 2002, ApJ, 567, 37
- (37)
- (38) Garmire, G. P., Bautz, M. W., Ford, P. G., Nousek, J. A., & Ricker, G. R. 2003, Proc. SPIE, 4851, 28
- (39)
- (40) Goodrich, R. W. 1997, ApJ, 474, 606
- (41)
- (42) Granato, G. L., De Zotti, G., Silva, L., Bressan, A., & Danese, L. 2004, ApJ, 600, 580
- (43)
- (44) Green, P. J., Aldcroft, T. L., Mathur, S., Wilkes, B. J., & Elvis, M. 2001, ApJ, 558, 109
- (45)
- (46) Green, R. F., Pier, J. R., Schmidt, M., Estabrook, F. B., Lane, A. L., & Wahlquist, H. D. 1980, ApJ, 239, 483
- (47)
- (48) Hamann, F., Barlow, T. A., Beaver, E. A., Burbidge, E. M., Cohen, R. D., Junkkarinen, V., & Lyons, R. 1995, ApJ, 443, 606
- (49)
- (50) Hasinger, G., Schartel, N., & Komossa, S. 2002, ApJ, 573, L77 (H02)
- (51)
- (52) Hewett, P. C., & Foltz, C. B. 2003, AJ, 125, 1784
- (53)
- (54) Hopkins, P. F., Hernquist, L., Cox, T. J., Di Matteo, T., Martini, P., Robertson, B., & Springel, V. 2005, ApJ, 630, 705
- (55)
- (56) Hopkins, P. F., Hernquist, L., Cox, T. J., Di Matteo, T., Robertson, B., & Springel, V. 2006, ApJS, 163, 1
- (57)
- (58) Impey, C. D., Falco, E. E., Kochanek, C. S., Lehár, J., McLeod, B. A., Rix, H.-W., Peng, C. Y., & Keeton, C. R. 1998, ApJ, 509, 551
- (59)
- (60) Irwin, M. J., Ibata, R. A., Lewis, G. F., & Totten, E. J. 1998, ApJ, 505, 529
- (61)
- (62) Jansen, F., Lumb, D., Altieri, B., et al. 2001, A&A, 365, L1
- (63)
- (64) Kaastra, J. S., Steenbrugge, K. C., Raassen, A. J. J., van der Meer, R. L. J., Brinkman, A. C., Liedahl, D. A., Behar, E., & de Rosa, A. 2002, A&A, 386, 427
- (65)
- (66) Kaspi, S., Brandt, W. N., George, I. M., et al., 2002, ApJ, 574, 643
- (67)
- (68) Kaspi, S., & Behar, E. 2006, ApJ, 636, 674
- (69)
- (70) Kraemer, S. B., Crenshaw, D. M., Hutchings, J. B., et al., 2001, ApJ, 551, 671
- (71)
- (72) Kriss, G. A. 2002, in ASP Conf. Ser 255, Mass Outflow in Active Galacatic Nuclei: Perspectives, ed. D. M. Crenshaw, S. B. Kraemer, & I. M. George (San Francisco; ASP), 69
- (73)
- (74) Krolik, J. H. & Voit, G. M. 1998, ApJ, 497, L5
- (75)
- (76) McKernan, B., Yaqoob, T., & Reynolds, C. S. 2004, ApJ, 617, 232
- (77)
- (78) McKernan, B., Yaqoob, T., & Reynolds, C. S. 2005, MNRAS, 361, 1337
- (79)
- (80) Maloney, P. R., & Reynolds, C. S. 2000, ApJ, 545, L23
- (81)
- (82) Mathur, S. & Williams, R. J. 2002, ApJ, 589, L1
- (83)
- (84) Michalitsianos, A. G., Oliversen, R. J., & Nichols, J. 1996, ApJ, 461, 593
- (85)
- (86) Murray, N., Chiang, J., Grossman, S. A., & Voit, G. M. 1995, ApJ, 451, 498
- (87)
- (88) Netzer, H., Kaspi, S., Behar, E., et al., 2003, ApJ, 599, 933
- (89)
- (90) Neugebauer, G., Green, R. F., Matthews, K., Schmidt, M., Soifer, B. T., & Bennett, J. 1987, ApJS, 63, 615
- (91)
- (92) Porquet, D., Reeves, J. N., O’Brien, P., & Brinkmann, W. 2004, A&A, 422, 85
- (93)
- (94) Pounds, K. A., King, A. R., Page, K. L., & O’Brien, P. T. 2003a, MNRAS, 346, 1025
- (95)
- (96) Pounds, K. A., Reeves, J. N., King, A. R., Page, K. L., O’Brien, P. T., & Turner, M. J. L. 2003, MNRAS, 345, 705
- (97)
- (98) Proga, D., Stone, J. M., & Kallman, T. R. 2000, ApJ, 543, 686
- (99)
- (100) Proga, D., & Kallman, T. R. 2004, ApJ, 616, 688
- (101)
- (102) Punsly, B. 2006, ApJ, 647, 886
- (103)
- (104) Reeves, J. N., O’Brien, P. T., & Ward, M. J. 2003, ApJ, 593, L65
- (105)
- (106) Reeves, J. N., & Turner, M. J. L. 2000, MNRAS, 316, 234
- (107)
- (108) Scannapieco, E., & Oh, S. P. 2004, ApJ, 608, 62
- (109)
- (110) Schechter, P. L., Bailyn, C. D., Barr, R., et al., 1997, ApJ, 475, L85
- (111)
- (112) Shemmer, O., Brandt, W. N., Gallagher, S. C., Vignali, C., Boller, Th., Chartas, G., & Comastri, A., 2005, AJ, 130, 2522
- (113)
- (114) Sim, S. A. 2005, MNRAS, 356, 531
- (115)
- (116) Spitzer, L. 1978, Physical Processes in the Interstellar Medium (New York: Wiley)
- (117)
- (118) Springel, V., Di Matteo, T., & Hernquist, L. 2005, ApJ, 620, L79
- (119)
- (120) Srianand, R., & Petitjean, P. 2000, A&A, 357, 414
- (121)
- (122) Stark, A. A., Gammie, C. F., Wilson, R. W., Bally, J., Linke, R. A., Heiles, C., & Hurwitz, M. 1992, ApJS, 79, 77
- (123)
- (124) Steffen, A. T., Strateva, I., Brandt, W. N., Alexander, D. M., Koekemoer, A. M., Lehmer, B. D., Schneider, D. P., & Vignali, C. 2006, AJ, 131, 2826
- (125)
- (126) Strüder, L., Briel, U., Dennerl, K., et al., 2001, A&A, 365, L18
- (127)
- (128) Tananbaum, H. Avni, Y., Branduardi, G., Elvis, M., Fabbiano, G., Feigelson, E., Giacconi, R., Henry, J. P., Pye, J. P., Soltan, A., Zamorani, G. 1979, ApJ, 234, L9
- (129)
- (130) Tolea, A., Krolik, J. H., & Tsvetanov, Z. 2002, ApJ, 578, L31
- (131)
- (132) Tripp, T. M., Green, R. F., & Bechtold, J. 1990, ApJ, 364, L29
- (133)
- (134) Turner, M. J. L., Abbey, A., Arnaud, M., 2001, A&A, 365, L27
- (135)
- (136) Tsunemi, H., Mori, K., Miyata, E., Baluta, C., Burrows, D. N., Garmire, G. P., & Chartas, G. 2001, ApJ, 554, 496
- (137)
- (138) Turner, T. J., & Kraemer, S. B. 2003, ApJ, 598, 916
- (139)
- (140) Turnshek, D. A., Grillmair, C. J., Foltz, C. B., & Weymann, R. J. 1988, ApJ, 325, 651
- (141)
- (142) Young, P., Sargent, W. L. W., & Boksenberg, A. 1982, ApJ, 252, 10
- (143)
- (144) Verner, D. A., Verner, E. M., and G. J. Ferland, G. J., 1996, Atomic Data Nucl. Data Tables, 64, 1
- (145)
- (146) Verner, D. A. & Yakovlev, D. G. 1995, A&AS, 109, 125
- (147)
- (148) Vestergaard, M., & Peterson, B. M. 2006, ApJ, 641, 689
- (149)
- (150) Weymann, R. J., Latham, D., Roger, J., Angel, P., Green, R. F., Liebert, J. W., Turnshek, D. A., Turnshek, D. E., and Tyson, J. A. 1980, Nature, 285, 641
- (151)
- (152) Weymann, R. J., Morris, S. L., Foltz, C. B., & Hewett, P. C. 1991, ApJ, 373, 23
- (153)
- (154) Wise, M. W., Huenemoerder, D. P., & Davis, J. E. 1997, ASP Conf. Ser. 125: Astronomical Data Analysis Software and Systems VI, 125, 477
- (155)
| Exposure | Effective | ||||
|---|---|---|---|---|---|
| Observation | Observatory | Observation | Time | Exposure TimeaaEffective exposure time is the time remaining after the application of good time-interval (GTI) tables to remove portions of the observation that were severely contaminated by background. | bbBackground-subtracted source count rate including events with energies within the 0.2–10 keV band. The source count rates and effective exposure times for the XMM-Newton observations refer to those obtained with the EPIC PN instrument. Please see §2 for details on source and background extraction regions used for measuring . |
| Date | ID | (ks) | (ks) | ||
| 2004 June 26 | XMM-Newton | 0145750101 | 86.52 | 54.92 | 0.181 0.002 |
| 2004 June 10 | XMM-Newton | 0203560201 | 86.65 | 51.46 | 0.212 0.002 |
| 2001 November 25 | XMM-Newton | 0082340101 | 63.36 | 52.37 | 0.202 0.002 |
| 2000 November 3 | Chandra | 1630 | 9.95 | 9.83 | 0.084 0.003 |
| 2000 June 2 | Chandra | 362 | 26.83 | 26.5 | 0.075 0.002 |
| Modela | Parameterb | Values For Epoch 1c | Values For Epoch 2c | Values For Epoch 3c |
|---|---|---|---|---|
| 2001 November 25 | 2004 June 10 | 2004 June 26 | ||
| 1 | 1.85 | 1.85 | 1.80 | |
| (0.22) 1022 cm-2 | (0.46) 1022 cm-2 | (0.37) 1022 cm-2 | ||
| 361.2/240 | 361.1/272 | 344.8/255 | ||
| d | 6.6 10-7 | 2.3 10-4 | 1.5 10-4 | |
| 1.68 | 1.83 | 1.72 | ||
| (0.12) 1022 cm-2 | (0.44) 1022 cm-2 | (0.32) 1022 cm-2 | ||
| Eabs1 | 7.27 keV | 6.40 keV | ||
| 0.50 keV | 0.44 keV | |||
| EWabs1 | 0.117 keV | 0.057 keV | ||
| Eabs2 | 10.51 keV | 8.53 keV | keV | |
| 3.49 keV | 0.53 | keV | ||
| EWabs2 | 2.27 keV | keV | keV | |
| 284.8/228 | 320.8/260 | 363.6/250 | ||
| d | 6.27 10-3 | 6.04 10-3 | 3.47 10-6 | |
| 1.84 | 1.92 | |||
| (1.33) 1022 cm-2 | (1.41) 1022 cm-2 | (1.52) 1022 cm-2 | ||
| 144.9 erg cm s-1 | 55.9 erg cm s-1 | 90.2 erg cm s-1 | ||
| Eabs1 | 7.27 keV | 6.40 keV | ||
| 0.44 keV | 0.33 keV | |||
| EWabs1 | keV | keV | ||
| Eabs2 | 9.79 keV | 8.61 keV | keV (68% level) | |
| 3.07 keV | 0.51 keV | keV (68% level) | ||
| EWabs2 | keV | keV | keV (68% level) | |
| 241.5/227 | 265.1/259 | 278.8/249 | ||
| d | 0.20 | 0.38 | 0.10 | |
| 1.84 | 1.94 | |||
| (1.97) 1022 cm-2 | (1.61) 1022 cm-2 | (1.73) 1022 cm-2 | ||
| 0.40 | 0.65 | 0.57 | ||
| Eabs1 | 7.27 keV | 6.41 keV | ||
| 0.44 keV | 0.33 keV | |||
| EWabs1 | keV | keV | ||
| Eabs2 | 9.62 keV | 8.53 keV | keV (68% level) | |
| 3.18 keV | 0.44 keV | keV (68% level) | ||
| EWabs2 | keV | keV | keV (68% level) | |
| 247.6/227 | 263.9/259 | 279.6/249 | ||
| d | 0.17 | 0.40 | 0.09 |
a Model 1 consists of a power law and neutral absorption at the source.
Model 2 consists of a power law, neutral absorption at the source, and Gaussian absorption lines at the source.
Model 3 consists of a power law, ionized absorption at the source, and Gaussian absorption lines at the source.
Model 4 consists of a power law, partial covering of the source, and Gaussian absorption lines at the source.
All model fits include the Galactic absorption toward the source (Stark et al. 1992).
All fits have been performed on the combined spectrum of images A1, A2, B and C of PG 1115+080.
bAll absorption-line parameters are calculated for the rest frame.
cAll errors are for 90% confidence unless mentioned otherwise with all
parameters taken to be of interest except absolute normalization.
d is the probability of exceeding for degrees of freedom
if the model is correct.
| Line a | Component | ||||||
|---|---|---|---|---|---|---|---|
| (keV) | (keV) | (keV) | (keV) | (keV) | |||
| Fe XXV 1s–2p | 6.7 | 0.11 | 0.44 | ||||
| Fe XXV 1s–2p | 6.7 | 2.05 | 3.07 |
| Component | Line | NH | ||
|---|---|---|---|---|
| cm-2 | (M) | |||
| PG 1115+080 Outflow | ||||
| Fe XXV 1s–2p | 4 1022 | |||
| Fe XXV 1s–2p | 4 1023 | |||
| APM 08279+5255 Outflow | ||||
| Fe XXV 1s–2p | 1 1023 | |||
| Fe XXV 1s–2p | 1 1023 | |||