The connection between metallicity and metal-line kinematics in (sub-)damped Lyman- systems
Abstract
A correlation between the metallicity, [M/H], and rest-frame Mg ii equivalent width, , is found from 49 DLAs and strong sub-DLAs drawn from the literature over the redshift range . The correlation is significant at and improves to when the mild evolution of [M/H] with redshift is taken into account. Even when including only the 26 DLAs (i.e. exlcuding sub-DLAs) which have Zn-metallicities and Å, the correlation remains at significance. Since the Mg ii 2796 transition is predominantly saturated in DLAs (which always have greater than 0.3 Å), is far more sensitive to the kinematic spread of the metal velocity components across the absorption profile than it is to [M/H]. Thus, the observed [M/H]– correlation points to a strong link between the absorber metallicity and the mechanism for producing and dispersing the velocity components. We also note that approximately half of the 13 known absorbers have very high and very broad velocity structures which show characteristics usually associated with outflows. Follow-up ultraviolet- and blue-sensitive high-resolution spectra of high- systems, initially identified in low-resolution spectra, may therefore yield a large number of new discoveries.
keywords:
intergalactic medium – quasars: absorption lines – cosmology: observations – galaxies: evolution – galaxies: ISM1 Introduction
The damped Lyman- absorbers (DLAs) observed along sight-lines to quasars (QSOs) are potentially important pieces in the puzzle of galaxy formation. They are the highest column density absorption systems, with , and the first DLA surveys quickly established that they contain a large fraction of the high- baryons available for star formation (Wolfe et al., 1986; Lanzetta et al., 1991). The early estimates of the neutral gas mass density at absorption redshifts were similar to the estimates of the mass density in stars at . It was therefore natural to assume that DLAs act as the neutral gas reservoirs for star formation. However, firmly establishing the link between DLAs and star formation relies on our understanding of the absorber–galaxy connection. Direct imaging of DLAs (or strong Mg ii systems; see below) at reveals the hosts to be a mix of irregulars, dwarfs, spirals and low surface-brightness galaxies (e.g. Bergeron & Boissé, 1991; Le Brun et al., 1997; Rao et al., 2003; Chen & Lanzetta, 2003). This is further borne out by a blind 21-cm emission survey at (Ryan-Weber et al., 2003). However, quantifying the mix of DLA host-galaxy morphologies from low- to high-redshift is fraught with selection effects, not least of which are luminosity bias against faint galaxies and the proximity of some host-galaxies to the QSO sight-line. Indeed, very few DLA host-galaxies have been identified at (e.g. Møller & Warren, 1993; Djorgovski et al., 1996; Christensen et al., 2005; Weatherley et al., 2005).
The Mg ii 2796/2803 doublet has proved very important for exploring the absorber–galaxy connection at where it is observable with optical QSO absorption spectroscopy. Indeed, many of the imaging studies above initially identified absorption systems via the easily recognised Mg ii doublet (see also, e.g., Lanzetta & Bowen, 1990; Bergeron et al., 1992; Steidel & Sargent, 1992; Drinkwater et al., 1993; Steidel et al., 1994). Also, since the ionization potential of Mg i is but that of Mg ii is , the latter traces cold gas. Attempts have therefore been made to identify DLA candidates at low- via their Mg ii absorption (e.g. Rao et al., 1995, 2006; Ellison, 2006). The Mg ii doublet transitions are also among the strongest metal lines observed in QSO absorbers, meaning that (i) the Mg ii 2796 rest-frame equivalent width in DLAs is typically Å, allowing such systems to be identified in relatively low-resolution spectra, and (ii) most velocity components across the Mg ii profile are saturated in DLAs. This implies that is mainly sensitive to the kinematic extent of the velocity components, , rather than their column density. A good demonstration of this is figure 3 of Ellison (2006).
In this paper we search for a relationship between and the metallicity111Metallicity is defined as the heavy element abundance with respect to hydrogen, relative to that of the solar neighbourhood: , [M/H], of DLAs and strong sub-DLAs. Since is a measure of the kinematic spread of the cold, metal-bearing velocity components, such a relationship may constrain the mechanisms for producing and dispersing the metals. This may guide our understanding of the physical nature of DLAs.
There currently exist only indirect and possibly contradictory constraints on a [M/H]– relationship for DLAs and sub-DLAs. Nestor et al. (2003) suggest that [M/H] increases with increasing . They identified strong Mg ii systems in Sloan Digital Sky Survey (SDSS) QSO spectra over the redshift range and constructed composite spectra in the absorber rest-frame. The Zn ii lines were stronger in the composite of Å absorbers compared with those in the composite of Å systems. Assuming that the mean is not significantly different in these two regimes, they conclude that some evidence exists for a [Zn/H]– correlation. On the other hand, York et al. (2006) find less direct evidence for an anti-correlation between [Zn/H] and . From a series of composite SDSS spectra with various mean they find that the dust-reddening, , caused by the absorbers rises sharply with increasing . While the Zn ii line-strengths also increase, they show a slower increase than over the same range of . The composite spectra also suggest a dust extinction curve typical of the Small Magellanic Cloud (SMC), leading York et al. to assume a constant dust-to-gas ratio, i.e. , as observed in the SMC. Thus, since the Zn ii column density increases slower than the inferred from under this assumption, York et al. (2006) argue that [Zn/H] decreases with increasing . We discuss these results further in light of our new results in Section 3.
This paper is organised as follows. Section 2 explains our sample selection and explores an evident [M/H]– relationship in that sample. Section 3 compares our results with the [M/H]– correlation recently discovered by Ledoux et al. (2006) at (generally) higher redshifts. We also discuss whether our observed [M/H]– relationship can be taken as evidence for a correlation or anti-correlation between absorber metallicity and host-galaxy mass. Finally, we discuss whether a large fraction of strong Mg ii absorbers might arise in outflows from relatively low mass galaxies. In particular, about half of those absorbers in which H2 has been detected show some evidence of an outflow origin.
2 Correlation between metallicity and Mg ii equivalent width in DLAs and sub-DLAs
2.1 Sample definition
| QSO | [Å] | Ref. | [M/H] | M | Ref. | Notes | |||
|---|---|---|---|---|---|---|---|---|---|
| 00130029 | 20.8 | 1.973 | 2.08694 | R03 | Zn | P02 | |||
| 00580155 | 20.1 | 0.61251 | 1.954 | HIRES | Zn | P00 | — | ||
| 0100130 | 21.4 | 2.3091 | 2.681 | UVES7,19 | Zn | PW99 | PHL 957 | ||
| 0235164 | 21.7 | 0.52385 | 0.94 | LB92 | Zn | J04,P03a | |||
| 0302223 | 20.4 | 1.00945 | 1.409 | R06 | Zn | P00 | |||
| 04054418 | 21.0 | 2.5505 | 3.00 | UVES10,11,14 | Zn | LE03 | CTQ 0247 | ||
| 04054418 | 21.1 | 2.595 | 3.00 | UVES10,11,14 | Zn | LE03 | , CTQ 0247 | ||
| 0454039 | 20.7 | 0.8596 | 1.345 | C00 | Zn | P00 | |||
| 0458020 | 21.7 | 2.03945 | 2.286 | W93 | Zn | PW99 | |||
| 05123329 | 20.5 | 0.931 | 1.569 | E06b | Fe | L05 | — | ||
| 05154414 | 20.5 | 1.1508 | 1.713 | UVES1,5,16 | Zn | D00 | |||
| 0528250 | 20.6 | 2.141 | 2.813 | UVES6,9,11 | Zn | C03a | |||
| 0551366 | 20.4 | 1.962 | 2.318 | R03 | Zn | L02b | |||
| 0738313 | 20.8 | 0.2212 | 0.635 | B87 | Cr | K04 | |||
| 0827243 | 20.3 | 0.5247 | 0.939 | RT00 | Fe | K04 | |||
| 08411256 | 21.3 | 2.3745 | 2.50 | UVES2,15 | Zn | PW99 | — | ||
| 0933732 | 21.6 | 1.4789 | 2.528 | R06 | Zn | K04 | |||
| 0935417 | 20.3 | 1.3726 | 1.98 | P04 | Zn | M95 | — | ||
| 0945436 | 21.5 | 1.223 | 1.89149 | SDSS | Zn | P03a | — | ||
| 0949527 | 20.1 | 1.7678 | 1.87476 | SDSS | Zn | P06b | — | ||
| 0952179 | 21.3 | 0.2378 | 1.472 | RT00 | Cr | K05 | |||
| 0957561A | 20.3 | 1.391 | 1.413 | E06b | Fe | C03b | |||
| 0957561B | 19.9 | 1.391 | 1.413 | E06b | Fe | C03b | |||
| 1101264 | 19.5 | 1.838 | 2.145 | E06b | Fe | D03 | — | ||
| 11041805 | 20.9 | 1.6614 | 2.319 | L99 | Zn | L99 | — | ||
| 11040104 | 21.0 | 0.7404 | 1.3924 | R06 | Zn | K04 | — | ||
| 11221649 | 20.5 | 0.6819 | 2.40 | P04 | Fe | L02a,P03a | |||
| 1151068 | 21.3 | 1.7736 | 2.762 | R03 | Zn | P97 | — | ||
| 1157014 | 21.8 | 1.94362 | 1.986 | R03 | Zn | L03 | |||
| 1209093 | 21.4 | 2.5840 | 3.297 | UVES8,18 | Zn | P03b | |||
| 12101731 | 20.6 | 1.892 | 2.543 | E06b | Zn | D06 | — | ||
| 1215333 | 21.0 | 1.999 | 2.606 | SS92 | Zn | P99 | |||
| 12231753 | 21.5 | 2.4658 | 2.936 | UVES3,4,13 | Fe | P01 | |||
| 12290207 | 20.8 | 0.39498 | 1.045 | LB92 | Zn | B98 | |||
| 1247267 | 19.9 | 1.22319 | 2.038 | E06b | Zn | P99 | |||
| 13200006 | 20.2 | 0.716 | 1.38839 | SDSS | Zn | P06a | — | ||
| 1328307 | 21.3 | 0.692154 | 0.849 | SM79 | Zn | MY92 | , 3C 286 | ||
| 1331170 | 21.2 | 1.77642 | 2.084 | R03 | Fe | P01 | |||
| 1351318 | 20.2 | 1.14913 | 1.326 | E06b | Zn | P99 | |||
| 1354258 | 21.5 | 1.4205 | 2.006 | RT00 | Zn | K05 | |||
| 1451123 | 19.9 | 2.255 | 3.246 | UVES2 | Zn | D05 | |||
| 1622238 | 20.4 | 0.6561 | 0.927 | SS92 | Fe | P03a | , 3C 336 | ||
| 1629120 | 19.7 | 0.9008 | 1.795 | R06 | Zn | E06a | |||
| 17275302 | 21.2 | 0.9448 | 1.444 | R06 | Zn | K04 | — | ||
| 17275302 | 21.4 | 1.0312 | 1.444 | R06 | Zn | K04 | — | ||
| 22061958 | 20.5 | 1.9205 | 2.56 | UVES3,17,19 | Fe | P01 | — | ||
| 22310015 | 20.5 | 2.066 | 3.015 | E06b | Zn | D04 | |||
| 2343125 | 20.3 | 2.4310 | 2.549 | UVES6,12,17 | Zn | D04 | |||
| 23481444 | 20.6 | 2.279 | 2.94 | E06b | Fe | D06 |
Notes: a absorption detected; b21-cm absorption
detected; c21-cm absorption not detected; dradio-loud but not
searched for 21-cm absorption; eradio-quiet.
160.A-9022 UVES commissioning; 265.O-0063 Ledoux;
365.O-0158 Pettini; 465.P-0038 Srianand; 566.A-0212
Reimers; 666.A-0594 Molaro; 7 67.A-0022 D’Odorico;
867.A-0146 Vladilo; 968.A-0106 Petitjean; 1068.A-0361
Lopez; 1168.A-0600 Ledoux; 1269.A-0204 D’Odorico;
1369.B-0108 Srianand; 1470.A-0017 Petitjean; 1570.B-0258
Dessauges-Zavadsky; 16072.A-0100 Murphy; 17072.A-0346 Ledoux;
18073.B-0787 Dessauges-Zavadsky; 19074.A-0201 Srianand.
References: SM79 (Spinrad &
McKee, 1979), B87 (Boulade et al., 1987), W93
(Wolfe et al., 1985), LB92 (Lanzetta &
Bowen, 1992), MY92
(Meyer &
York, 1992), SS92 (Steidel &
Sargent, 1992), A94
(Aldcroft
et al., 1994), M95 (Meyer
et al., 1995), P97
(Pettini et al., 1997), B98 (Boisse et al., 1998), L99
(Lopez et al., 1999), P99 (Pettini et al., 1999), PW99
(Prochaska &
Wolfe, 1999), C00 (Churchill
et al., 2000), D00
(de la Varga et al., 2000), P00 (Pettini et al., 2000), RT00
(Rao &
Turnshek, 2000), P01 (Prochaska
et al., 2001), P02
(Petitjean et al., 2002), L02a (Ledoux
et al., 2002), L02b
(Ledoux
et al., 2002), C03a (Centurión
et al., 2003), C03b
(Churchill et al., 2003), D03 (Dessauges-Zavadsky
et al., 2003), L03
(Ledoux
et al., 2003), LE03 (Lopez &
Ellison, 2003), P03a
(Prochaska et al., 2003a), P03b (Prochaska et al., 2003b), R03
(Ryabinkov et al., 2003) [and references therein], D04
(Dessauges-Zavadsky
et al., 2004), J04 (Junkkarinen et al., 2004), K04
(Khare et al., 2004), P04 (Péroux et al., 2004), A05
(Akerman et al., 2005), K05 (Kulkarni et al., 2005), L05
(Lopez et al., 2005), D06 (Dessauges-Zavadsky
et al., 2006), E06a
(Ellison, 2006), E06b (S. E. Ellison, private communication),
P06a (Péroux
et al., 2006), P06b (Prochaska
et al., 2006), R06
(Rao
et al., 2006). ‘SDSS’ or ‘UVES’ indicates we have obtained from Sloan Digital Sky Survey spectra or from VLT/UVES spectra.
We identified DLAs [] and strong sub-DLAs [] with existing metallicity measurements in the compilation of Kulkarni et al. (2005) and several other, typically more recent, sources (as cited in Table 1). For these systems we searched the literature for measurements; Table 1 lists those systems for which we found both [M/H] and . Uncertainties for some values could not be found in the literature (see Section 2.2). For systems without a published value we searched for publicly available SDSS () or Very Large Telescope Ultraviolet and Visual Echelle Spectrograph (VLT/UVES; ) spectra from which an measurement is easily made. For SDSS spectra, our method for obtaining is described in detail in Bouché et al. (2006). UVES spectra were obtained from the ESO data archive and reduced using a version of the UVES pipeline which we modified to improve the flux extraction and wavelength calibration. The extracted echelle orders from all exposures were combined, using uves popler222Available at http://www.ast.cam.ac.uk/mim/UVES_popler.html, with inverse-variance weighting and a cosmic ray rejection algorithm, to form a single spectrum with a dispersion of 2.5 pixel-1. was then measured by direct summation of pixels across the Mg ii 2796 profile. The uncertainties in quoted in Table 1 for these UVES spectra are generally dominated by uncertainties in the continuum level around the Mg ii 2796 line. In some cases where is so high that the 2796 profile is blended with that of the 2803 line (typically Å), larger uncertainties are reported.
For most of the 49 absorbers in Table 1, Zn-metallicities were available in the literature. In 13 cases we have used the Fe or Cr abundance in the absence of a Zn measurement. It is well known that these elements are depleted onto dust grains (e.g. Pettini et al., 1997) and so we corrected the Fe and Cr abundances with the simple prescription of Prochaska et al. (2003a): . In Section 2.2 we test the possible impact this might have on our results. Most of the metallicities in Table 1 have been corrected to the solar scale of Lodders (2003). The values quoted in the literature were used for Q 0235164, Q 1622238, Q 0458020, Q 11221649, Q 1157014 since we could not identify which solar values the original authors used. Since the corrections are typically , these 5 exceptions have negligible impact on our main results.
2.2 The –[M/H] correlation
| Original data | Redshift-corrected metallicities | ||||||||||
|---|---|---|---|---|---|---|---|---|---|---|---|
| Sample | |||||||||||
| [Å] | [dex] | [] | [] | [dex] | [dex] | [] | [] | [dex] | [dex] | ||
| 0: Fiducial | 49 | ||||||||||
| 1: only | 36 | ||||||||||
| 2: DLAs only | 40 | ||||||||||
| 3: Å | 42 | ||||||||||
| 4: | 26 | ||||||||||
| 5: Å | 25 | ||||||||||
| 6: Å | 24 | ||||||||||
| 7: | 24 | ||||||||||
| 8: | 25 | ||||||||||
| 9: No | 43 | ||||||||||
| 10: No or 21-cm | 35 | ||||||||||
| 11: systems | 6 | ||||||||||
| 12: 21-cm systems | 9 | ||||||||||
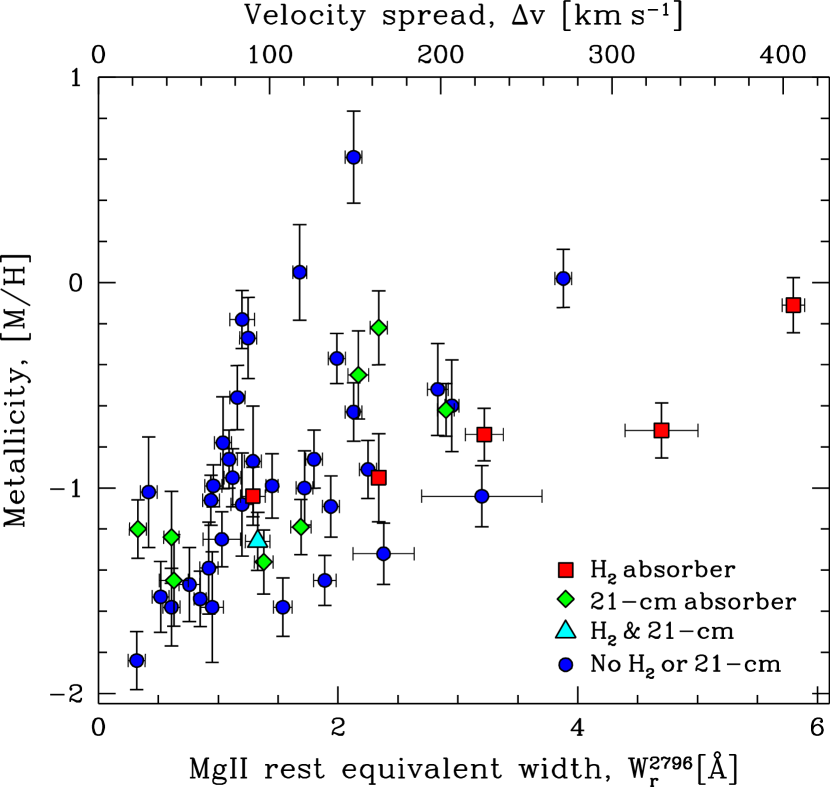
Figure 1(left) shows all the [M/H]– pairs. Table 1 gives the formal statistical errors on both quantities as reported in the literature. In cases where no error-bars could be found in the literature, uncertainties of 0.10 dex and 0.05 Å were assumed as these typified the rest of the sample. For Fig. 1(left) we added 0.05 dex and 0.03 Å in quadrature to the initial [M/H] and uncertainties to take into account likely continuum fitting errors which are not included by some authors or, indeed, by our own measurements in SDSS spectra. We regard the points in Table 1 with these increased errors as our fiducial sample. Kendall’s for the [M/H]– correlation evident in Fig. 1 has a probability of being due to chance alone; assuming Gaussian statistics, the correlation is significant at -. The correlation is robust to the removal of distinct sub-samples, some of which are discussed below, as shown in Table 2.
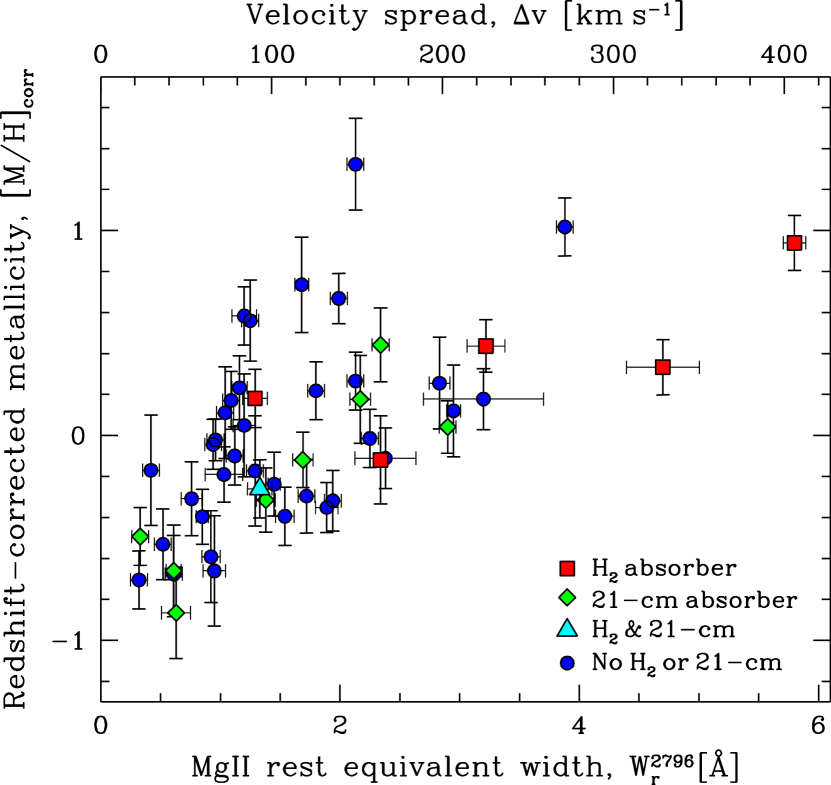
The absorbers cover quite a large redshift range, , so evolution in DLA metallicities may have somewhat washed out the correlation we observe. For example, if absorbers at lower are, on average, more metal-rich than at higher , then this would cause additional dispersion in [M/H] at all values of . This would at least decrease the statistical significance of the observed correlation and, depending on the redshift distribution of the sample, may somewhat alter its slope. To explore whether this is indeed the case, we make a simple correction to the metallicities in Table 1 according to
| (1) |
The numerical coefficients are the -intercept and slope from an unweighted least squares fit to [M/H] versus using the fiducial sample. This has the effect of correcting each metallicity by the expected mean value at the absorber’s redshift. The slope and intercept are consistent with those derived from larger samples of DLAs covering similar redshift ranges (e.g. Prochaska et al., 2003a; Kulkarni et al., 2005). Fig. 1(right) shows the redshift-corrected metallicities versus and Table 2 gives the redshift-corrected statistics: the general scatter around the [M/H]– correlation clearly decreases upon correction; the table shows that the significance of the [M/H]– correlation increases in almost all sub-samples once the metallicities are corrected for redshift evolution.
Visually, the correlation in Fig. 1(left) appears tighter for the lower- half of the sample compared to that for the upper half. That is, the variance in [M/H] about the general [M/H]– trend appears smaller at low-. However, an F-test reveals only marginal evidence for this: a fit of [M/H] versus is performed [see equation (2); Section 3.1], the sample is split into two sub-samples at Å and the variance in [M/H] about the fit is calculated for each sub-sample. The ratio of the variances about the fit is , but this should occur 15 per cent of the time by chance alone given the sizes of the sub-samples. Using the redshift-corrected metallicities [Fig. 1(right)], the ratio of the variances reduces to , which has an associated probability of 24 per cent. The marginally increased scatter at high does reduce the significance of the correlation in the high- sub-sample compared to the low- sub-sample (see Table 2); one possibility is that Fig. 1, particularly the redshift-corrected version in Fig. 1(right), defines a lower bound ‘envelope’ to the metallicity at a given instead of a normal correlation. This should of course be combined with an upper bound envelope at high metallicities since arbitrarily high values are unphysical. A larger sample with robust control over metallicity uncertainties would be required to identify these features and to distinguish between a true correlation and a lower bound envelope.
We have also split the sample into two redshift bins about the fiducial sample’s median, . Table 2 shows that the [M/H]– correlation is still well-defined in the high- sub-sample but it is somewhat less statistically significant at low-. However, the fits to both sub-samples, as described in Section 3.1, yield consistent results.
Three main objections might be raised to some of the data we use in Table 1: (i) Some of the metallicities are not derived from Zn and so might be susceptible to dust-depletion effects, even though we have made a crude correction to any metallicities derived using the heavily depleted Fe and Cr ions; (ii) Absorbers with low might contain a significant number of velocity components which are not completely saturated. While still provides a measure of velocity spread, , in these systems, will also depend somewhat on the optical depths of the unsaturated components. Therefore, as the MgII velocity components weaken at lower [M/H], one might expect a correlation between [M/H] and which has little to do with the correlation found at higher . One might consider that only systems with Å should be used since the profile is even more likely to be completely saturated; (iii) Finally, the reliability of sub-DLA metallicities is not as well established in the literature as that for DLAs. It is possible that we do not fully understand the ionization corrections required in some cases or, indeed, the magnitude of the systematics involved in deriving in sub-DLAs. For example, Voigt profile estimates closer to the flat part of the curve of growth naturally have larger random uncertainties and may become increasingly, systematically influenced by weaker Ly- forest lines. However, Table 2 shows that the [M/H]– correlation is fairly robust against removal of non-Zn metallicities, systems with Å or sub-DLAs. Removing all three cases together also leaves a correlation ( after correcting the metallicities for redshift evolution).
Note that our sample contains only one system with . This is partially a selection effect since the Zn ii lines become undetectably weak at low metallicities. However, very few DLAs and sub-DLAs are known with lower metallicities at redshifts and comparison with other more complete samples (e.g. Kulkarni et al., 2005; Akerman et al., 2005) shows that our sample is fairly representative of the overall DLA metallicity distribution. Finally, we have included 3 systems in Table 1 which are within 5000 of the emission redshift of the background QSO. These systems do not show any signs of being associated with the QSO central engine and so are included here. Removing them from the sample makes a negligible difference to our results.
3 Discussion
The [M/H]– correlation found in Fig. 1 is a direct demonstration that the metallicity of strong Mg ii absorbers is closely related to their kinematics (but not necessarily the kinematics of the host galaxy; see below). Since the Mg ii 2796 transition is so strong, most velocity components in absorbers with Å are saturated and so measures the total velocity spread among the components, . Equivalently, it is a measure of the number of velocity components across the profile (e.g. Petitjean & Bergeron, 1990). Thus, the [M/H]– correlation demonstrates that the mechanism responsible for producing individual Mg ii velocity components and for dispersing them over velocity ranges – is related to – and possibly also determines – the metallicity of the absorber.
The results in Fig. 1 bear on the apparent discrepancy between the conclusions drawn by Nestor et al. (2003), whose results suggest a [M/H]– correlation, and York et al. (2006) whose analysis suggests an anti-correlation. Our observed [M/H]– correlation supports the former and seems inconsistent with the latter. One possible explanation may be that York et al. assume a constant dust-to-gas ratio as a function of , i.e. . They base this assumption on their observation that the Mg ii absorbers they study seem to redden the background QSOs with, on average, an SMC-like dust extinction law. Even if this proves to be true for strong Mg ii absorbers, this relation has certainly not been demonstrated in DLAs or sub-DLAs. Indeed, from the detection of SMC-like dust-reddening in SDSS DLAs at , Murphy et al. (2007, in preparation) find that the mean appears not to change over the range . One caveat may be important here: possible magnitude bias. Nestor et al. assumed that is not a strong function of based on the observations of Rao et al. (2006). The data in Table 1 also reveal no apparent trend in with . However, Rao et al. selected relatively bright background QSOs which could provide reasonable signal-to-noise ratios in ultraviolet (UV) Hubble Space Telescope (HST) spectra. York et al. suggest that dusty absorbers are therefore unlikely to exist in Rao et al.’s sample and that this dust-bias (relative to deeper surveys like SDSS) may invalidate Nestor et al.’s assumption. From this point of view, it may not be surprising that our results agree with the conclusion of Nestor et al. since most, but not all, of the absorbers in our sample occult relatively bright QSOs.
3.1 Comparison with higher redshift DLAs
At higher redshifts (), Wolfe & Prochaska (1998) tentatively noted a correlation between and metallicity from a sample of 17 DLAs. Péroux et al. (2003) found a similarly tentative [Zn/H]– correlation from a larger sample of DLAs and sub-DLAs over the redshift range . However, Ledoux et al. (2006, hereafter L06) very recently found a relatively tight and clear [M/H]– correlation from a sample of UVES spectra containing 70 DLAs and sub-DLAs over the range . They defined from different transitions of several low ionization species (O i, Si ii, Fe ii, Cr ii, S ii) with moderate optical depths such that the strongest velocity component absorbed between 10 and 60 per cent of the continuum. Since many of the DLAs in the L06 sample are at where the Mg ii lines are not observable with optical spectroscopy, a complete comparison between the L06 sample and ours is difficult. Nevertheless, it is clear that, since is a measure of , the [M/H]– correlation in Fig. 1 persists at higher redshifts.
L06 fit their [M/H]– data using the least squares bisector method of Isobe et al. (1990), finding the best-fit relationship to be . For comparison, we performed fits using the same bisector technique after converting our values to according to the simple relation . The proportionality constant is derived from a fit of versus , with the inverse of the variances on used as weights, for the 18 absorbers which appear in both our sample and that of L06. The fiducial sample is best-fitted by the relation
| (2) |
which is consistent with the relation found by L06.
Table 2 shows the intercept and slope of the [M/H]– relationship for the different sub-samples. In particular, we find no evidence for significant differences in or in the low- and high- sub-samples. This is similar to the results of L06 who find the slope and intercept to be statistically consistent in two redshift bins split at . We also note that the median and [M/H] of our low- sub-sample are marginally higher than at high-: Å and for the former compared with Å and for the latter. Again, L06 find similar trends.
3.2 Mass–metallicity correlation or anti-correlation?
The [M/H]– (or [M/H]–) correlation in DLAs and sub-DLAs provides an important link between the kinematics of the absorber and the metal-enrichment history of the absorber. However, one would like to go a step further and link the metallicity with the mass of the halo in which the absorber resides. This step is potentially confusing. For example, many authors have, in the past, tacitly assumed that the absorption-line kinematics are a reliable tracer of the host-galaxy kinematics. That is, is assumed to positively correlate with the circular velocity of the host-galaxy. By presuming this detail of the absorber–galaxy connection – which should instead be observationally determined – one would conclude that (and ) is correlated with the galaxy mass. L06 make this latter assumption and use it to constrain the implied mass–metallicity relationship. Indeed, they find this to be consistent with the luminosity–metallicity relationship derived from local galaxies.
However, the assumption that galaxy or halo mass is correlated with is challenged by new observations. Bouché et al. (2006, hereafter B06) identified 1806 Mg ii systems with Å and luminous red galaxies (LRGs) within projected co-moving distances of of the absorbers. The ratio of the absorber–LRG cross-correlation to the LRG–LRG auto-correlation provides a measure of the bias-ratio between absorbers and LRGs. In hierarchical structure formation scenarios the bias scales with halo mass, so the clustering of LRGs around the Mg ii absorbers provides a measure of the absorber halo mass. With this approach, B06 found that halo mass and are anti-correlated. They also found that by combining the previously observed luminosity- and -dependence of the absorber cross-section, or by combining the cross-section’s luminosity-dependence with the observed incidence probability of strong Mg ii absorbers, , one finds that luminosity (or mass) and should be anti-correlated. Prochter et al. (2006) reached a similar conclusion by interpreting the observed redshift evolution of the number density of strong Mg ii systems with simple cross-section arguments.
Of course, the main difference between the B06 absorber sample and the one studied here is that B06 used strong Mg ii absorbers while we study DLAs and strong sub-DLAs. It is possible that a mass– correlation does exist for DLAs if the sharp drop in halo-mass observed by B06 for Mg ii systems with Å were dominated by systems with neutral hydrogen column densities below the lower limit imposed here, i.e. . However, this seems very unlikely given that the fraction of strong Mg ii systems which are DLAs [i.e. have ] increases from to per cent over the range – Å (Rao et al., 2006). It is therefore important to confirm or refute the B06 results, which derive from SDSS Data Release 3. Bouché et al. (2007, in preparation) will present an analysis based on a significantly increased sample of absorbers from Data Release 5.
3.3 Are strong Mg ii absorbers caused by outflows?
B06 interpret their observed mass– anti-correlation as evidence that outflows become the dominant mechanism for producing Mg ii absorbers as increases beyond Å. They reason that outflows are more easily ejected from lower mass star-forming galaxies and so, when viewed along a random QSO sight-line, are more likely to produce more Mg ii velocity components over a larger velocity range. In this outflow picture, and the number of Mg ii velocity components may be inversely related to the mass and could depend more strongly on the recent star-formation history of the host-galaxy. L06 mention that some fraction of DLAs could be caused by outflows, but they again attribute the outflow velocity spread to be directly related to the depth of the host galaxy’s potential well.
An initial objection to the outflow model for DLAs and strong Mg ii systems might be that such hot, highly ionized material may not produce velocity components of cold gas which can be traced with low-ionization species such as Mg ii. However, the outflows from local starburst galaxies are well-known to contain clouds of cold gas and dust (Lehnert & Heckman, 1996; Martin, 1999; Heckman et al., 2000; Rupke et al., 2005; Martin, 2006). Dense, molecular gas is also known to be entrained in smaller scale outflows (e.g. Nakai et al., 1987) and even the ionization cones of nearby active galactic nuclei which show starburst activity (e.g. Irwin & Sofue, 1992; Curran et al., 1999). Moreover, Norman et al. (1996) identified Mg ii absorption in spectra of two QSO sight-lines with impact parameters and near the galaxy NGC 520, a local starburst with super-winds, a disturbed morphology and filamentary H emission along its minor axis. Thus, it seems clear that outflows from star-forming galaxies do contain cold gas.
If indeed many high- Mg ii absorbers are caused by outflows and these outflows do indeed entrain cold clouds (or cold gas clumps cool out of the hotter outflow medium), do we observe tracers of the cold, dusty gas, such as molecular hydrogen? is identified via UV absorption in the Lyman and Werner bands and is known to arise in very cold, dusty velocity components (e.g. Ledoux et al., 2003). It is therefore notable that 3 of the 5 highest- systems in Fig. 1 are known to contain . Indeed, the two highest- systems, those towards Q 0013-0029 and Q 0551-366, both contain (Ledoux et al., 2002; Petitjean et al., 2002) and have values at the extreme of the distribution obtained from large SDSS Mg ii surveys (e.g. Nestor et al., 2003; Prochter et al., 2006). The median for the absorbers in our sample is Å compared with Å for the sample as a whole (Table 2). Even with only six systems, a Kolmogorov-Smirnov test gives a probability of just 9 per cent that the equivalent widths of the absorbers are drawn from the same parent population as the rest of the sample.
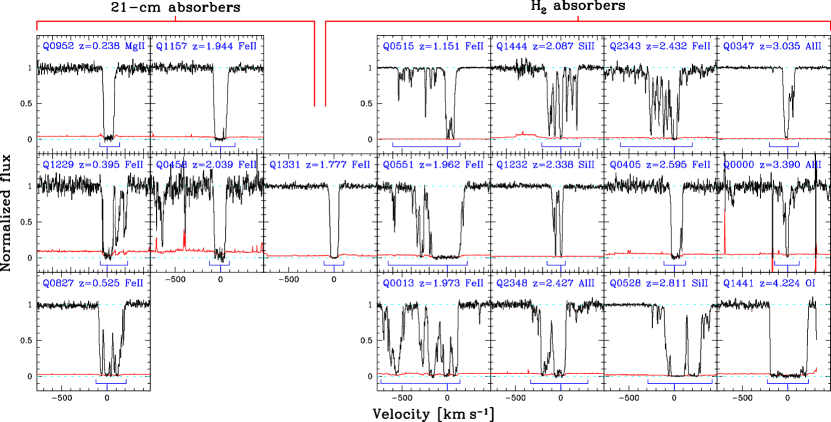
In Fig. 2 we compare the velocity structures of all the 13 known H2-bearing DLAs and sub-DLAs. It is striking how similar the velocity structures are for the systems towards Q 05154414, Q 0551366 and Q 00130029: each is spread over and comprises at least three groups of stronger velocity components separated by few (if any) weaker components. The systems towards Q 1444014 and Q 2343125 have very similar profiles and these are not dissimilar to the above three. Also, the systems towards Q 2348011 and Q 0528250 both have two broad, saturated regions separated by a narrow region of low optical depth. Such structures and symmetries have been discussed by Bond et al. (2001) and Ellison et al. (2003) as being the characteristic signs of absorption in galactic outflows. It is also conceivable that these profiles are produced in galaxy mergers (but see discussion in Bond et al., 2001).
Although no strong conclusions can be reached due to the sample size, Fig. 2 nevertheless suggests that approximately half of the known H2-bearing systems may arise in outflows. If indeed cold gas and dust is entrained in outflows and the gas is well-shielded then H2 should form on the surface of dust-grains. Even if this happens in very few clouds, the large number of clouds across these profiles significantly increases the probability of observing one or more H2-bearing clouds towards any given background QSO. Hence, even if these outflow-like absorption profiles are themselves rare, H2 may be found within them in a large fraction of cases.
Fig. 2 also shows the velocity structures of the 21-cm absorbers in our sample for which UVES spectra were available. These velocity structures are typical of those in the general population, seemingly consistent with the fact that the 21-cm absorbers are generally indistinct from most other systems in the [M/H]– plane (Fig. 1). Like H2 absorption, 21-cm absorption should arise in cold clouds, but there is no evidence in Fig. 2 to suggest that 21-cm absorbers also arise in the complicated and broad outflow-like profiles like the H2 systems. However, the 21-cm sample is very small and is dominated by low- systems; outflows are likely to be less common below due to the general decline in the global star-formation rate density (see, e.g., Bond et al., 2001).
L06 note that, under the assumption of a mass-metallicity relationship, the absorbers with the highest equivalent widths and metallicities will be most easily detected in direct imaging observations. This prediction is also natural in the outflow picture where and the number of Mg ii velocity components are related to both the mass and the recent star-formation history of the absorber host-galaxy. While one expects the highest and highest [M/H] systems to be hosted by lower mass galaxies, they should be actively star-forming and show strong H emission. If indeed H2-bearing systems more often probe star-forming galaxies with outflows, they may be more reliable tracers of the cosmological evolution of metallicity than other DLAs, many of which might not be closely linked to star-formation sites/processes in high- galaxies. We have already advanced this possibility in Curran et al. (2004) and Murphy et al. (2004) based on a comparison of H2 absorber metallicities with those of the general DLA population. The H2 absorbers showed a faster, more well-defined increase in [M/H] with decreasing redshift, although the sample was quite small. A much larger sample of H2-bearing systems is required to compute the -weighted metallicity evolution in a way comparable with general DLA samples.
4 Conclusions
For 49 DLAs and sub-DLAs with published metallicities we have measured or gathered from the literature their Mg ii rest-frame equivalent widths to search for an empirical relationship between the kinematic spread, , in the absorbing metal-line velocity components and the total absorber metallicity. The vast majority of DLAs and strong sub-DLAs have Å which means that most Mg ii velocity components across the absorption profile are saturated. Thus, provides a simple measure of which can be derived even from relatively low-resolution QSO spectra.
We find a correlation between [M/H] and at the significance level of [Fig. 1(left)] which increases to when the [M/H] values are corrected for mild cosmological evolution over the sample’s redshift range of [Fig. 1(right)]. Even for our most conservative sub-sample, where we include only 26 DLAs (no sub-DLAs) with Zn-metallicities and Å, we still find a correlation at ( after redshift-correction of [M/H]). After converting the values to , the slope of our [M/H]– relationship is consistent with that reported recently by Ledoux et al. (2006) for generally higher- DLAs and sub-DLAs, suggesting that the [M/H]– correlation persists up to . Although we find a lower statistical significance for the correlation below , the fitted slope and intercept of the [M/H]– data is similar for the and sub-samples. Finally, we find marginal () evidence for increased variance in metallicity above Å. However, the evidence weakens once the [M/H] values are corrected for evolution; other non-intrinsic sources of metallicity scatter may need to be addressed before such an effect can be verified.
If one assumes that the metal-line absorption kinematics trace the host-galaxy kinematics – that is proportional to the host-galaxy circular velocity – then it is natural to translate the observed [M/H]– correlation into a correlation between [M/H] and galaxy mass. Indeed, Ledoux et al. (2006) make this assumption and find that the resulting [M/H]–mass correlation is consistent with the [M/H]–luminosity relationship derived from local galaxies. However, by studying the clustering of galaxies around strong Mg ii absorbers in the SDSS, Bouché et al. (2006) find that mass is anti-correlated with . This result, together with the [M/H]– relationship observed here, implies that the absorber metallicity is anti-correlated with halo or galaxy mass. It is therefore important to confirm or refute the results of Bouché et al. and to address the assumption of Ledoux et al. (2006) with observations.
Finally, we note that about half of the known absorbers have very broad velocity structures which show distinct distributions of velocity components (Fig. 2). The patterns, groups and symmetries evident in these cases are consistent with an outflow origin for the bulk of the components. Since outflows can entrain cold, dusty gas and since they should provide a large number of velocity components, the probability of finding one or more -bearing components in any given outflow-driven absorber might be quite high, even though -bearing components are themselves quite rare. This suggests the targeting of high- absorbers to identify more -bearing systems. Given the [M/H]– correlation we observe, this may be similar to the metallicity-selection approach of Petitjean et al. (2006). However, it has the advantage that one can determine with only moderate-resolution spectra – or infer it from the equivalent width of bluer transitions when – which need not be blue- or UV-sensitive (e.g. SDSS spectra) . One can then follow-up the highest systems with high-resolution, UV- or blue-sensitive spectra to search for absorption.
Acknowledgments
We thank N. Bouché for many discussions and critical comments which significantly improved the paper and S. Ellison for providing her measurements. We also thank H.-W. Chen for comments on an early draft. MTM thanks PPARC for an Advanced Fellowship. Some of this research was based on observations made with ESO Telescopes at the Paranal Observatories under programme IDs listed in Table 1. This research has made use of the NASA/IPAC Extragalactic Database (NED) which is operated by the Jet Propulsion Laboratory, California Institute of Technology, under contract with the National Aeronautics and Space Administration. This research has also made use of NASA’s Astrophysics Data System Bibliographic Services.
References
- Akerman et al. (2005) Akerman C. J., Ellison S. L., Pettini M., Steidel C. C., 2005, A&A, 440, 499
- Aldcroft et al. (1994) Aldcroft T. L., Bechtold J., Elvis M., 1994, ApJS, 93, 1
- Bergeron & Boissé (1991) Bergeron J., Boissé P., 1991, A&A, 243, 344
- Bergeron et al. (1992) Bergeron J., Cristiani S., Shaver P. A., 1992, A&A, 257, 417
- Boisse et al. (1998) Boisse P., Le Brun V., Bergeron J., Deharveng J., 1998, A&A, 333, 841
- Bond et al. (2001) Bond N. A., Churchill C. W., Charlton J. C., Vogt S. S., 2001, ApJ, 562, 641
- Bouché et al. (2006) Bouché N., Murphy M. T., Péroux C., Csabai I., Wild V., 2006, MNRAS, 371, 495
- Boulade et al. (1987) Boulade O., Kunth D., Tytler D., Vigroux L., 1987, in Bergeron J., Kunth D., Rocca-Volmerange B., Tran Thanh van J., eds, High Redshift and Primeval Galaxies. Gif-sur-Yvette: Editions Frontiéres, France, p. 349
- Centurión et al. (2003) Centurión M., Molaro P., Vladilo G., Péroux C., Levshakov S. A., D’Odorico V., 2003, A&A, 403, 55
- Chen & Lanzetta (2003) Chen H.-W., Lanzetta K. M., 2003, ApJ, 597, 706
- Christensen et al. (2005) Christensen L., Schulte-Ladbeck R. E., Sánchez S. F., Becker T., Jahnke K., Kelz A., Roth M. M., Wisotzki L., 2005, A&A, 429, 477
- Churchill et al. (2000) Churchill C. W., Mellon R. R., Charlton J. C., Jannuzi B. T., Kirhakos S., Steidel C. C., Schneider D. P., 2000, ApJ, 543, 577
- Churchill et al. (2003) Churchill C. W., Mellon R. R., Charlton J. C., Vogt S. S., 2003, ApJ, 593, 203
- Curran et al. (1999) Curran S. J., Rydbeck G., Johansson L. E. B., Booth R. S., 1999, A&A, 344, 767
- Curran et al. (2004) Curran S. J., Webb J. K., Murphy M. T., Carswell R. F., 2004, MNRAS, 351, L24
- de la Varga et al. (2000) de la Varga A., Reimers D., Tytler D., Barlow T., Burles S., 2000, A&A, 363, 69
- Dessauges-Zavadsky et al. (2004) Dessauges-Zavadsky M., Calura F., Prochaska J. X., D’Odorico S., Matteucci F., 2004, A&A, 416, 79
- Dessauges-Zavadsky et al. (2003) Dessauges-Zavadsky M., Péroux C., Kim T.-S., D’Odorico S., McMahon R. G., 2003, MNRAS, 345, 447
- Dessauges-Zavadsky et al. (2006) Dessauges-Zavadsky M., Prochaska J. X., D’Odorico S., Calura F., Matteucci F., 2006, A&A, 445, 93
- Djorgovski et al. (1996) Djorgovski S. G., Pahre M. A., Bechtold J., Elston R., 1996, Nat, 382, 234
- Drinkwater et al. (1993) Drinkwater M. J., Webster R. L., Thomas P. A., 1993, AJ, 106, 848
- Ellison (2006) Ellison S. L., 2006, MNRAS, 368, 335
- Ellison et al. (2003) Ellison S. L., Mallén-Ornelas G., Sawicki M., 2003, ApJ, 589, 709
- Heckman et al. (2000) Heckman T. M., Lehnert M. D., Strickland D. K., Armus L., 2000, ApJS, 129, 493
- Irwin & Sofue (1992) Irwin J. A., Sofue Y., 1992, ApJ, 396, L75
- Isobe et al. (1990) Isobe T., Feigelson E. D., Akritas M. G., Babu G. J., 1990, ApJ, 364, 104
- Junkkarinen et al. (2004) Junkkarinen V. T., Cohen R. D., Beaver E. A., Burbidge E. M., Lyons R. W., Madejski G., 2004, ApJ, 614, 658
- Khare et al. (2004) Khare P., Kulkarni V. P., Lauroesch J. T., York D. G., Crotts A. P. S., Nakamura O., 2004, ApJ, 616, 86
- Kulkarni et al. (2005) Kulkarni V. P., Fall S. M., Lauroesch J. T., York D. G., Welty D. E., Khare P., Truran J. W., 2005, ApJ, 618, 68
- Lanzetta & Bowen (1990) Lanzetta K. M., Bowen D., 1990, ApJ, 357, 321
- Lanzetta & Bowen (1992) Lanzetta K. M., Bowen D. V., 1992, ApJ, 391, 48
- Lanzetta et al. (1991) Lanzetta K. M., McMahon R. G., Wolfe A. M., Turnshek D. A., Hazard C., Lu L., 1991, ApJS, 77, 1
- Le Brun et al. (1997) Le Brun V., Bergeron J., Boisse P., Deharveng J. M., 1997, A&A, 321, 733
- Ledoux et al. (2002) Ledoux C., Bergeron J., Petitjean P., 2002, A&A, 385, 802
- Ledoux et al. (2006) Ledoux C., Petitjean P., Fynbo J. P. U., Møller P., Srianand R., 2006, A&A, 457, 71 (L06)
- Ledoux et al. (2003) Ledoux C., Petitjean P., Srianand R., 2003, MNRAS, 346, 209
- Ledoux et al. (2002) Ledoux C., Srianand R., Petitjean P., 2002, A&A, 392, 781
- Lehnert & Heckman (1996) Lehnert M. D., Heckman T. M., 1996, ApJ, 462, 651
- Lodders (2003) Lodders K., 2003, ApJ, 591, 1220
- Lopez & Ellison (2003) Lopez S., Ellison S. L., 2003, A&A, 403, 573
- Lopez et al. (2005) Lopez S., Reimers D., Gregg M. D., Wisotzki L., Wucknitz O., Guzman A., 2005, ApJ, 626, 767
- Lopez et al. (1999) Lopez S., Reimers D., Rauch M., Sargent W. L. W., Smette A., 1999, ApJ, 513, 598
- Martin (1999) Martin C. L., 1999, ApJ, 513, 156
- Martin (2006) Martin C. L., 2006, ApJ, 647, 222
- Meyer et al. (1995) Meyer D. M., Lanzetta K. M., Wolfe A. M., 1995, ApJ, 451, L13
- Meyer & York (1992) Meyer D. M., York D. G., 1992, ApJ, 399, L121
- Møller & Warren (1993) Møller P., Warren S. J., 1993, A&A, 270, 43
- Murphy et al. (2004) Murphy M. T., Curran S. J., Webb J. K., 2004, in Duc P.-A., Braine J., Brinks E., eds, IAU Symp. Ser. Vol. 217, Recycling intergalactic and interstellar matter. Astron. Soc. Pac., San Francisco, CA, U.S.A, p. 252
- Nakai et al. (1987) Nakai N., Hayashi M., Handa T., Sofue Y., Hasegawa T., Sasaki M., 1987, Publ. Astron. Soc. Japan, 39, 685
- Nestor et al. (2003) Nestor D. B., Rao S. M., Turnshek D. A., Vanden Berk D., 2003, ApJ, 595, L5
- Norman et al. (1996) Norman C. A., Bowen D. V., Heckman T., Blades C., Danly L., 1996, ApJ, 472, 73
- Péroux et al. (2003) Péroux C., Dessauges-Zavadsky M., D’Odorico S., Kim T., McMahon R. G., 2003, MNRAS, 345, 480
- Péroux et al. (2004) Péroux C., Deharveng J.-M., Le Brun V., Cristiani S., 2004, MNRAS, 352, 1291
- Péroux et al. (2006) Péroux C., Kulkarni V. P., Meiring J., Ferlet R., Khare P., Lauroesch J. T., Vladilo G., York D. G., 2006, A&A, 450, 53
- Petitjean & Bergeron (1990) Petitjean P., Bergeron J., 1990, A&A, 231, 309
- Petitjean et al. (2006) Petitjean P., Ledoux C., Noterdaeme P., Srianand R., 2006, A&A, 456, L9
- Petitjean et al. (2002) Petitjean P., Srianand R., Ledoux C., 2002, MNRAS, 332, 383
- Pettini et al. (1999) Pettini M., Ellison S. L., Steidel C. C., Bowen D. V., 1999, ApJ, 510, 576
- Pettini et al. (2000) Pettini M., Ellison S. L., Steidel C. C., Shapley A. E., Bowen D. V., 2000, ApJ, 532, 65
- Pettini et al. (1997) Pettini M., King D. L., Smith L. J., Hunstead R. W., 1997, ApJ, 478, 536
- Prochaska et al. (2001) Prochaska J. X., Gawiser E., Wolfe A. M., 2001, ApJ, 552, 99
- Prochaska et al. (2003a) Prochaska J. X., Gawiser E., Wolfe A. M., Castro S., Djorgovski S. G., 2003a, ApJ, 595, L9
- Prochaska et al. (2003b) Prochaska J. X., Gawiser E., Wolfe A. M., Cooke J., Gelino D., 2003b, ApJS, 147, 227
- Prochaska et al. (2006) Prochaska J. X., O’Meara J. M., Herbert-Fort S., Burles S., Prochter G. E., Bernstein R. A., 2006, ApJ, 648, L97
- Prochaska & Wolfe (1999) Prochaska J. X., Wolfe A. M., 1999, ApJS, 121, 369
- Prochter et al. (2006) Prochter G. E., Prochaska J. X., Burles S. M., 2006, ApJ, 639, 766
- Rao et al. (2003) Rao S. M., Nestor D. B., Turnshek D. A., Lane W. M., Monier E. M., Bergeron J., 2003, ApJ, 595, 94
- Rao & Turnshek (2000) Rao S. M., Turnshek D. A., 2000, ApJS, 130, 1
- Rao et al. (1995) Rao S. M., Turnshek D. A., Briggs F. H., 1995, ApJ, 449, 488
- Rao et al. (2006) Rao S. M., Turnshek D. A., Nestor D. B., 2006, ApJ, 636, 610
- Rupke et al. (2005) Rupke D. S., Veilleux S., Sanders D. B., 2005, ApJS, 160, 115
- Ryabinkov et al. (2003) Ryabinkov A. I., Kaminker A. D., Varshalovich D. A., 2003, A&A, 412, 707
- Ryan-Weber et al. (2003) Ryan-Weber E. V., Webster R. L., Staveley-Smith L., 2003, MNRAS, 343, 1195
- Spinrad & McKee (1979) Spinrad H., McKee C. F., 1979, ApJ, 232, 54
- Steidel et al. (1994) Steidel C. C., Dickinson M., Persson S. E., 1994, ApJ, 437, L75
- Steidel & Sargent (1992) Steidel C. C., Sargent W. L. W., 1992, ApJS, 80, 1
- Weatherley et al. (2005) Weatherley S. J., Warren S. J., Møller P., Fall S. M., Fynbo J. U., Croom S. M., 2005, MNRAS, 358, 985
- Wolfe et al. (1985) Wolfe A. M., Briggs F. H., Turnshek D. A., Davis M. M., Smith H. E., Cohen R. D., 1985, ApJ, 294, L67
- Wolfe & Prochaska (1998) Wolfe A. M., Prochaska J. X., 1998, ApJ, 494, L15
- Wolfe et al. (1986) Wolfe A. M., Turnshek D. A., Smith H. E., Cohen R. D., 1986, ApJS, 61, 249
- York et al. (2006) York D. G. et al., 2006, MNRAS, 367, 945
This paper has been typeset from a TeX/LaTeX file prepared by the author.