Star Formation in the LMC: Gravitational Instability and Dynamical Triggering
Abstract
Evidence for triggered star formation is difficult to establish because energy feedback from massive stars tend to erase the interstellar conditions that led to the star formation. Young stellar objects (YSOs) mark sites of current star formation whose ambient conditions have not been significantly altered. Spitzer observations of the Large Magellanic Cloud (LMC) effectively reveal massive YSOs. The inventory of massive YSOs, in conjunction with surveys of interstellar medium, allows us to examine the conditions for star formation: spontaneous or triggered. We examine the relationship between star formation and gravitational instability on a global scale, and we present evidence of triggered star formation on local scales in the LMC.
keywords:
stars: formation, stars: pre-main-sequence, ISM: evolution, ISM: structure, galaxies: ISM, Magellanic Clouds1 Introduction
The star formation process is intertwined with the evolution of the interstellar medium (ISM). After the onset of a burst of star formation, massive stars photoionize the ambient ISM into an H II region, and subsequently energize the ambient medium via fast stellar winds and supernova ejecta to form a superbubble. The expansion of H II regions and superbubbles can trigger further star formation. If triggered star formation continues at a high level over an extended period of time, 10 Myr, a kpc-sized supergiant shell may be produced. On the other hand, if a superbubble does not trigger a significant level of star formation, after the O stars have exploded and the remaining stars have dispersed, the superbubble will recombine into an H I shell with no obvious concentration of stars within its boundary.
To illustrate triggered star formation, a causal relationship between the prenatal interstellar conditions and the formation of stars need to be convincingly established. Main-sequence and evolved massive stars trace star formation in the past few Myr, but their prenatal interstellar conditions have been significantly altered by the injection of stellar energies. Massive young stellar objects (YSOs), having a short lifetime, trace the current star formation, while their prenatal interstellar conditions are still intact; therefore, massive YSOs and their environment can be used to investigate triggered star formation.
We have chosen the Large Magellanic Cloud (LMC) to investigate the star formation processes because of the following advantages: (1) The LMC is at a small distance, 50 kpc, so that stars can be resolved and the ISM can be mapped with high linear resolution, and it has a nearly face-on orientation so that confusion along the line-of-sight is minimal. (2) The ISM of the LMC has been well mapped - MCELS survey of ionized gas (Smith 1999), ATCA+Parkes survey of the H I gas (Kim et al. 2003), and NANTEN survey of molecular gas (Fukui et al. 2001). (3) A complete inventory of massive YSOs can be obtained from the Spitzer IRAC and MIPS survey of the LMC (Meixner et al. 2006).
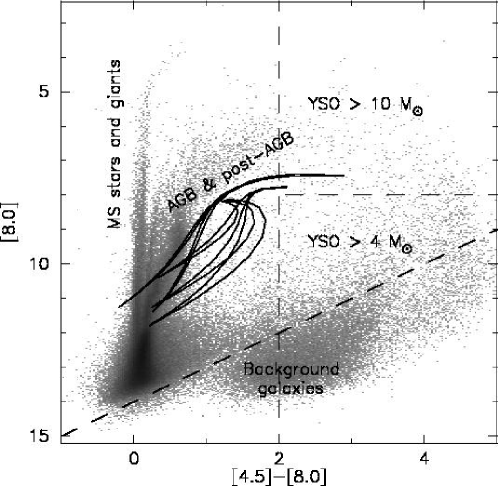
We have identified point sources in the Spitzer IRAC and 24m MIPS images and made photometric measurements. Color-color and color-magnitude diagrams are used in conjunction with spectral energy distributions (SEDs) to diagnose YSO candidates from these point sources. Figure 1 shows an example of color-magnitude diagram in the IRAC 4.5 and 8.0 m bands. The main-sequence stars and giants have zero colors, [4.5]-[8.0] 0. Contaminations of AGB and post-AGB stars and background galaxies can be largely avoided by employing appropriate color or brightness cutoffs (Groenewegen 2006; Evans et al. 2005). Known AGB stars and planetary nebulae are removed from the source list. The final YSO candidates are located in the upper right wedge in Figure 1.
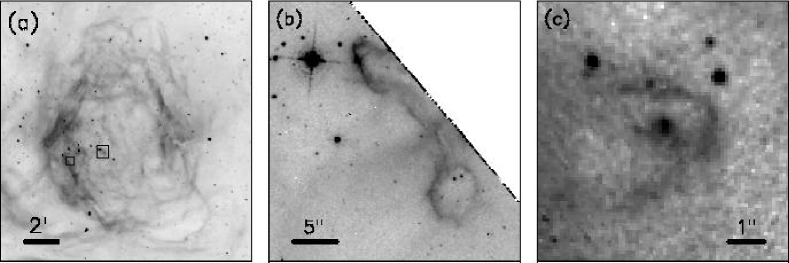
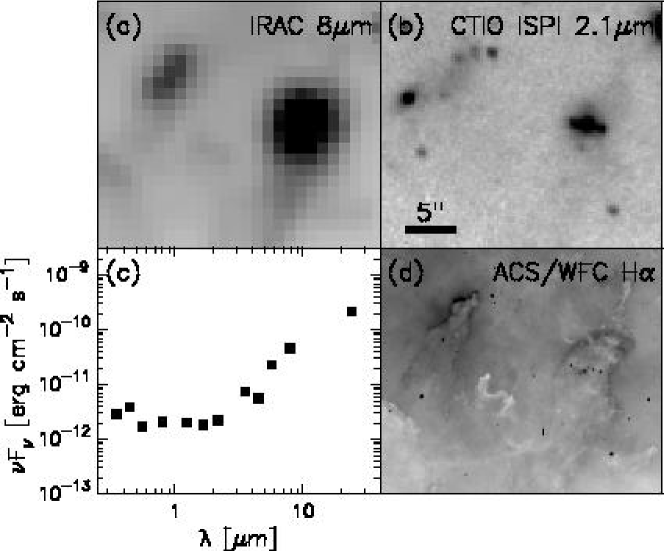
While Spitzer observations allow us to identify YSOs in the LMC, the angular resolution severely limits our ability to determine the YSOs’ physical properties in detail. Figure 2 illustrates this problem in the H II region N11B. The bright source identified at 8 m has a SED consistent with a YSO with a substantial envelope. However, a high-resolution 2.1 m image taken with the ISPI on the CTIO Blanco 4m telescope shows at least three sources within the point-spread-function of the 8 m source; furthermore, a Hubble Space Telescope (HST) ACS/WFC H image shows multiple sources within a dust pillar whose surface is ionized. It is not clear how much nebular emission contributes to the 8 m source and whether one or multiple YSOs are present.
The YSOs identified from Spitzer observations clearly do not provide unambiguous information about their masses and multiplicity. They are nevertheless excellent markers of sites of current star formation and allow us to examine the star formation process in the LMC both on global and local scales.
2 Star Formation on a Global Scale
Star formation activity is seen throughout the disk of the LMC. We will examine the relationship between the distribution of star formation and the gravitational instability on a global scale. In the first case, we consider only a thin gaseous disk, and in the second case we add the stellar contribution to the disk.
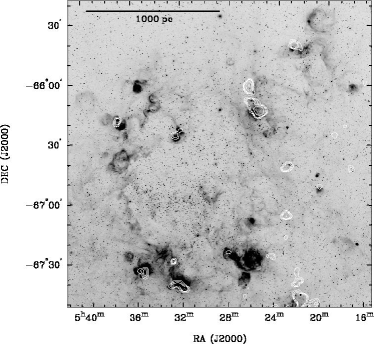
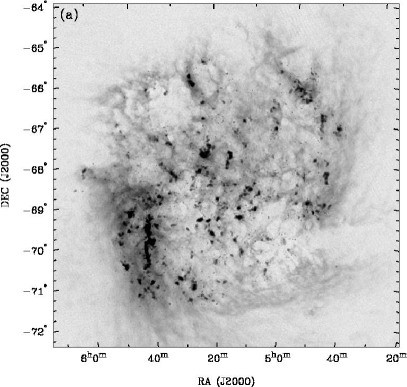
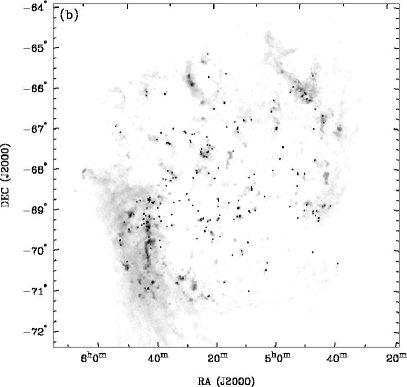
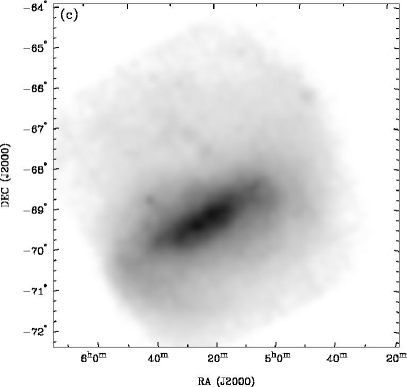
A thin, differentially rotating gaseous disk is stable to axisymmetric perturbations, if , where and are the surface density and the sound speed of the gas, and is the epicycle frequency (Binney & Tremaine 1987). The total gas surface density map of the LMC (Fig. 3a) is derived from the the ATCA+Parkes H I survey by Kim et al. (2003) and the NANTEN CO survey by Fukui et al. (2001). (The total gas mass is .) The epicycle frequency as a function of radial distance is calculated from the H I rotation curve (Kim et al. 1998). The sound speed of gas is assumed to be 5 km s-1. The resultant gravitational instability map of the LMC is displayed in Figure 3b, where shaded regions are unstable, with , and the darkness of the shade increases with the degree of instability. The Spitzer sample of massive YSO candidates are also marked in Figure 3b. It is evident that only about 1/2 of the YSO candidates are located in gravitationally unstable regions.
To add stellar contributions to the gravitational instability, we follow Rafikov’s (2001) treatment of a disk galaxy consisting of a collisional gas disk and a collisionless stellar disk. The instability condition becomes
| (1) |
where with and being the surface density and the radial velocity dispersion of the stars, is the Bessel function of order zero, , and with being the wavenumber of the axisymmetric perturbations.
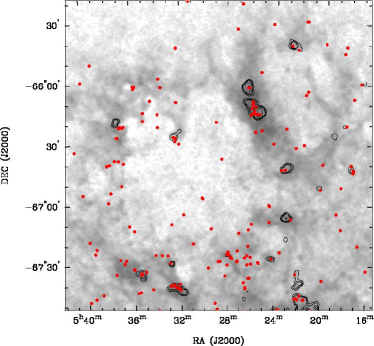
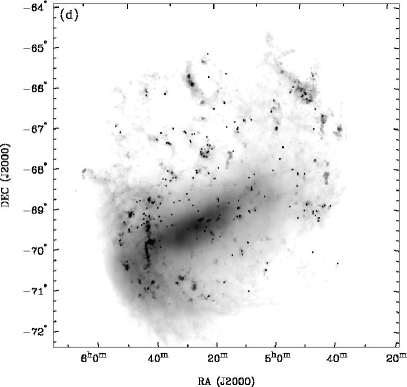
To estimate , we use a normalized distribution of the 3.6 m sources detected in the Spitzer survey of the LMC (Gruendl et al. 2007, in prep) and a total stellar mass of (Kim et al. 1998). Note that the 3.6 m point sources, rather than the direct image, are used to avoid the contamination of diffuse emission from dust, and that each source is weighted by its brightness in the calculation. The resulting stellar surface density map is shown in Figure 3c. We adopt a stellar radial velocity dispersion of 15 km s-1, and use the same described above. Finally, we calculate the value of at each pixel by finding its global minimum as a function of the wavenumber (see Eq. 1), following the same approach used by Jog (1996) and Rafikov (2001). The resultant gravitational instability map of the LMC is presented in Figure 3d, where shaded regions are unstable, with , and the darkness of the shade increases with the degree of instability. The vast majority of the massive YSO candidates are located within gravitationally unstable regions, in sharp contrast to the first case that includes only the gas disk.
From our analysis of the gravitational instability of the LMC, we conclude that the stellar disk’s contribution cannot be ignored. More importantly, the current star formation appears to occur mostly in regions that are unstable against perturbation, implying that star formation can be triggered more easily in the gravitationally unstable regions.
3 Star Formation on Local Scales
Triggered star formation is commonly seen in the LMC at various scales. Below we give three such examples.
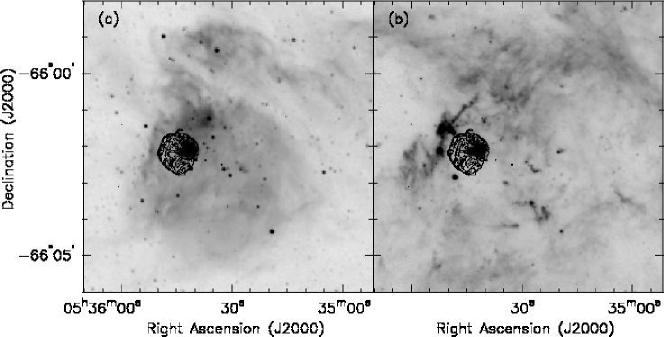
Star formation triggered by H II region and enriched by supernova ejecta – N63 shown in Figure 4. The H II region N63 is ionized by the OB association LH 83. A young supernova remnant (SNR), N63A, has been identified in the H II region, as delineated by the X-ray emission. Spitzer IRAC 8 m image shows prominent current star formation on the northeastern rim of the H II region, not in contact with the SNR.
Star formation triggered by photo-implosion of dust globules in a superbubble – N51D shown in Figure 5 (Chu et al. 2005). Three YSOs projected within the superbubble N51D are found to be coincident with dust globules. The thermal pressure of the warm photoionized gas on the surface of the dust globules is several times higher than those of the hot gas in the superbubble interior and the cold molecular gas in the dust globules, indicating that the dust globules are compressed by their high external pressure raised by photoionization and the associated heating.
Star formation triggered by collision of interstellar shells – supergiant shells LMC-4 and LMC-5 shown in Figure 6. These two supergiant shells are expanding into each other, and the colliding region shows a bright ridge of H I and molecular clouds. On-going, active star formation is seen in the colliding region.
4 Conclusions
The LMC is an excellent site to study star formation processes. Our investigation suggests that global-scale gravitational instabilities prepare the conditions for star formation, but dynamical triggering on local scales determines where to set off the star formation and complete the job.
Acknowledgements.
This research is supported by the Spitzer grant JPL 1264494.References
- [Binney & Tremaine (1987)] Binney, J. & Tremaine, S. 1987, Galactic Dynamics (Princeton University Press)
- [Chu et al. (2005)] Chu, Y.-H., et al. 2005, ApJ Letters 634, L189
- [Evans et al. (2005)] Evans, N.J., & c2d Team 2005, AAS Meeting 207, #95.02
- [Fukui et al. (2001)] Fukui, Y., Mizuno, N., Yamaguchi, R., Mizuno, A., & Onishi, T. 2001, PASJ 53, L41
- [Groenewegen (2006)] Groenewegen, M.A.T. 2006, A&A 448, 181
- [Jog (1996)] Jog, C.J. 1996, MNRAS 278, 209
- [Kim et al. (1998)] Kim, S., et al. 1998, ApJ 503, 674
- [Kim et al. (2003)] Kim, S., et al. 2003, ApJS 148, 473
- [Meixnet et al. (2006)] Meixner, M., et al. 2006, AJ 132, 2268
- [Rafikov (2001)] Rafikov, R.R. 2001, MNRAS 323, 445
- [Smith et al. (1999)] Smith, R.C., et al. 1999, IAU Symposium 190, p.28