Optical and X-ray Variability of AGNs
Abstract
I present new comparisons of AGN optical, UV, and X-ray variations. These reveal complex relationships between the different passbands that can change with time in a given object. While there is evidence from several objects that X-ray and optical activity levels are correlated on long timescales, variations on shorter timescales can occur independently. It is proposed that the combination of correlated and uncorrelated short-timescale variability is a consequence of anisotropic high-energy emission. It is also argued that the correlation between X-ray and optical variability on long timescales must be due to a common underlying factor and not to reprocessing of X-ray radiation.
Department of Physics & Astronomy, University of Nebraska, Lincoln, NE 68588-0111, USA
1. Introduction
Lyuty (1978) showed that the X-ray and optical continuum fluxes of NGC 415 tracked one another on a timescale of months. The general expectation until fairly recently has been that the X-ray and optical would correlate with each other (e.g., Collin-Souffrin 1991). However, in recent years there have been various cases where the X-rays have not correlated with the optical. The most interesting of these has been NGC 3516 (Maoz et al. 2002). Here I give some results of our optical/X-ray monitoring of three very different AGNs and propose a mechanism to explain the curious combination of correlated and uncorrelated optical and X-ray variability seen in AGNs.
1.1. NGC 5548 – a Typical Broad-Line Seyfert 1
In 1998 we carried out a short RXTE/ASCA/EUVE/optical observing campaign (Chiang et al. 2000; Dietrich et al. 2001). During this campaign the EUVE flux led all other passbands. The RXTE PCA 2–10 keV flux lagged the EUVE by days. The ASCA SIS 0.5–1 keV flux lagged the EUVE by days. Combining the delays for all optical passbands in Dietrich et al. (2001) we find the optical lagging the EUVE by days. However, while the optical and EUVE show the same trend over our 30 day monitoring period, during our most intensive 5 days of simultaneous monitoring the detailed agreement is poor. The correlated flux variability between the X-ray and EUV fluxes in 1998 could be merely fortuitous. Haba et al. (2003) give an example of where there is a factor of two dip in the EUV flux over a few hours while the ASCA X-ray flux remains constant.
Uttley et al. (2003, see also these proceedings) have shown that there is a good correlation on a long ( one month) timescale between the hard (2–10 keV) X-ray flux and the optical flux, as had been found for NGC 4151 by Lyuty (1978). Peterson et al. (2000) found that the optical and X-ray fluxes of NGC 4051 were also correlated on similar long timescales. Even for NGC 3516, there is a correlation of the X-ray and optical fluxes from year to year. Interestingly, for NGC 5548, Uttley et al. find that the long-term optical amplitude is slightly greater than the X-ray amplitude.
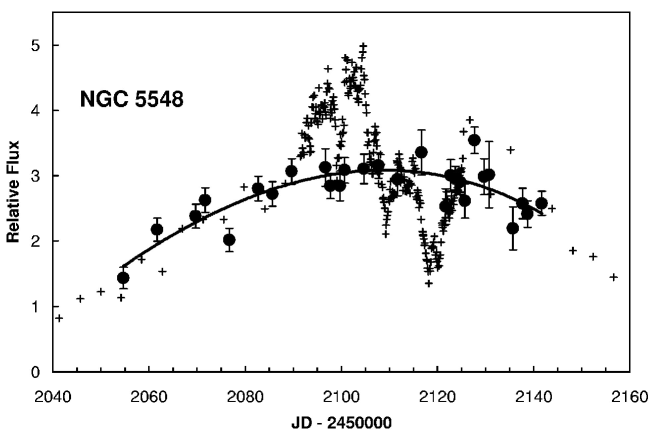
In July of 2001 we carried out intensive monitoring of NGC 5548 (Gaskell, Klimek et al. in preparation) in conjunction with intensive RXTE monitoring. Observational details are as in Klimek, Gaskell, & Hedrick (2004). In Fig. 1 we show the host-galaxy-subtracted Nebraska V-band photometry compared with the RXTE 2–10 keV fluxes. It can be seen that while the general trend of the optical variations (shown by the smooth curve) agrees with the long-term trend of the X-rays (and, interestingly, with no detectable lag), there are major short-term X-ray events (a “flare” and an “anti-flare”) that are completely absent in the optical light curve.
1.2. The NLS1 Ark 564
Ark 564 is our best-studied Narrow-Line Seyfert 1 (NLS1). Fig. 2 shows the results of our simultaneous ASCA, HST, and optical monitoring of the narrow-line Seyfert 1 galaxy Ark 564. The 1 keV ASCA data are a 0.3-day running average taken from the observations reported in Turner et al. (2001) and Edelson et al. (2002). The 1365 UV fluxes are from Collier et al. (2001), and the optical photometry from Shemmer et al. (2001). It can be seen that there are numerous X-ray events on sub-day timescales and some of the largest of these have lower-amplitude UV and optical events following them by days.
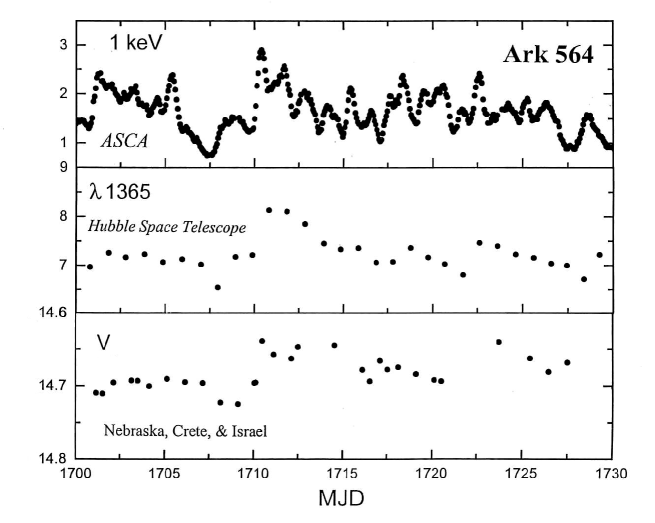
There are several interesting points to note. First, the UV and optical track each other well. Second, the UV and optical variability was of much lower amplitude than the X-ray variability. (After host galaxy correction, the optical and UV amplitudes are probably similar.) Third, as with NGC 5548, there were X-ray events with no optical counterparts (notably the short flare at JD 2451706).
1.3. The Broad-Line Radio Galaxy 3C 390.3
3C 390.3 is our best-studied radio galaxy. Radio galaxies lie at the opposite end of the eigenvector 1 from NLS1s. Fig. 3 shows the results of our simultaneous soft X-ray, UV, and optical monitoring. The ROSAT 0.1 – 2 keV fluxes are from Leighly et al. (1997), the IUE 1370 UV fluxes are based on O’Brien et al. (1998), and V-band fluxes have been derived with scalings and corrections from Dietrich et al. (1998). 3C 390.3 has a substantial (and as yet undetermined) host galaxy contribution. To emphasize the optical variations we have subtracted an arbitrary constant flux.
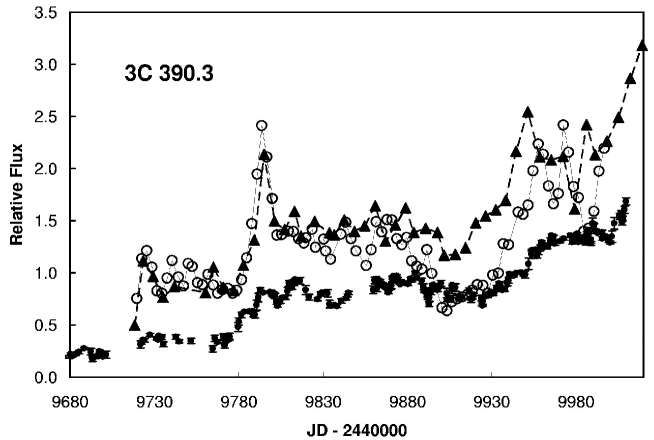
Fig. 3 shows a number of interesting things. The strong soft X-ray flare at JD 2449795 is followed only two days later by a 1370 UV flare that closely matches it in amplitude and duration, yet in the optical almost nothing happens! The same seems to be true for a smaller flare at JD 2449724. However, a pair of similarly strong soft X-ray flares at JDs 2449957 and 2449972 not only lack optical counterparts, but also lack UV counterparts.
The long-term variability (see Fig. 4) shows additional interesting things. Here we give 24-day average fluxes. There is now more qualitative agreement in the shapes and relative amplitudes of the light curves. The smoothed optical curves seems to be always lagging the UV by about three weeks. Before JD 2449830 the UV seems to be closely following the soft X-rays. However, from JD 2449900 onwards a remarkable thing is happening: the UV is clearly leading the soft X-rays by 1 week! The optical is also leading the X-rays (although probably lagging the UV). Looking at the shorter-term variability in Fig. 3, it can be seen that the increased activity that leads to the strong X-ray flare at JD 2449957 begins in the UV.
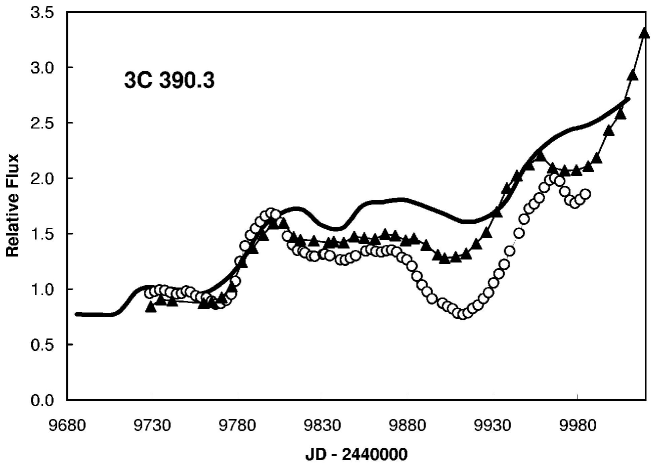
On the other hand, in subsequent monitoring of 3C 390.3 we find that our V-band flux appears to lag the RXTE 2–10 keV flux by days (see Fig. 4 of Gaskell & Klimek 2003), and the amplitude of the short-term optical variability exceeds the amplitude of the X-ray variability.
2. Things to be Explained
The picture that emerges from these three objects (and others) is a complicated one. The following general statements can be made:
(i) X-ray variability can be very rapid.
(ii) Optical variability can sometimes be rapid too.
(iii) For the very different AGNs NGC 4051, NGC 4151, NGC 5548, and 3C 390.3, the general level of activity in both the optical and X-ray regions is correlated on long timescales, and is probably of similar amplitude.
(iv) Short-term variations of the X-ray and optical fluxes can be correlated.
(v) Short-term variations in the X-ray and optical can also be uncorrelated.
(vi) When the optical and X-ray fluxes are correlated, the lag of the optical is small.
(vii) There is probably a preference for the EUV region to lead variability, but different signs of phase differences can be seen in the same object at different times.
3. An Anisotropic Emission Model
The frequent independence of the X-ray and optical variability on short timescales is puzzling given that sometimes the short-term variability does appear to be correlated. I want to conclude by suggesting a possible explanation of this. I believe that the rapid soft X-ray and EUV variability implies that the origin of the variability is electromagnetic, rather than arising primarily from gas dynamics. Electromagnetic phenomena propagate close to the speed of light, while gas-dynamical timescales (which tend to be of the order of the sound-crossing timescale) are much too long. It has already been suggested that the large amplitudes observed on short times in some cases could even require relativistic beaming (e.g., Boller et al. 1997; Reeves et al. 2002). An electromagnetic origin of variability is not unreasonable because, if one believes in energy equipartition, .
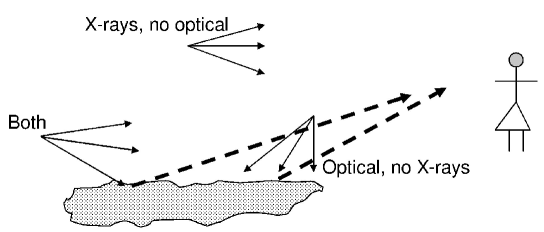
What I want to draw attention to is that electromagnetic variability is intrinsically anisotropic – we see this in the outer layers of the sun all the time. This is true even if we are not seeing relativistic beaming, because particles are accelerated anisotropically. The intrinsic anisotropy implies that (a) we will not always have the emission aimed towards us, and (b) the emitted electromagnetic radiation or high-energy particles will not always hit a reprocessing medium. These two considerations result in the three possibilities that are sketched in Fig. 5 and described in the caption. Note that the heating is not necessarily arising from anisotropic X-ray or EUV emission, but, as with solar flares, it could arise from high-energy particles hitting the reprocessing medium.
This model offers an explanation of why short-term X-ray and optical variability are only sometimes correlated. The small X-ray optical lags that are seen are on the light-travel time + heating/cooling timescale. Because optical emission is more isotropic we see more optical events, but the larger number, plus the smearing out of optical events, means that the optical amplitude will be smaller.
4. The Long-Term Relationship Between Optical and X-ray Variability
Although reprocessing of soft X-rays and EUV radiation into longer-wavelength emission fits in with the model just suggested to explain the varied short-term relationships between X-ray and optical variability, I think that reprocessing can be ruled out as the cause of long-term optical variability for at least three reasons: first, as shown above, UV and optical variability sometimes leads X-ray variability. Second, as noted by Uttley et al. (2003), in NGC 5548 the amplitude of optical variability exceeds that of the X-ray variability. A third reason is the lack of lag between the smoothed light curves. This means that the smoothing function extends to both positive and negative time, and hence that the activity in each wavelength region is correlated with the activity in the other wavelength region at a later time. To avoid violating causality the activity in the separate wavelength regions must both be driven by some independent slowly varying process. It has been shown elsewhere Gaskell (2004) that rapid variability depending on a slowly varying level of activity explains the proportionality of the variability to the mean flux level, explains the log-normal nature of X-ray variability, and produces light curves similar to those observed.
Acknowledgments.
This research is supported by the National Science Foundation through grant AST 03-07912.
References
- Boller et al. (1997) Boller, Th., Brandt, W. N., Fabian, A. C., & Fink, H. H., 1997 MNRAS. 289, 393
- Chiang et al. (2000) Chiang, J. et al. 2000, ApJ, 528, 292
- Collier et al. (2001) Collier, S. et al. 2001, ApJ, 561, 146
- Collin-Souffrin (1991) Collin-Souffrin, S. 1991, A&A, 249, 344
- Dietrich et al. (1998) Dietrich, M. et al. 1998, ApJS, 115, 185
- Dietrich et al. (2001) Dietrich, M. et al. 2001, ApJS, 371, 79
- Edelson et al. (2002) Edelson, R. et al. 2002, ApJ, 568, 610
- Gaskell (2004) Gaskell, C. M. 2004, ApJ, 612, L21
- Gaskell & Klimek (2003) Gaskell, C. M. & Klimek, E. S. 2003, Astron. & Astrophys. Trans., 22, 661
- Haba et al. (2003) Haba, Y. et al. 2003, ApJ, 599, 949
- Klimek, Gaskell, & Hedrick (2004) Klimek, E. S., Gaskell, C. M., Hedrick, C. H. 2004, ApJ, 609, 69
- Leighly et al. (1997) Leighly, K. M. et al. 1997, ApJ, 483, 767
- Lyuty (1978) Lyuty, V. M. 1978, Sov. Astron. Lett. 4, 267
- Maoz et al. (2002) Maoz, D., Markowitz, A., Edelson, R., & Nandra, K. 2002, AJ, 124, 1988
- O’Brien et al. (1998) O’Brien, P. T. et al. 1998, ApJ, 509, 1630
- Peterson et al. (2000) Peterson, B. M., et al. 2000, ApJ, 542, 161
- Reeves et al. (2002) Reeves, J. N. et al. 2002, MNRAS, 312, L17
- Shemmer et al. (2001) Shemmer, O., et al. 2001, ApJ, 561, 162
- Turner et al. (2001) Turner, T. J. et al. 2001, ApJ, 561, 131
- Uttley et al. (2003) Uttley, P., Edelson, R., McHardy, I. M., Peterson, B. M. & Markowitz, M. 2003, ApJ, 584, L53