The geometry of PSR B003107
Abstract
Here we present the results from an analysis of a multifrequency simultaneous observation of PSR B003107. We have constructed a geometrical model, based on an empirical relationship between height and frequency of emission, that reproduces many of the observed characteristics. The model suggests very low emission altitudes for this pulsar of only a few kilometers above the star’s surface.
1 Introduction
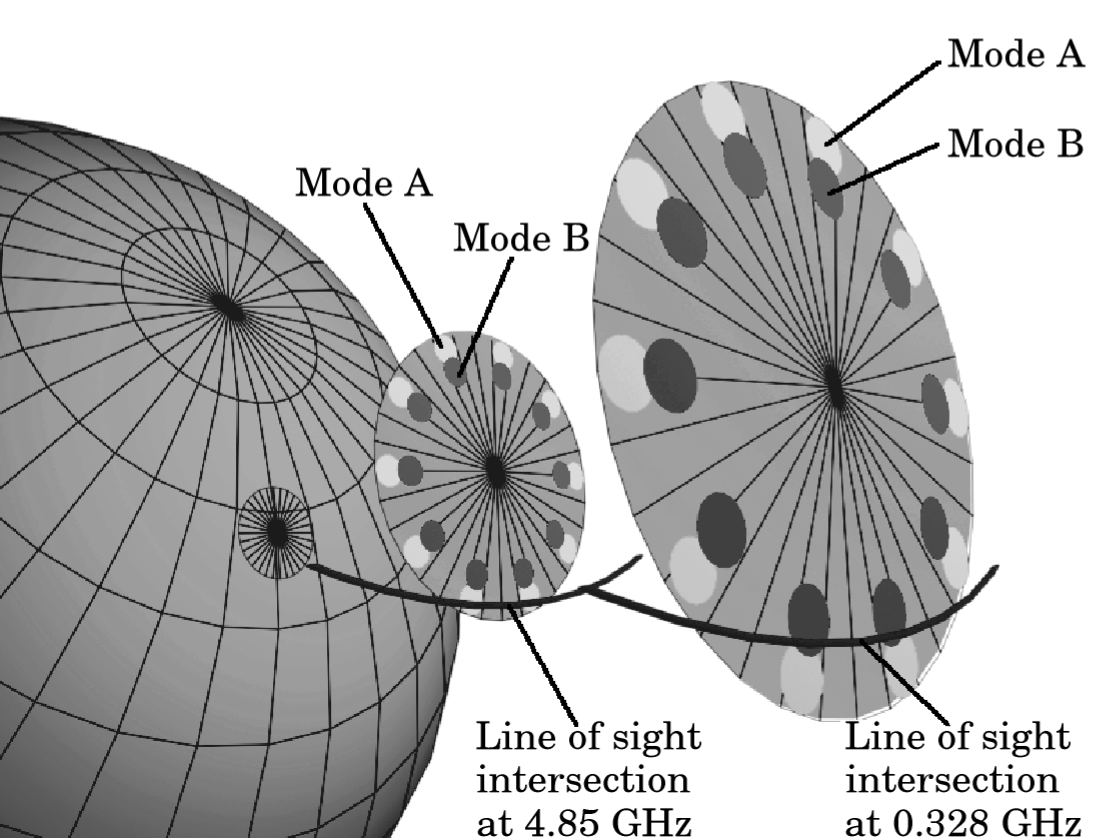
Pulsar B003107 is well known for its three modes of drifting sub-pulses. They are called mode A, B and C and are characterised by their values for of 12, 7 and 4 times the pulsar period, respectively (Huguenin et al. 1970). This pulsar has been thoroughly studied at low observing frequencies (Huguenin et al. 1970; Krishnamohan 1980; Wright 1981; Vivekanand 1995; Vivekanand & Joshi 1997, 1999; Joshi & Vivekanand 2000), but only rarely at an observing frequency above 1 GHz (Wright & Fowler 1981; Kuzmin et al. 1986; Izvekova et al. 1993). Recently, Smits et al. (2005) analysed simultaneous multifrequency observations from both the Westerbork Synthesis Radio Telescope and the Effelsberg Radio Telescope and detected all three drift modes at 325 MHz, but only detected drift mode A at 4.85 GHz. The pulses that were classified as mode B or C at low frequency only showed non-drifting emission at high frequency. On the basis of their findings, they suggested a geometrical model where modes A and B at a given frequency are emitted in two concentric rings around the magnetic axis with mode B being nested inside mode A. As shown in Fig. 1, this nested configuration is preserved across frequency with the higher frequency arising closer to the stellar surface compared to the lower one, consistent with the well known radius-to-frequency mapping operating in pulsars.
Here we analyse new multifrequency observations of PSR B003107, obtained with the Giant Metrewave Radio Telescope, the Westerbork Synthesis Radio Telescope and the Effelsberg Radio Telescope simultaneously. In total, the observations contain 136 000 pulses spread over 7 different frequencies. All the observations were aligned by correlating long sequences of pulses with pulses at an intermediate frequency that were obtained simultaneously. Neglecting retardation and aberration, the accuracy of this alignment is within 1 ms. From these observations we attempt to restrict the geometry of this pulsar and create a model that reproduces a great number of its observed characteristics.
2 Method
To describe the observational drift of sub-pulses we use three parameters, which are defined as follows: is the spacing, at the same pulse phase, between drift bands in units of pulsar periods (); this is the “vertical” spacing when the individual radio profiles obtained during one stellar rotation are plotted one above the other (stacked). is the interval between successive sub-pulses within the same pulse, given in degrees, and , the sub-pulse phase drift, is the fraction of pulse period over which a sub-pulse drifts, given in ∘/. Note that .
For both mode A and mode B, we calculated at each frequency the average polarisation profiles of the total intensity, the profiles of the non-drifting intensity, the values for and the fractional drift intensity, which is a measure for how the line of sight intersection is away from the center of the sub-beams. We then fitted the parameters of a simple geometrical model, assuming constant emission heights based on an empirical relationship between height and frequency of emission (Thorsett 1991) that reproduces the disappearing of mode B at high frequencies by slightly moving the location of the emission towards the magnetic axis.
3 Results
After optimizing the parameters of the model, it reproduces the observed position angle sweep and the frequency dependence of the width of the average intensity profile, the width of the average drift profile, and the fractional drift intensity for drift modes A and B.
|
|
|
|
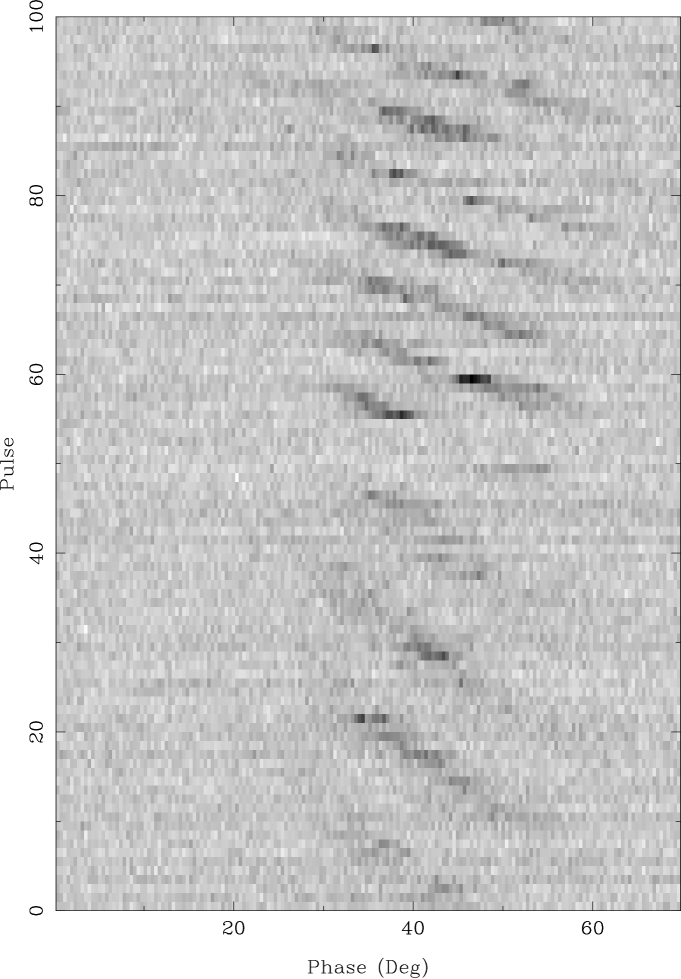
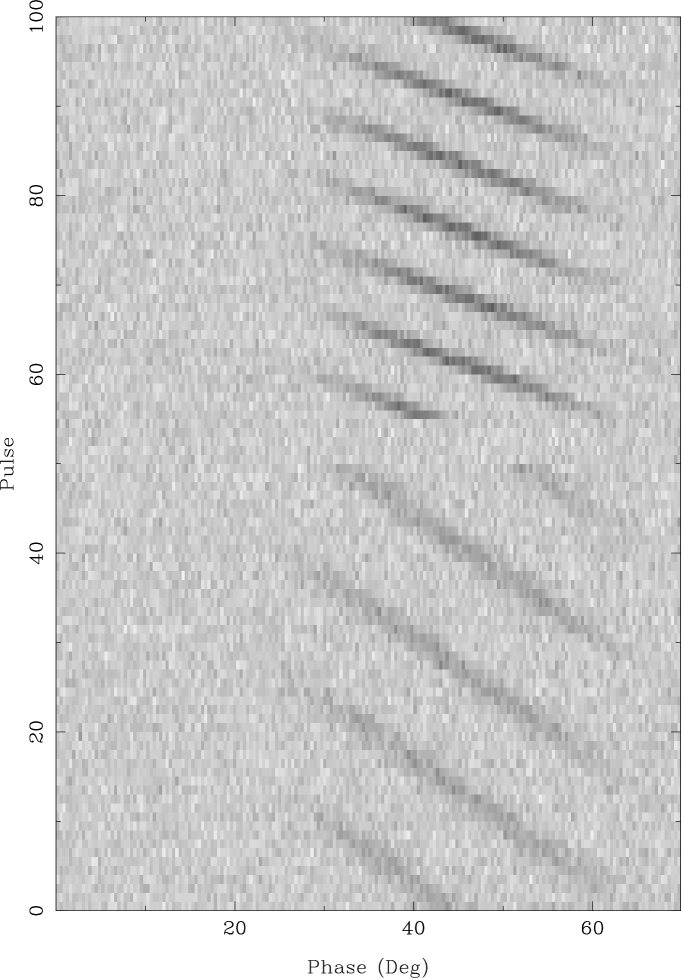
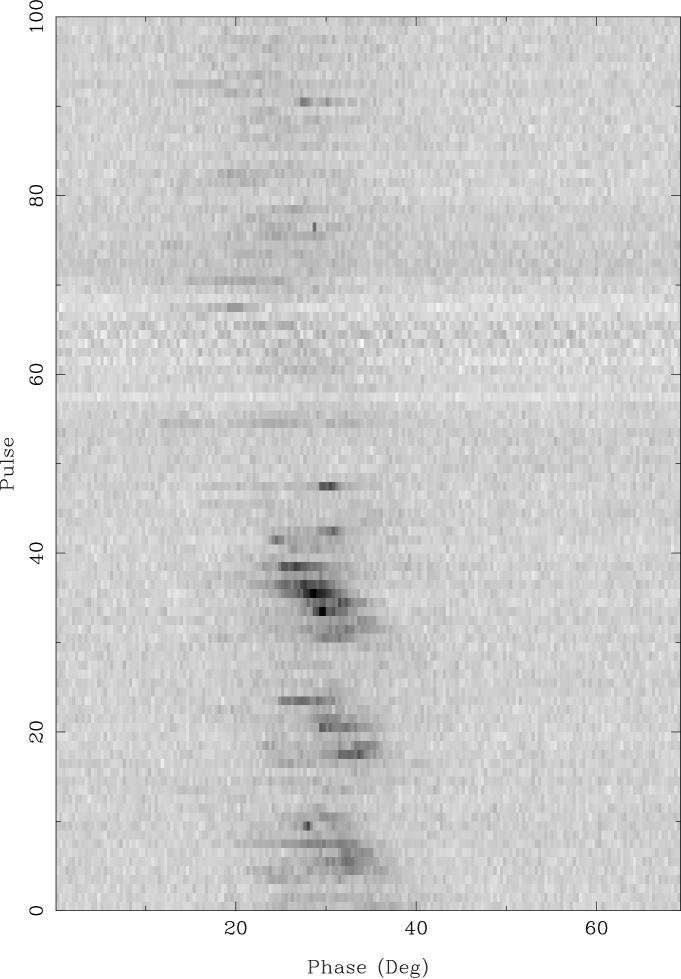
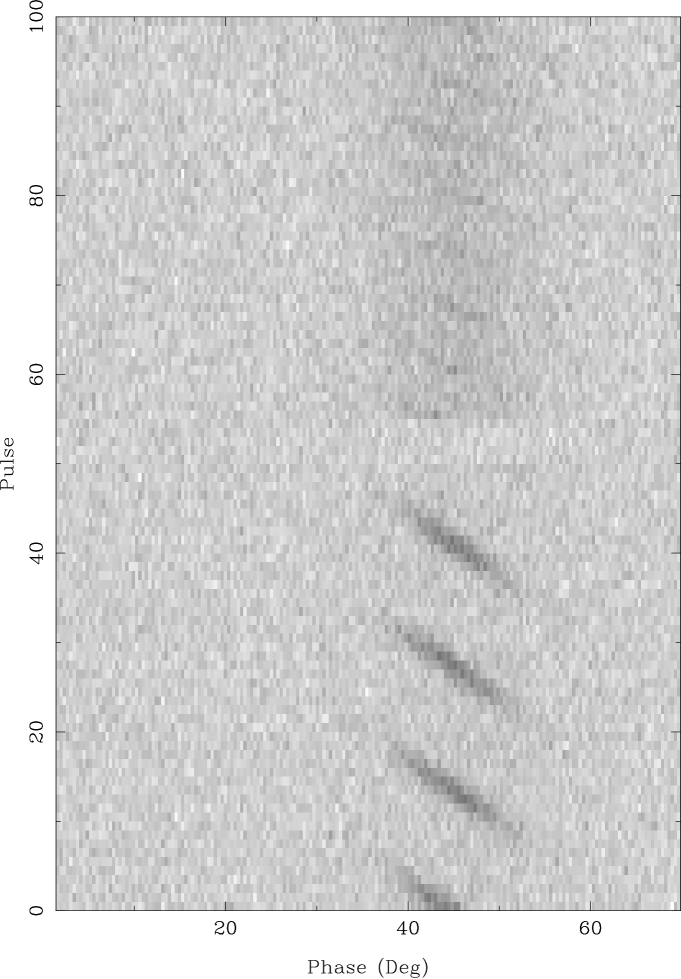
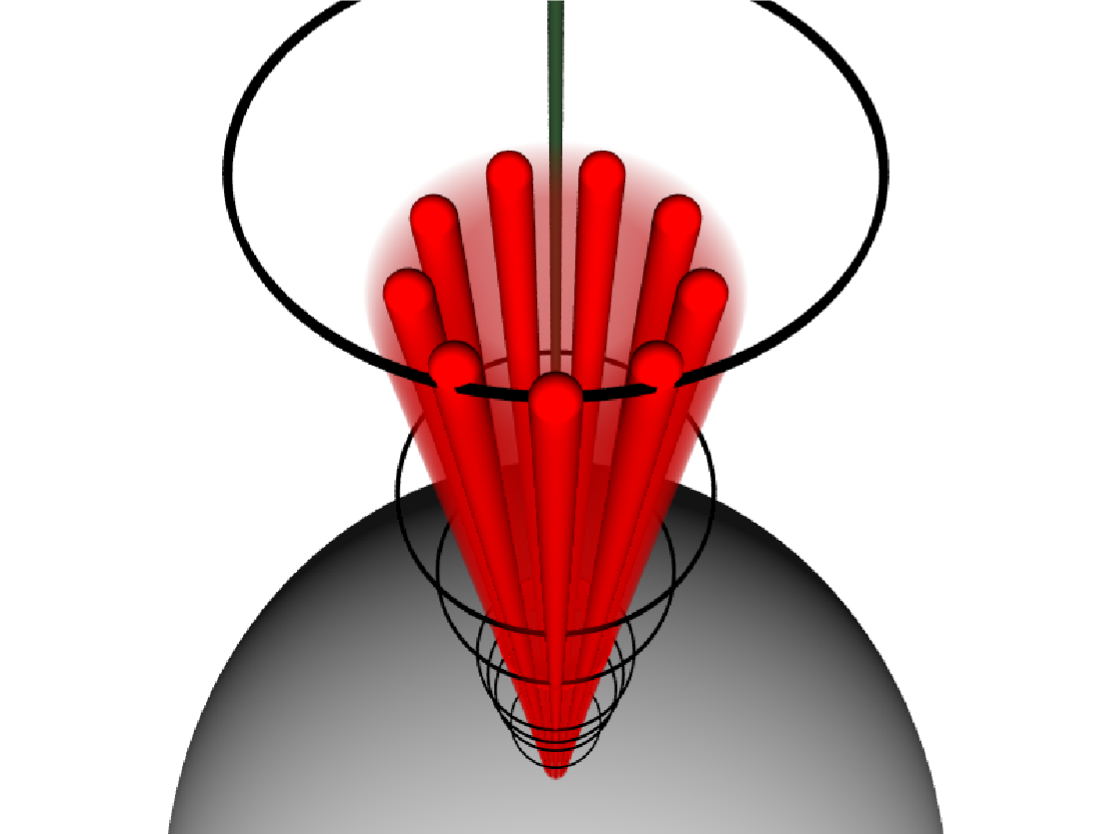
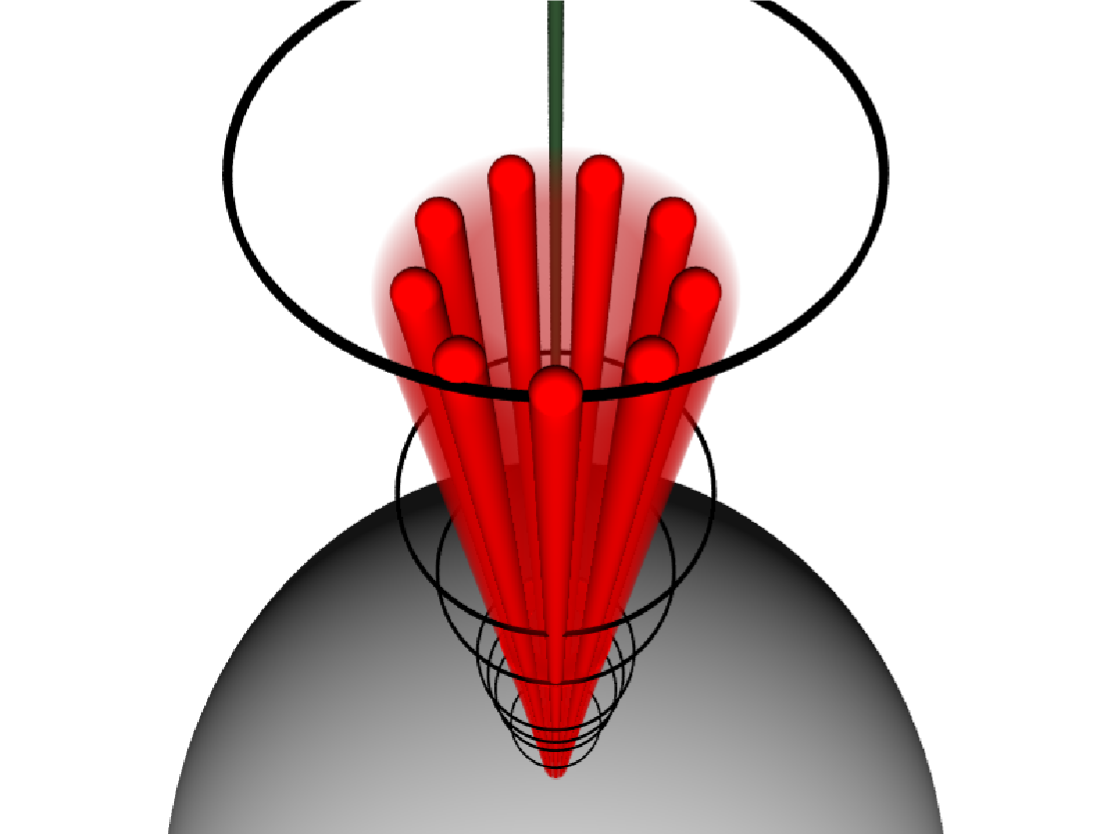
Fig. 2 shows the single pulses of the 243 MHz observations (top left), the 4 850 MHz observations (bottom left) with the corresponding single pulses from the model to the right. The first 50 pulses are in mode A and the last 50 pulses are in mode B. The model reproduces the disappearing of the mode B drift at high frequency by changing the position of the emission only slightly. The difference of the location of mode-A and mode-B emission is illustrated in Fig. 3. The top image shows the true location of the mode-A emission and the bottom image shows the true location of the mode-B emission.
4 Conclusions
We can summarize the features of the geometrical model of PSR B003107 that is presented here as follows.
-
•
The model reproduces the position angle sweep and the frequency dependences of the width of the average intensity profiles, the width of the average drift profiles, the fractional drift intensity and , for drift modes A and B of the single pulses of PSR B003107.
-
•
The emission heights are very low. The high frequency emission comes from a region a few kilometers above the surface of the star. The low frequency emission comes from a region about 10 kilometers higher than the high frequency emission.
-
•
The parameters and are approximately the same and depending on the actual emission height, around 2∘ to 4∘.
-
•
The emission is centered around, or close to the last open field lines.
-
•
The emission from drift mode B comes from a region just slightly closer to the magnetic axis than the emission from drift mode A.
-
•
Along with the drifting sub-pulses there is non-drifting emission in the single pulses that becomes more significant towards higher frequencies.
-
•
Assuming that the observed drift speeds of the sub-pulses are not aliased, the number of sub-beams is around 9.
The model results in very low emission altitudes, ranging from 2.3 to 13.6 km above the surface of the star. This is in strong contrast with other emission heights that have been measured for pulsars, which are typically some 10 to 1000 km. However, by assuming a realistic particle-density distribution near the polar cap, the emission heights can become higher.
Acknowledgements.
The authors would like to thank J. Rankin, G. Wright and G. Melikidze for their rich suggestions and discussions. We also thank A. Karastergiou for his help on data alignment. This paper is based on observations with the 100-m telescope of the MPIfR (Max-Planck-Institut für Radioastronomie) at Effelsberg, the Westerbork Synthesis Radio Telescope and the Giant Metrewave Radio Telescope and we would like to thank the technical staff and scientists who have been responsible for making these observations possible.References
- [Huguenin et al.(1970)Huguenin, Taylor, & Troland] Huguenin, G. R., Taylor, J. H., & Troland, T. H. 1970, ApJ, 162, 727
- [Izvekova et al.(1993)Izvekova, Kuzmin, Lyne, Shitov, & Smith] Izvekova, V. A., Kuzmin, A. D., Lyne, A. G., Shitov, Y. P., & Smith, F. G. 1993, MNRAS, 261, 865
- [Joshi & Vivekanand(2000)] Joshi, B. C. & Vivekanand, M. 2000, MNRAS, 316, 716
- [Krishnamohan(1980)] Krishnamohan, S. 1980, MNRAS, 191, 237
- [Kuzmin et al.(1986)Kuzmin, Malofeev, Izvekova, Sieber, & Wielebinski] Kuzmin, A. D., Malofeev, V. M., Izvekova, V. A., Sieber, W., & Wielebinski, R. 1986, A&A, 161, 183
- [Smits et al.(2005)Smits, Mitra, & Kuijpers] Smits, J. M., Mitra, D., & Kuijpers, J. 2005, A&A, 440, 683
- [Thorsett(1991)] Thorsett, S. E. 1991, ApJ, 377, 263
- [Vivekanand(1995)] Vivekanand, M. 1995, MNRAS, 274, 785
- [Vivekanand & Joshi(1997)] Vivekanand, M. & Joshi, B. C. 1997, ApJ, 477, 431
- [Vivekanand & Joshi(1999)] Vivekanand, M. & Joshi, B. C. 1999, ApJ, 515, 398
- [Wright(1981)] Wright, G. A. E. 1981, MNRAS, 196, 153
- [Wright & Fowler(1981)] Wright, G. A. E. & Fowler, L. A. 1981, in IAU Symp. 95: Pulsars: 13 Years of Research on Neutron Stars, 211