Oscillations and Waves in coronal loops1
Abstract
In the past few years observations by high-resolution space imaging telescopes and spectrometers have confirmed that a great variety of MHD waves are supported in the solar corona of a low-beta plasma and fine structure. MHD waves are an important diagnostic tool for the determination of the physical parameters of coronal loops, dubbed coronal seismology. In this paper, I will review recent results of both propagating and standing waves observed with SOHO and TRACE, and discuss the wave damping and excitation mechanisms as well as some applications of coronal seismology based on recent numerical simulations and theories in relation to the observations.
keywords:
solar flares; coronal oscillations; UV radiation, X-rays1 Introduction
Recent observations of oscillations and waves in coronal loops have inspired a great deal of interest in coronal seismology (see the reviews by Roberts 2000; Nakariakov 2004), which was proposed by B. Roberts more than 20 years ago (Roberts et al. 1984). The coronal seismology, as a diagnostic tool, opens the possibility for uncovering the physical properties of the coronal structure by studying how they influence the waves in excitation, propagation and dissipation. These properties include the temperature and density structure, the magnetic field structure, and the magnitudes of important transport coefficients. Constrains on dissipation coefficients and the strength of the coronal magnetic field may resolve some of the existing difficulties with wave heating and reconnection theories.
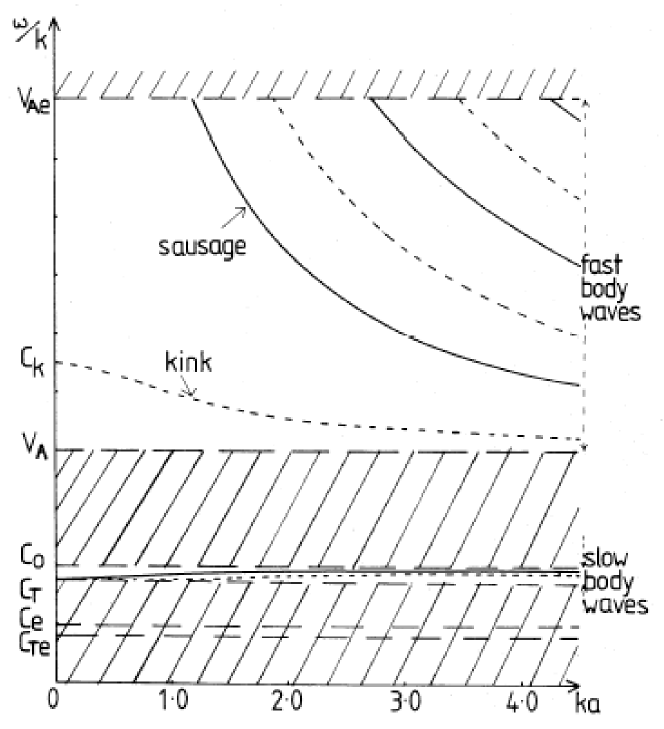
Edwin & Roberts (1983) predicted that various kinds of MHD waves and oscillations can be supported by coronal loops. They derived dispersion relation for the oscillations of a straight magnetic cylinder under coronal conditions. Figure 1 shows three kinds of free mode oscillations: slow modes, fast modes and torsional Alfvén modes. Slow modes have phase speeds close to the sound speed. Fast modes include two solutions, termed sausage modes and kink modes, with the oscillations symmetrical and asymmetrical about the axis of the loop, respectively. Note that the condition of the Alfvén speed inside the loop lower than that in its surroundings implies that a dense coronal loop is necessary to act as wave ducts trapping fast mode waves. Torsional Alfvén modes correspond to pure Alfven waves in the cylindrical case. Patterns of the different modes were sketched out by Wang (2004) (see Fig.1 in his paper), which can be used for mode identifications in observation. Slow sausage modes are dominated by longitudinal oscillations with magnetic pressure and thermal pressure perturbations coupling in anti-phase. While fast sausage modes are dominated by transverse oscillations in the radial direction with the two restoring forces in phase. Fast kink mode oscillations appear as the lateral displacements, with a small density perturbation approximating to be zero in the first order. Torsional Alfvén modes show periodic spinning motions about the axis with no density perturbation.
In observations these modes may be distinguished. For example, since the slow and fast sausage modes cause the density and magnetic field variations, they will modulate plasma emission (e.g., free-free emission, atomic line emission, or bremsstrahlung) and radio emissions (driven by a gyro-synchrotron mechanism or loss-cone instability). Zaqarashvili (2003) suggests that the global torsional Alfvén oscillation of coronal loops may be observed by the periodic variation of a spectral line width. These modes are also distinctly different in their periods. Aschwanden (2003) estimated for typical coronal loops (with lengths of 50500 Mm) that the slow modes have periods in a range from 7 to 70 minutes, the fast kink modes have periods from several minutes to 14 minutes, and the fast sausage modes have periods on the order of seconds.
For a straight flux tube the kink mode oscillations in any direction are identical, whereas for a line-tied coronal loop we may need to distinguish three kinds of global kink oscillations (see Fig. 2). The first, horizontal oscillation, shows swaying motions perpendicular to the loop plane. The second, vertical oscillation, is polarized in the loop plane, showing expanding and shrinking motions. For the third, distortion oscillation, the loop gets distorted in the loop plane while nearly remaining its length. The horizontal and vertical loop oscillations have been identified in observation. The distortion modes can be generated in 2D simulations.
In the previous studies, the existence of coronal oscillations had been inferred from time profiles of quasi-periodic patterns observed in almost all wavelengths, but the majority in radio wavelengths (see reviews by Aschwanden 1987; 2003). Recent imaging observations, especially from SOHO and TRACE in EUV wavelength with high spatial and temporal resolutions allow us to identify the oscillation modes unambiguously. For example, both the horizontal and vertical kink-mode loop oscillations have been observed by TRACE in EUV (e.g. Aschwanden et al. 1999; Nakariakov et al. 1999; Wang & Solanki 2004). The global standing slow-mode oscillations of hot coronal loops have been observed by SUMER on SOHO (e.g. Wang et al. 2002; 2003a). The quasi-periodic pulsations were found in radio wavelengths and ascribed to global sausage modes (Nakariakov et al. 2003). Not only the standing waves but also propagating waves have been found in coronal loops. The propagating slow magneto-acoustic waves in polar plumes (DeForest & Gurman 1998) and long fan-like coronal loops (e.g. Berghmans & Clette 1999; De Moortel et al. 2000) were detected by SOHO/EIT and TRACE in EUV. The fast sausage mode waves were found by SECIS in the coronal green line of Fe XIV (Williams et al. 2001; 2002), and the propagating fast kink waves in the post-flare supra-arcade by TRACE (Verwichte et al. 2005). For a detail, refer to the recent observational reviews given by Wang (2004); Aschwanden (2004)
In this paper, I will review the recent results from SOHO and TRACE and their interpretations.

2 Global fast kink-mode oscillations
2.1 Observations of Horizontal and Vertical Loop Oscillations
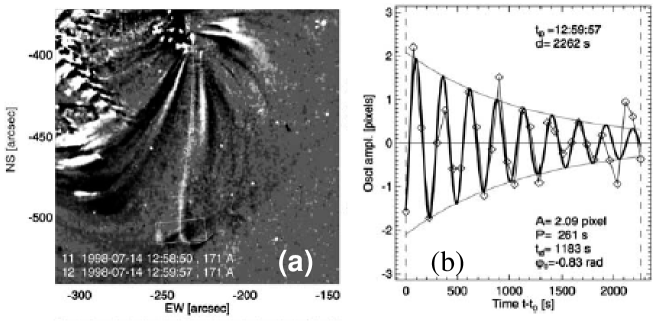
Using TRACE observations, Aschwanden et al. (1999) first discovered the horizontal oscillations of active region loops. After a strong M-class flare at 12:55 UT on 1998 July 14, a number of at least five loops in the flaring active region exhibited periodic horizontal displacements. Almost all loops initially moving away from the central flare site suggest that the oscillations could be excited by a blast shock wave, as also evidenced by a propagating disturbance with a speed of about 700 km s-1. Schrijver et al. (2002) suggested that the oscillations also could be excited by the ejected plasma in CMEs and filament eruptions directly impacting on the loop. Their ideas are supported by a statistic study by Hudson & Warmuth (2004) that 12 of 28 oscillation cases were associated with metric type II bursts and 24 of 28 cases associated with CMEs.
Aschwanden et al. (2002) measured geometric and physical parameters of transverse oscillations in 26 coronal loops, out of the 17 events described in Schrijver et al. (2002). Figure 3 demonstrates an example for measurements of the spatial displacements of an oscillating loop. The time profile shows that the oscillation is strongly damped. They obtained the displacement amplitude, period, and decay time by fitting with an exponentially damped sine function. They find that oscillation periods have a mean value of min, covering a range of min. The decay times have a mean of min, in a range of min, and there are 9 cases for which the decay time could not be evaluated. The transverse amplitudes are on average km, with the maximum of 8800 km. The maximum transverse velocities are km s-1, up to 230 km s-1. From the measured loop length with a mean value of Mm and the oscillation period, the phase speed for the fundamental mode, km s-1, slightly larger than the typical Alfven speed ( km s-1) in the corona, consistent with the interpretation in terms of the global fast kink mode oscillations.
Wang & Solanki (2004) recently found the first evidence for vertical loop oscillations. In order to identify the oscillation mode they simulated the horizontal and vertical oscillations in a synthetic loop with a geometry derived from the observation, and found that they display distinctly different signatures. The horizontal oscillation exhibits a cross-over between the black and white shading near the loop-top, whereas the vertical oscillation appears as a uniform displacement with a maximum contrast at that position. In observations (see Figs. 4b-d), the signature of white loop either inside or outside the black one is consistent with that of the vertical loop oscillation. Time series of a slice at the loop top reveals intensity variations of the loop (Fig. 4e), which can be explained by the loop length modulations during the oscillation, and also suggest that the vertical loop oscillation could be more compressible than the horizontal loop oscillation.
2.2 Excitation of Global Kink Mode Oscillations
However, the detected transverse loop oscillations in flares are relatively rare. A statistic study by Schrijver et al. (2002) showed that in only 17 events (about 6%) out of 255 flares inspected, the oscillations were excited. This implies that some special excitation conditions are required. A criterion for the excitement of oscillations suggested by Aschwanden et al. (2002) is the need of enough fast exciter velocity, as inferred from the fact that the majority of oscillation events (about 70%) are M- or X-class flares. They also suggested that loops with weaker magnetic fields have a higher likelihood to oscillate than loops with strong magnetic fields, because loops with lower magnetic fields are excited faster than they can restore the equilibrium, and thus overshoot and swing back. The other criterion suggested by Schrijver & Brown (2000); Schrijver et al. (2002) is the location of oscillatory loops near magnetic nullpoints or separators, because a little disturbance will be highly amplified at these places.
In theory, to understand the excitation and damping mechanisms of the observed fast kink-mode oscillations, 1D (Terradas et al. 2005), 2D (Selwa et al. 2005a; Murawski et al. 2005; Del Zanna et al. 2005), and 3D simulations (Miyagoshi et al. 2004) have been tested. However, since the equilibrium of a curved loop with enhanced density under a realistic condition (e.g. with the gravitational and temperature stratifications) is difficult to set up, these simulations are still far from reproducing the observations.
2.3 Damping Mechanism of Kink Mode Oscillation
Various kinds of damping mechanisms have been proposed to explain the rapid decay of transverse loop oscillations observed by TRACE, such as footpoint motions near separatrices (Schrijver & Brown 2000), footpoint wave leakage into the chromosphere (De Pontieu et al. 2001; Ofman 2002), Lateral wave leakage due to curvature of loops (Roberts 2000), phase mixing (Heyvaerts & Priest 1983; Nakariakov et al. 1999; Ofman & Aschwanden 2002), resonant absorption (Ruderman & Roberts 2002; Goossens et al. 2002; Aschwanden et al. 2003; Van Doorsselaere et al. 2004a), non-ideal MHD effects (e.g., viscous and Ohmic damping, optically-thin radiation, thermal conduction) (Roberts 2000). Observational tests based on physical parameters measured in 11 oscillation events indicate that the damping of fast kink-mode waves are most likely due to phase mixing or resonant absorption involved in the small-scale inhomogeneity.
If an observed loop consists of multiple unresolved loop threads, the oscillations are damped by phase mixing because different threads have different oscillation frequencies which lead to enhanced viscous and ohmic dissipations by the friction between adjacent threads. Assuming the inhomogeneity scale is proportional to the loop length or the loop width, Ofman & Aschwanden (2002) found that the scaling power of the damping time with the observed parameters of the loops agrees well with the power expected by phase mixing, and they obtained the anomalously high viscosity, about 89 orders of magnitude larger than the classical value.
Another mechanism, resonant absorption interprets the rapid damping of loop oscillations by a mode conversion process, i.e., global kink mode oscillations transfer energy into torsional Alfven modes of the inhomogeneous layers at the loop boundary. Since this mechanism is not directly involved in the wave dissipation, it does not need to invoke the enhanced viscosity. Observational test by Aschwanden et al. (2003) supports the resonant absorption as a possible damping mechanism, and a new diagnostic of the density contrast of coronal loops can be provided based on this theory.
Some recent work in theory and numerical simulation also explore the effects of loop curvature (Van Doorsselaere et al. 2004b; Brady & Arber 2005; Selwa et al. 2005a; Murawski et al. 2005) and gravitational stratification on the damping (Miyagoshi et al. 2004; Andries et al. 2005a; Del Zanna et al. 2005).
3 Global slow mode oscillations
3.1 Observations of Hot Loop Oscillations
Wang et al. (2002) found the first evidence for global slow-mode oscillations of hot coronal loops. The events were observed with the SUMER spectrometer with a slit located at the apex of a hot coronal loop which was visible in soft X-rays, but not seen by EIT 195Å. The spectra were recorded in a wide spectral window, including the lines with formation temperatures from 104K to 107K. Two recurring brightening events associated with Doppler shift oscillations were observed only in the flare line Fe XIX (6.3 MK). The Doppler shift oscillations are strongly damped. From the measured loop length and period, they estimated the phase speed for the fundamental mode to be 240380 km s-1. The values are close to the sound speed at 6 MK, thus suggesting an interpretation in terms of global slow-mode oscillations. Figure 5 demonstrates another example. Similarly, two recurring events of Doppler shift oscillations were observed in the Fe XIX line. The initiation of both events in association with a footpoint brightening suggests that the loop oscillations could be triggered by small or micro-flares (Wang et al. 2003b).
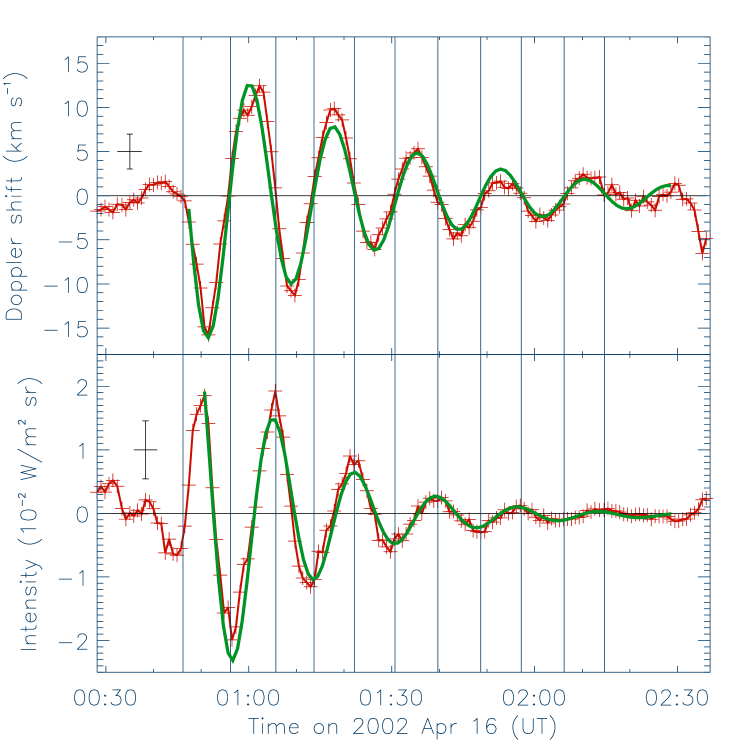
Compressive slow-mode waves are expected to be associated with intensity oscillations. Figure 6 shows one of the clearest examples. The Doppler shift and line intensity oscillations are found not only with the same period, but also having a phase shifted by exactly a 1/4-period, providing definitive evidence for a compressive standing wave in the loop (Wang et al. 2003a). This is in contrast with a propagating compressive wave, which shows velocity and intensity oscillations in phase.
Observations with a high cadence of 50 s made in April-May 2002 disclosed phase propagation along the slit in some Doppler shift oscillations. The measured propagating speeds cover a range of 8102 km s-1, with a mean of km s-1. Wang et al. (2003b) suggested that this feature may be due to the oscillation triggered in a loop with fine structure or in a loop system.
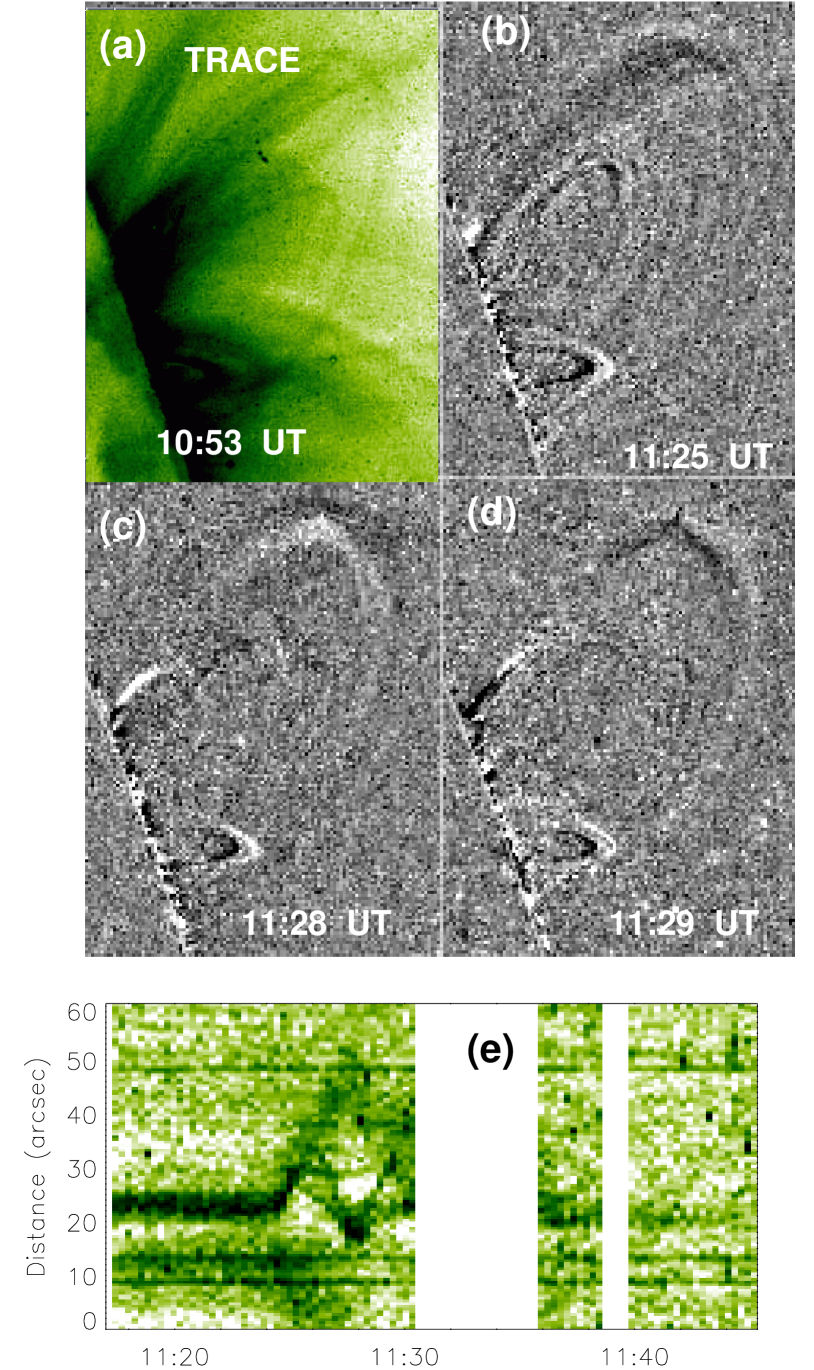
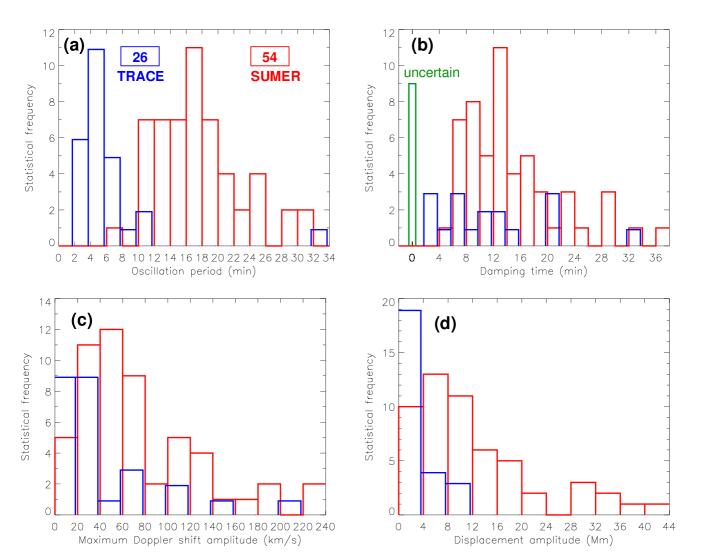
Figure 7 shows that the histograms of physical parameters measured for the 54 SUMER oscillations (Wang et al. 2003b) are compared with the result for 26 TRACE transverse loop oscillations (Aschwanden et al. 2002). The SUMER loop oscillations have periods in the range 731 min with a mean of 17.65.4 min, distinctly larger than those for the TRACE case. The decay times in the range 637 min with a mean of 14.67.0 min, have a ratio to the period close to 1, which is about a factor of 2 shorter than the TRACE case. The velocity amplitude is comparable. But the derived displacement amplitude is more than 5 times larger than that measured from the TRACE transverse oscillations. These comparisons also indicate that SUMER has detected a different oscillation mode from that found by TRACE.
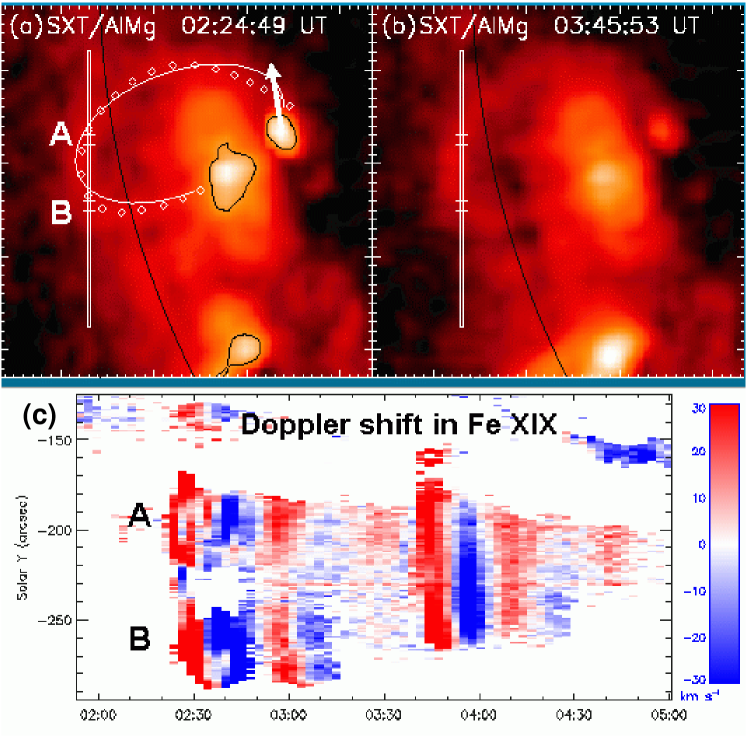
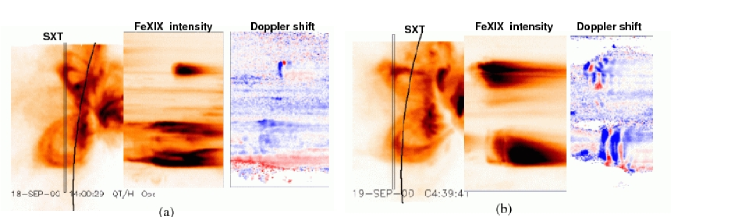
Figure 8 shows a comparison of two brightening events. In one case, the slit was located at the loop leg, and in the other case the slit at the loop apex. The Doppler shift oscillations are clearly seen at the loop top, but very weak in the loop legs. For almost all cases when the SXT observations are available, it is found that the evident Doppler shift oscillations occurred at the loop top (Wang et al. 2003b; Innes & Wang 2004). This fact also supports that the hot oscillations observed by SUMER are the fundamental mode.
3.2 Trigger and Excitation of Oscillations
For all 54 cases, the initially rapid increase of the line intensity and initial large Doppler broadenings indicate that the oscillations are excited impulsively. The initiation of some events was associated with the footpoint brightening of the oscillatory loop (see Figs. 5a-b), suggesting that the trigger could be small or micro-flares. Wang et al. (2005a) found that the spectral evolution often reveals the presence of two components in the initial phase of oscillations. This signature suggests that slow mode oscillations could be triggered by hot plasma injection or energy release near a footpoint in the loop. For 26 of 54 cases, they measured the highly shifted component of the Doppler shift on the order of 100300 km s-1.
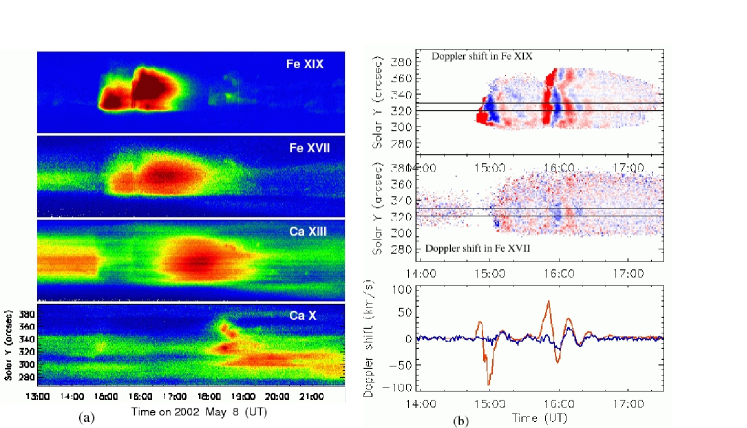
Figure 9a shows an example for the hot plasma cooling in an oscillating loop from the temperature of more than 6 MK to 1 MK, as clearly evidenced from time delays of brightening subsequently seen in the lines Fe XIX, Fe XVII, Ca XIII, and Ca X. The Ca XIII emission shows a dimming when the Fe XIX brightening starts, indicative of an impulsive heating of the loop plasma. Figure 9b shows the presence of Doppler shift oscillations simultaneously in the Fe XIX and Fe XVII lines. Note that the strong initial redshifts are seen in Fe XIX, but invisible in Fe XVII for both events, indicating that the initial redshifts are not caused by the motion of local plasma in the loop, but by a pulse of injected hot flow, which is possibly produced by the energy release at a footpoint. The distinct difference of amplitudes of Doppler shift oscillations in these two lines may indicate the oscillating plasmas initially at different temperatures. Later on, their amplitudes gradually reach unanimity suggesting the arrival of isothermal status.
In relation with simulations of the excitation of global slow mode standing waves in
hot loops observed by SUMER, the following properties should be emphasized
(Wang et al. 2005a):
1) Standing waves are set up quickly about a half period after the onset of the events.
2) These oscillations are the fundamental mode; no evidence for the second
harmonics are found yet.
3) Initial loop temperature is above 23 MK, then impulsively heated to a temperature
of 68 MK.
4) The duration of flarelike brightenings is several times the oscillation period.
5) Except for the strong initial injected hot flows lasting for about half a wave
period, no background flow is present during the event.
Based on 1D MHD simulations, some recent studies have explored the excitation of slow-mode standing waves in coronal loops. Nakariakov et al. (2004) and Tsiklauri et al. (2004) show that the second harmonics can be excited in high temperature (3040 MK) flare loops by impulsive energy deposit, independent of the location. Whereas Selwa et al. (2005b) show that the excitation of the fundamental mode or the second harmonics depends on the location of the trigger. A hot pulse launched at the loop apex excites the second harmonics, while a pulse at the loop leg or footpoint excites the fundamental modes. They also shows that the excitation time of the standing wave at least 3 periods. Taroyan et al. (2005) show that the fundamental mode can be set up immediately after the impulsive heat deposition at the footpoint of a loop if the duration of the pulse matches the wave period.
3.3 Damping Mechanism of Slow Mode Standing Waves
Different from the damping mechanisms of fast kink mode oscillations such as resonant absorption and shear viscosity, the damping of slow mode waves is mainly due to thermal conduction and compressive viscosity. For typical parameters of the hot loops observed by SUMER, one-dimensional, non-linear MHD simulations by Ofman & Wang (2002) show that the large thermal conduction due to high temperature of the loop can lead to the rapid damping of slow waves, and the expected scaling of the dissipation time with period agrees well with the observations. Based on a 1D loop model with gravity stratification, Mendoza et al. (2004) find that stratification results in further 1020% reduction of the wave-damping time. This effect is not important because the pressure scale height at 6-8 MK is very large (about 300400 Mm), compared to the height of typical coronal loops.
4 Propagating slow magnetoacoustic waves
4.1 Observations of Waves in Polar Plumes and Coronal Loops
Periodic density fluctuations (period 9 min) in coronal plumes were first detected high above the limb by Ofman et al. (1997; 1998; 2000b) using white light channel of the SOHO/UVCS. The ratio of the wave amplitude in intensity to the background value grows with height (Ofman et al. 1999). DeForest & Gurman (1998) detected quasi-periodic, propagating intensity disturbances in EIT/SOHO observations of polar plumes. The periods are about min, and the propagating speeds are about km s-1. Ofman et al. (1999; 2000a) found that these compressive disturbances could be modelled as slow magnetoacoustic waves.
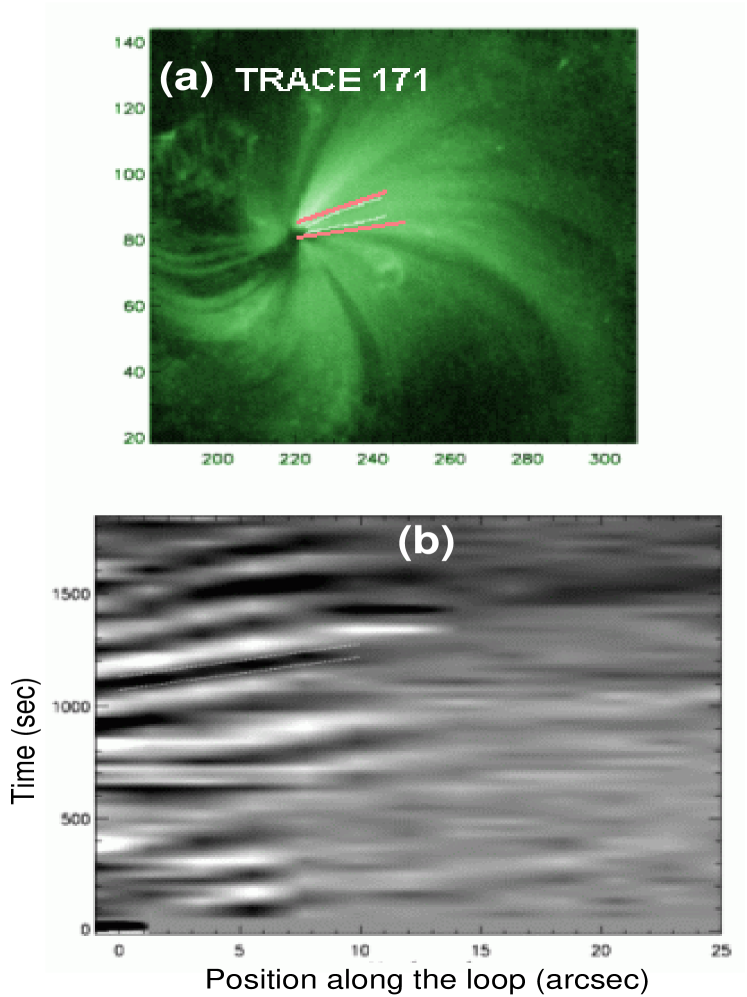
Berghmans & Clette (1999) first reported on the detection of similar propagating oscillations observed in coronal loops in SOHO/EIT 195 Å. The propagating speed is of the order of 150 km s-1. Intriguingly, these propagating disturbances are only detected in fan of straight loops, which are either widely open field lines or large scale loops connecting with the surrounding areas of the involved active region. De Moortel et al. (2000) confirmed this discovery with TRACE 171 Å. Figure 10 shows such a typical example. De Moortel et al. (2002a) found that loops that are situated above sunspot regions display quasi-periodic intensity disturbances with a period of the order of 3 min. whereas disturbances in “non-sunspot” loops with periods of the order of 5 min. These propagating disturbances in coronal loops have been interpreted in terms of slow magnetoacoustic waves based on the MHD modelings (Nakariakov et al. 2000; Tsiklauri & Nakariakov 2001).
Geometric and physical parameters of longitudinal oscillations were measured by De Moortel et al. (2002b; c) in 38 examples of large fan-like coronal loops observed with TRACE 171 Å bandpass. They found that the disturbances travel outward with a propagation speed of the order of 12243 km s-1and periods of the order of 28293 s. The amplitude of the intensity variations are roughly 4.11.5% of the background loop brightness. The length of the examined loop footpoints is found to be 26.49.7 Mm. The propagating disturbances are damped very quickly and are typically only detected in the first 8.94.4 Mm.
Robbrecht et al. (2001) found that the waves propagate in the same loop with different phase speeds measured at 171Å and 195 Å bands, implying the temperature structure in the loop. King et al. (2003) found that time series of propagating disturbances observed in the 171Å and 195 Å bands are highly correlated, but with a tendency to decrease with distance along the structure. Marsh et al. (2003) analysed propagating oscillations with TRACE 171 Å images and SOHO/CDS data in the He I, O V, and Mg IX lines, and found the presence of the waves in the different levels from the chromosphere to the corona.
4.2 Excitation of Longitudinal Oscillations
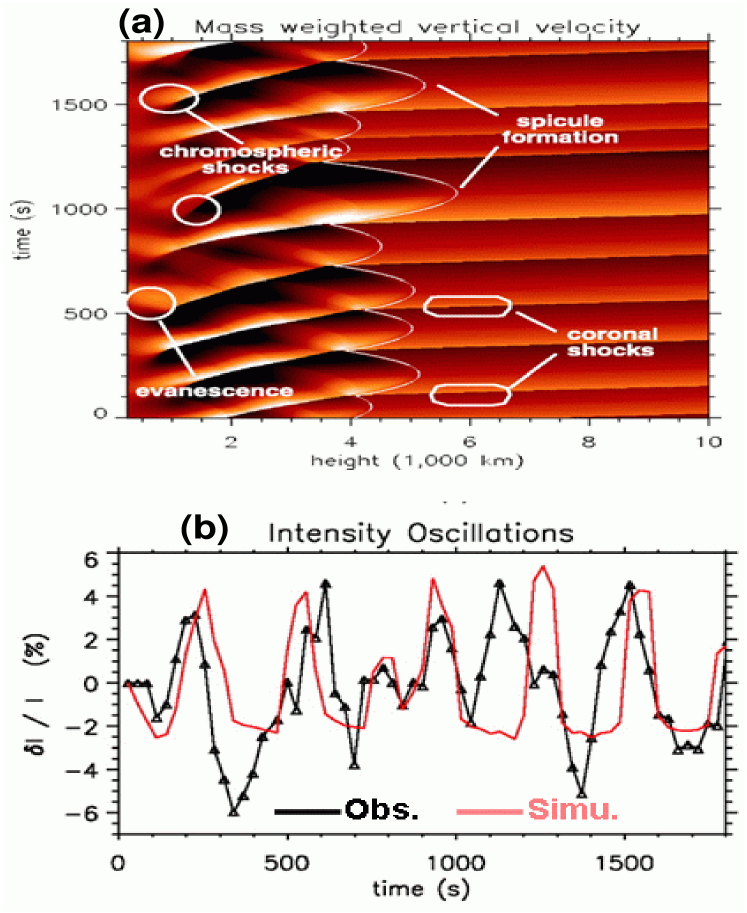
Since all these loops are quiescent and stable and the propagating disturbances can remain for several consecutive hours, they are not flare-driven but are most likely caused by an underlying driver exciting the loop footpoints (De Moortel et al. 2002a; b; c). Many observations have shown 3-min period oscillations in the chromosphere and transition regions above the sunspots, so in those loops situated above the sunspots, the leakage of 3-min oscillations is an explanation for the propagating slow waves in the coronal loops. It is well known that generally the 5-min p-mode oscillations cannot penetrate through the chromosphere due to the acoustic cutoff. However, some recent work by De Pontieu et al. (2004; 2005) show that if the magnetic field near the loop footpoint has a large inclination to the vertical, the increase of the acoustic cutoff period will allow the leakage of 5 min p-mode oscillations into the corona. Figure 11a shows the result from their 1D simulations. It can be seen that the photospheric oscillations develop into shocks which drive chromospheric spicules and reach the corona, forming propagating slow magnetoacoustic waves observed by TRACE. Figure 11b shows a good agreement between the observed intensity oscillation and the simulated one which is driven by photospheric velocity oscillations observed by MDI. However, since their model does not include thermal conduction and radiative loss, whether the damping scale of the coronal shocks in the loop consistent with the observation or not needs further verification.
4.3 Damping of Propagating Intensity Oscillations
By modelling the propagation and dissipation of slow magnetoacoustic waves in polar plumes, Ofman et al. (2000a) found that the nonlinear steepening of the waves leads to enhanced dissipation owing to compressive viscosity at the wave fronts and thus leads to damping of the waves within the first solar radii.
Nakariakov et al. (2000) modelled the propagation of slow waves in long coronal loops, and found that the main factors influencing the wave evolution are dissipation and stratification. Series of papers by De Moortel & Hood (2003; 2004); De Moortel et al. (2004) investigated various kind of effects which could contribute to the damping of slow waves, such as gravitational stratification, field line divergence, coupling of slow and fast modes, phase mixing of slow waves due to the horizontal density inhomogeneity, and showed that the thermal conduction is the dominant damping mechanism. Based on a more realistic model, Klimchuk et al. (2004) show that thermal conduction, pressure and temperature stratifications are the most important factors in the low corona to explain the observed damping of the intensity oscillations. They conclude that the enhanced compressive viscosity is not necessary.
5 Application of the MHD coronal seismology
Coronal seismology has been used for determining physical parameters of coronal loops in many studies. For example, based on rapid damping of the observed fast kink mode oscillations by phase mixing, Nakariakov et al. (1999); Ofman & Aschwanden (2002) derived the value of the viscosity at least 5 orders of magnitude higher than the classical coronal value. While the interpretation of the damping by resonant absorption provided a new diagnostic of the density contrast of oscillating loops from the number of oscillation periods (Aschwanden et al. 2003). Using the loop length and the period measured for the observed global fast kink mode oscillations, Nakariakov & Ofman (2001); Aschwanden et al. (2002) obtained the mean value of magnetic field strength in coronal loops. From a detection of multiple harmonic standing transverse oscillations by Verwichte et al. (2004), Andries et al. (2005b) obtained information about the density scale height in loops, based on the ratio of the period of the fundamental mode to the period of the second harmonic differing from 2 in loops with longitudinal density stratification. Here, I present two examples to show how the magnetic field strength can be determined from observations of the global fast kink mode and global slow mode oscillations of coronal loops.
5.1 Determination of the Magnetic Field Strength from Fast Kink Mode Oscillations
Based on the theory of MHD modes of a straight magnetic cylinder (Edwin & Roberts 1983; Roberts et al. 1984), the period for the fundamental mode of fast kink oscillations is
| (1) |
where is the loop length and is the kink speed which is given by
| (2) |
where is the Alfvén speed in the loop, and and are the density inside and outside the loop, respectively. From Eqs. (1) and (2), the value of the magnetic field in the loop can be estimated by
| (3) |
Using the physical parameters measured from the 14 July 1998 event (Nakariakov et al. 1999) and the 4 July 1999 event (Schrijver & Brown 2000), Nakariakov & Ofman (2001) estimated the magnetic field in the range from 4 to 30 G. Using the average values of , and the lower limit to (the loop density) measured for 26 loop oscillations, Aschwanden et al. (2002) obtained the following scaling,
| (4) |
Considering each of the parameters has a variation by a factor of about 0.5, they estimated the magnetic field values in a range of G, which is consistent with the result obtained by Nakariakov & Ofman (2001).
5.2 Determination of the Magnetic Field Strength from Slow Mode Oscillations
From observations of the standing slow mode oscillations, the magnetic field strength of coronal loops can also be estimated. In an example of the oscillating loop (the lower one shown in Fig. 8b), I measured the oscillation period min and loop length Mm. The period for the fundamental mode of standing slow mode oscillations is
| (5) |
where is the tube speed which is given by,
| (6) |
with the sound speed, given by
| (7) |
where is the Boltzman constant, is the mean molecular weight ( considering the He abundance in the corona) and is the temperature.
With Eq. (5), the tube speed is obtained, km s-1. In addition, the loop temperature and electron density can be measured from the Yohkoh/SXT data using the filter ratio method (Tsuneta et al. 1991). In this case, MK and cm-3. With these parameters, I obtain the sound speed, km s-1and Alfvén speed km s-1with Eq. (6). Finally I obtain the magnetic field strength by , which is about 27 G, consistent with the results obtained from the fast kink mode oscillations. A statistical study with more than ten cases are in preparation by Wang et al. (2005b).
6 Conclusions
The main results are summarized in the following,
1) TRACE has discovered transverse (horizontal and vertical) loop oscillations, which
are interpreted as global fast kink mode oscillations. The exciter could be the blast wave
originating from the flare.
2) SUMER has discovered global slow-mode standing waves in hot ( MK) coronal loops.
The trigger could be small flare-like events at a single footpoint.
3) EIT and TRACE have found propagating intensity oscillations in fan-like coronal
loops, which are interpreted as the propagating slow magneto-acoustic waves. The
exciter may be the leakage of p-mode oscillations.
4) The observed kink and slow mode standing oscillations can be used as a new
diagnostic tool for determining the mean magnetic field strength in coronal loops.
5) These oscillations are all strongly damped. The fast kink modes are most likely
damped by resonant absorption and phase mixing, and the slow modes oscillations and
waves are mainly damped by thermal conduction.
With the future missions like Solar-B and Solar Orbit, detections of high-frequency fast mode (kink and sausage) and torsional Alfvén waves and oscillations in coronal loops are expected, which are theoretically predicted to contribute to the heating of the corona.
References
- Andries et al. (2005a) Andries, J., Goossens, M., Hollweg, J. V., Arregui, I., & Van Doorsselaere, T. 2005a, A&A, 430, 1109
- Andries et al. (2005b) Andries, J., Arregui, I., & Goossens, M. 2005b, ApJ, 624, L57
- Aschwanden (1987) Aschwanden, M. J. 1987, Solar Phys., 111, 113
- Aschwanden et al. (1999) Aschwanden, M. J., Fletcher, L., Schrijver, C. J., & Alexander, D. 1999, ApJ, 520, 880
- Aschwanden et al. (2002) Aschwanden, M. J., De Pontieu, B., Schrijver, C. J., & Title, A. 2002, Solar Phys., 206, 99
- Aschwanden (2003) Aschwanden, M. J. 2003, NATO Advanced Workshop: Turbulence, Waves and Instabilities eds. R. Erdélyi et al., p.215
- Aschwanden et al. (2003) Aschwanden, M. J., Nightingale, R. W., Andries, J., et al. 2003, ApJ, 598, 1375
- Aschwanden (2004) Aschwanden, M. J. 2004, Physics of the Solar Corona - An Introduction, Chichester UK: Praxis Publishing Ltd, International Publishers in Science and Technology, and Berlin: Springer
- Berghmans & Clette (1999) Berghmans, D. & Clette, F. 1999, Solar Phys., 186, 207
- Brady & Arber (2005) Brady, C. S., & Arber, T. D. 2005, A&A, 438, 733
- DeForest & Gurman (1998) DeForest, C. E., & Gurman, J. B., 1998, ApJ, 501, L217
- Del Zanna et al. (2005) Del Zanna, L., Schaekens, E., Velli, M. 2005, A&A, 431, 1095
- De Moortel et al. (2000) De Moortel, I., Ireland, J., & Walsh, R. W. 2000, A&A, 355, L23
- De Moortel et al. (2002a) De Moortel, I., Ireland, J., Hood, A. W., & Walsh, R. W. 2002a, A&A, 387, L13
- De Moortel et al. (2002b) De Moortel, I., Ireland, J., Walsh, R. W., & Hood, A. W. 2002b, Solar Phys., 209, 61
- De Moortel et al. (2002c) De Moortel, I., Hood, A. W., Ireland, J., & Walsh, R. W. 2002c, Solar Phys., 209, 89
- De Moortel & Hood (2003) De Moortel, I., & Hood, A. W. 2003, A&A, 408, 755
- De Moortel & Hood (2004) De Moortel, I., & Hood, A. W. 2004, A&A, 415, 705
- De Moortel et al. (2004) De Moortel, I., Hood, A. W., Gerrard, C. L., & Brooks, S. J. 2004, A&A, 425, 741
- De Pontieu et al. (2001) De Pontieu, B, Martens, P. C. H., & Hudson, H. S. 2001, ApJ, 558, 859
- De Pontieu et al. (2004) De Pontieu, B., Erdélyi, R., James, S. J. 2004, Nature, 430, 536
- De Pontieu et al. (2005) De Pontieu, B., Erdélyi, R., De Moortel, I. 2005, ApJ, 624, L61
- Edwin & Roberts (1983) Edwin, P. M., & Roberts, B. 1983, Solar Phys., 88, 179
- Goossens et al. (2002) Goossens, M, Andries, J., & Aschwanden, M. J. 2002, A&A, 394, L39
- Heyvaerts & Priest (1983) Heyvaerts, J., & Priest, E. R. 1983, A&A, 117, 220
- Hudson & Warmuth (2004) Hudson, H. S., & Warmuth, A. 2004, ApJ, 614, L85
- Innes & Wang (2004) Innes, D. E., & Wang, T. J. 2004, In Proc. 15th SOHO Workshop: Coronal Heating eds. R. W. Walsh et al. (ESA SP-575, Noordwijk: ESA), p.553
- King et al. (2003) King, D. B., Nakariakov, V. M., Deluca, E. E., et al. 2003, A&A, 404, L1
- Klimchuk et al. (2004) Klimchuk, J. A., Tanner, S. E. M., De Moortel, I. 2004, ApJ, 616, 1232
- Marsh et al. (2003) Marsh, M. S., Walsh, R. W., De Moortel, I., Ireland, J. 2003, A&A, 404, L37 1999, ApJ, 519, L93
- Mendoza et al. (2004) Mendoza-Bricenño, C. A., Erdélyi, R., & Sigalotti, L. D. G. 2004, ApJ, 605, 493
- Miyagoshi et al. (2004) Miyagoshi, T., Yokoyama, T., & Shimojo, M. 2004, PASJ, 56, 207
- Murawski et al. (1998) Murawski, K., Aschwanden, M. J., Smith, J. M. 1998, Solar Phys., 179, 313
- Murawski et al. (2005) Murawski, K., Selwa, M., & Nocera, L. 2005, A&A, 437, 687
- Nakariakov et al. (1999) Nakariakov, V. M., Ofman, L., DeLuca, E. E. et al., 1999, Science, 285, 862
- Nakariakov et al. (2000) Nakariakov, V. M., Verwichte, E., Berghmans, D., & Robbrecht, E. 2000, A&A, 362, 1151
- Nakariakov & Ofman (2001) Nakariakov, V. M., & Ofman, L. 2001, A&A, 372, L53
- Nakariakov et al. (2003) Nakariakov, V. M., Melnikov, V. F., & Reznikova, V. E. 2003, A&A, 412, L7
- Nakariakov (2004) Nakariakov, V. M. 2004, in SOHO 13, Waves, Oscillations and Small-scale Transient Events in the Solar Atmosphere: A Joint View from SOHO and TRACE ed. H. Lacoste, ESA SP-547, p.407
- Nakariakov et al. (2004) Nakariakov, V. M., Tsiklauri, D., Kelly, A., Arber, T. D., & Aschwanden, M. J. 2004, A&A, 414, L25
- Ofman et al. (1997) Ofman, L., Romoli, M., Poletto, G., et al. 1997, ApJ, 491, L111
- Ofman et al. (1998) Ofman, L., Romoli, M., Poletto, G., et al. 1998, ApJ, 507, L189
- Ofman et al. (1999) Ofman, L., Nakariakov, V. M., & Deforest, C. E. 1999, ApJ, 514, 441
- Ofman et al. (2000a) Ofman, L., Nakariakov, V. M., & Sehgal, N. 2000a, ApJ, 533, 1071
- Ofman et al. (2000b) Ofman, L., Romoli, M., Poletto, G., et al. 2000b, ApJ, 529, 592
- Ofman (2002) Ofman, L. 2002, ApJ, 568, L135
- Ofman & Aschwanden (2002) Ofman, L., & Aschwanden, M. J. 2002, ApJ, 576, L153
- Ofman & Wang (2002) Ofman, L., & Wang, T. J. 2002, ApJ, 580, L85
- Robbrecht et al. (2001) Robbrecht, E., Verwichte, E., Hochedez, J. F., et al. 2001, A&A, 370, 591
- Roberts et al. (1984) Roberts, B., Edwin, P. M., & Benz, A. O. 1984, ApJ, 279, 857
- Roberts (2000) Roberts, B. 2000, Solar Phys., 193, 139
- Ruderman & Roberts (2002) Ruderman, M. S., & Roberts, B. 2002, ApJ, 577, 475
- Schrijver & Brown (2000) Schrijver, C. J., & Brown, D. S. 2000, ApJ, 537, L69
- Schrijver et al. (2002) Schrijver, C. J., Aschwanden, M. J., & Title, A. M. 2002, Solar Phys., 206, 69
- Selwa et al. (2005a) Selwa, M., Murawski, K., Solanki, S. K., Wang, T. J., Tóth, G. 2005a, A&A, 440, 385
- Selwa et al. (2005b) Selwa, M., Murawski, K., Solanki, S. K. 2005b A&A, 436, 701
- Taroyan et al. (2005) Taroyan, Y., Erdélyi, R., Doyle, J. G., & Bradshaw, S. J. 2005, A&A, 438, 713
- Terradas et al. (2005) Terradas, J., Oliver, R., & Ballester, J. L. 2005, ApJ, 618, L149
- Tsiklauri & Nakariakov (2001) Tsiklauri, D., & Nakariakov, V. M. 2001, A&A, 379, 1106
- Tsiklauri et al. (2004) Tsiklauri, D., Nakariakov, V. M., Arber, T. D., & Aschwanden, M. J. 2004, A&A, 422, 351
- Tsuneta et al. (1991) Tsuneta, S., Acton, L., Bruner, M., Lemen, J., Brown, W. et al. 1991, Solar Phys., 136, 37
- Van Doorsselaere et al. (2004a) Van Doorsselaere, T., Andries, J., Poedts, S., & Goossens, M. 2004a, ApJ, 606, 1223
- Van Doorsselaere et al. (2004b) Van Doorsselaere, T., Debosscher, A., Andries, J., & Poedts, S. 2004b, A&A, 424, 1065
- Verwichte et al. (2004) Verwichte, E., Nakariakov, V. M., Ofman, L., & Deluca, E. E. 2004, Sol. Phys., 223, 77
- Verwichte et al. (2005) Verwichte, E., Nakariakov, V. M., & Cooper, F. C. 2005, A&A, 430, L65
- Wang et al. (2002) Wang, T. J., Solanki, S. K., Curdt, W., Innes, D. E., & Dammasch, I. E. 2002, ApJ, 574, L101
- Wang et al. (2003a) Wang, T. J., Solanki, S. K., Innes, D. E., Curdt, W., & Marsch, E. 2003a, A&A, 402, L17
- Wang et al. (2003b) Wang, T. J., Solanki, S. K., Curdt, W., Innes, D. E., Dammasch, I. E., & Kliem, B. 2003b, A&A, 406, 1105
- Wang (2004) Wang, T. J. 2004, in SOHO 13, Waves, Oscillations and Small-scale Transient Events in the Solar Atmosphere: A Joint View from SOHO and TRACE ed. H. Lacoste, ESA SP-547, p.417
- Wang & Solanki (2004) Wang, T. J., & Solanki, S. K. 2004, A&A, 421, L33
- Wang et al. (2005a) Wang, T. J., Solanki, S. K., Innes, D. E., Curdt, W. 2005a, A&A, 435, 753
- Wang et al. (2005b) Wang, T. J., et al. 2005b, in preparation
- Williams et al. (2001) Williams, D. R., Phillips, K. J. H., Rudaway, P., et al. 2001, Mon. Not. R. Astron. Soc., 326, 428
- Williams et al. (2002) Williams, D. R., Mathioudakis, M., Gallagher, P. T., et al. 2002, Mon. Not. R. Astron. Soc., 336, 747
- Zaqarashvili (2003) Zaqarashvili, T. V. 2003, A&A, 399, L15