Sun-as-a-Star Spectrum Variations 1974-2006
Abstract
We have observed selected Fraunhofer lines, both integrated over the Full Disk and for a small circular region near the center of the solar disk, on 1215 days for the past 30 years. Full Disk results: Chromosphere: Ca II K 3933Å nicely tracks the 11 year magnetic cycle based on sunspot number with a peak amplitude in central intensity of 37%. The wavelength of the mid-line core absorption feature, called K3, referenced to nearby photospheric Fe, displays an activity cycle variation with an amplitude of 3 mÅ. The separation of the K2 red and blue emission features has increased during the 1976-2006 period of our program. Other chromospheric lines such as He I 10830Å, Ca II 8542Å, H , and the CN 3883Å bandhead track Ca II K intensity with lower relative amplitudes. Low photosphere: Temperature sensitive CI 5380Å appears constant in intensity to 0.2%. High photosphere: The cores of strong Fe I lines, Na D1 and D2, and the Mg I b lines, present a puzzling signal perhaps indicating a role for the 22 y Hale cycle. Solar minimum around 1985 was clearly seen, but the following minimum in 1996 was missing. This anomalous behavior, which is not seen in comparison atmospheric O2, requires further observations and theoretical inquiry. Center Disk results: Both Ca II K and C I 5380Å intensities are constant, indicating that the basal quiet atmosphere is unaffected by cycle magnetism within our observational error. A lower limit to the Ca II K central intensity atmosphere is 0.040. This possibly represents conditions as they were during the Maunder Minimum. Converted to the Mt Wilson S-index (H+K index) the Sun Center Disk is at the lower activity limit for solar-type stars. The Wavelength of Ca II K3 varies with the cycle by 6 mÅ, a factor of 2X over the full disk value. This may indicate the predominance of radial motions at Center Disk. This is not an effect of motions in plages since they are absent at Center Disk. This 11 y variation in the center of chromospheric lines could complicate the radial velocity detection of planets around solar-type stars. An appendix provides instructions for URL access to both the raw and reduced data.
1 Introduction
The prime instrument of the then new McMath Solar Telescope (first light in 1962; see (Pierce, 1964)) was a rapid scan double-pass spectrometer which proved capable of recording the central depths of lines to 0.02% (Brault et al., 1971). It occurred to us that, fed by integrated sunlight, the relative strength of a temperature sensitive Fraunhofer line could be used to monitor, from the ground level, photospheric temperature variations and thus the Sun’s radiative output. Bob Milkey calculated the contribution function for C I 5380.323Å and showed its origin to be within 25 km, or practically coincident, with the = 1.0 continuum. Temperature sensitivity was estimated at (Livingston et al., 1977). Unlike typical Fe lines, which strengthen toward the limb, C I 5380 weakens and finally disappears there, in support of Milkey’s modeling. With a suitable optical train of flat mirrors in place for a feed, a 3 month run on the carbon line yielded a variance of 0.85 K rms (or 0.06% in the solar constant).
One of us (ORW) pointed out that the UV component of solar irradiance is also important to the Earth and that chromospheric Ca II K intensity at 3932Å could serve as a UV surrogate of the magnetic Sun. An observational program involving Ca II H and K, together with nearby continuum windows, was devised. Regular C I 5380 and Ca II H and K observations began. Since 1974 we have averaged 3 observations per month and these continue up to the present.
The Ca II H and K observations were successful from the beginning. Similar observations also were begun at Sacramento Peak Observatory in 1976, and the two data sets may in principle be merged. We attribute the success of these programs to the large cycle modulation in the H and K lines. A number of papers have been published over the years ( see White et al. (1998) and references therein), and the Ca II H and K index (a 1Å integral of the central intensity over the K232 features at line core; a comparable parameter to that used by stellar observers (Hall & Lockwood, 1995)) is established as a reliable index of chromospheric activity. We also compute a 0.5Å Ca II K index by integrating the line profile between the K3V and K3R minima. This index isolates the chromospheric emission and shows a larger amplitude variability than the 1Å index. Two other Ca II K features, the wavelength of K3, and the spacing of the K2V and K2R components, are found to display interesting variations over the 11 yr cycle. Ca II K3 position varies in phase with the activity cycle. Also, over our observing time, the separation of the K2 emission peaks has steadily widened. Other chromospheric lines such as He I 10830Å, H, Ca II 8542Å, and the CN bandhead at 3883Å were added to the program and found to vary in strength like Ca II K.
The goal of inferring temperature change in the photosphere proved to be more challenging. In part this is because the expected line depth variations are on the order of 1% or less. One of us (LW) found that many lines were blended by weak water vapor lines and an empirical correction was devised for such blends based on near simultaneous measures of Earth water lines near He I 10830 (see Section 6). For early data before helium was observed we learned to use radiosonde observations obtained from the local weather station. In general, our observational methods proved not to be as completely free of instrumental effects as we initially thought. In the case of a photospheric line such as C I 5380Å, the variance in central depth can be as small as 0.05% on a given day. But day to day differences are much larger, and this is unlikely due to the Sun. One variable is spectrograph alignment. In a number of early papers we report on the Sun’s temperature variability (Livingston et al., 1977)(Livingston & Holweger, 1982)(Livingston & Steffen, 1988) and the reader should realize that these results are no longer valid. We discuss these problems in the next section. Within our capability to measure it using the C I 5380Å line the global (Full Disk) and basal (Center Disk) photospheric temperature is constant over the activity cycles 21, 22, and 23.
Some of our results, particularly with Ca II H and K, will be of interest to stellar astronomers. One of us (MSG) therefore highlights these facets in the stellar context.
We recognize that our participation in this research is ending. In this paper we aim to summarize what has been learned as objectively and succinctly as possible. This unique data-set can form the basis of many other interesting studies by members of the scientific community. In view of this, we provide an appendix of information on how the reader can access both the raw and reduced archives. This synoptic program of Ca II observations, as well as other key spectral diagnostics in the solar spectrum, is expected to be continued with the Integrated Solar Spectrometer on the SOLIS Instrument at Kitt Peak (Keller et al., 2003).
2 Observations and their deficiencies
We discuss first the spectrograph and then the Fourier Transform Spectrometer (FTS).
Fig. 1 shows representative spectra of the bands we have studied in detail for photospheric and chromospheric variability. These examples illustrate the quality of the measured spectra. The intensity measures given in this paper are relative to a continuum intensity when a flat continuum was observed. Since the 7.5 Å scans in the Ca II K line do not include a continuum, the intensity reference was taken at 3935.6 Å in the red wing of the K line. This reference was taken to be 0.1762 of the nearby continuum value at 3953 Å between the K and H lines (White & Livingston, 1981).
Note that in this paper we use the term ‘central depth’ to be the relative line core intensity difference below the local continuum in weak to moderate strength lines. The term ‘central intensity’ in well resolved strong lines like Ca II K is the minimum intensity in the line core above the zero level. Obviously, central intensity = 1 central depth. We present equivalent width variations in He I 10830Å and C I 5380Å as a measure of the total line strength. We also arrange all plots of line strength so that maximum activity signals are upwards (positive) for ease of interpretation (even if this means inverting the sign of the ordinate).
Full Disk, or integrated light, is achieved by replacing the telescope concave image forming mirror with a flat and allowing the spectrograph entrance slit to form a ‘pinhole’ image of the Sun on the grating. While this arrangement is imperfect it would be time invariant providing all other optical elements are fixed. This last condition was violated by a grating size change in 1992 and because of frequent collimation adjustments thereafter.
The photometry system has been described by Brault et al. (1971). This double-pass system involves rapid scanning of the grating with signal detection behind the exit slit using a photomultiplier or silicon diode. Double-pass means that spectrograph scattered light and electronic off-sets are fully compensated. Variance in the spectra can arise from several factors: photon noise, scintillation, spectrograph seeing, sky transparency (clouds), and grating size (or collimation) effects. Photon noise: is rendered negligible (0.02%) by averaging 30 scans and making 6 sets of runs for each ‘observation’. Scintillation noise: is a factor because the telescope effective aperture is only a few mm -the entrance slit size. Scintillation is also suppressed by the 30 scan, 6 sets of runs, routine. Spectrograph seeing: can be a problem especially in the winter when the top of the vertical spectrograph tank becomes colder than its bottom and internal convection sets in. We noticed that broad lines like H show much less noise under these conditions than sharp photospheric lines. Again this is a random noise which should average out.
Grating size and collimation error are more serious problems. The original grating (25 15 cm) was replaced by a larger one (42 32 cm) in 1992. The 15 cm width of the original meant that part of the solar limb fell outside the grating; whereas, the full image was sampled by the new grating. Because most Fraunhofer lines strengthen near the limb we were now observing a different star with the new grating, and a step change will take place in the temporal record of line intensities. One would expect the variance to be reduced with the new grating because the entire disk lies within the larger ruled area. In fact it went up. This could be due to the presence now of two gratings for different experiments, i.e. an IR and a Visible one. The need to recollimate with its unavoidable errors occurred because of almost daily grating changes. We emphasize that Ca II K displays only a small center-to-limb variation and so was less affected by the change to the larger grating in 1992. A general discussion of observational error is given in Livingston & Holweger (1982).
Operations at the FTS present different problems. Collimation is accurate enough and reproducible: a laser beam is sent through the FTS optics and out the entrance hole to pass through the entire telescope in autocollimation mode and then falls back onto this hole. The beam splitter, however, was rather non-uniform in reflectivity so that the sharply focused solar pinhole image, which rotates at a diurnal rate on the collimator due to the heliostat feed, thereby continually weights slightly different parts of the Sun.
Another noise source is scintillation. Telescope aperture is again small, only 5 mm, this being the size of the entrance hole to the FTS. The interferometric central fringe, which sets the DC level of the spectrum, is sampled for only a fraction of a second for each scan. We suspect this is the reason that different FTS records show significant differences in line depth on the same day. These differences can be much greater than would be expected from the apparent high S/N in the FTS spectra.
The FTS does have certain important advantages over the spectrograph. Lines can be selected for study, ex post facto, anywhere within the observed bandwidth of 5000-6300Å. The wavelength scale of FTS spectra is very accurate. And the FTS optical system has not changed appreciably over the observational time span 1980-2006. Unfortunately the aging FTS has not been available as often as we would like during the past few years.
3 Results for Chromospheric Lines
Fig. 2 compares sunspot number (World Data Center, Belgium) with total unsigned magnetic flux and with the spectral strength of He I 10830Å, both of the latter observed almost daily until recently with the Kitt Peak Vacuum Telescope. These KPVT observations are area scans which can be summed to yield the average magnetic field flux and He I equivalent width over the entire disk. Sunspot numbers are the daily values and, of course, this time series is uninterrupted. The total field and He I equivalent width records are smoothed with a 4 point running mean and contain unmarked time gaps because of clouds and equipment down time.
Fig. 3 compares the Vacuum Telescope record with our far less frequent McMath-Pierce spectrograph data for He I equivalent width and the Ca II K index. The latter two are shown without any running means and include all observations. Some detailed differences in the time series can be seen, but we have not attempted to study these. The main point here is that chromospheric lines respond to the solar activity cycle and its magnetic signature on the solar disk.
The Ca II H and K reduction program measures and archives a number of spectral features described by White and Livingston (1981). The wavelength of K3 is computed using a parabolic fit to Fe 3932.637Å as a reference. Fig. 4 shows a temporal record of the K3 wavelength, both Full Disk and Center Disk, after the application of a 40-point running mean. (Donnelly (1988) proposed the use of such a filter to reduce the effect of rotational modulation). The sense is a 3 mÅ blue shift at solar maximum full disk. One might suspect the effect is caused by the cycle plage modulation of the K2V feature. Plage modulation is ruled out by two further pieces of evidence. First, the amplitude of the wavelength shift increases to 6 mÅ at Center Disk where little or no plage occurs. This also suggests the motion is mainly radial at Center Disk. Second, in Fig. 5 we show single day observations of the K232 features at minimum and maximum epochs full disk. If K2V were the cause of the resulting wavelength shift, at maximum the shift would be to the red. Instead the shift is to the blue. This figure also suggests that it is the K3 component that is moving, and not K2V-K2R; the upper chromosphere as indicated by K3 is shifting and not the reference Fe line. Admittedly, the K2R feature seems to shift slightly at minimum in this data set; whereas, K2V does not. But these are single day, single record observations containing some noise.
Another Ca II anomaly is the wavelength separation of the K2V and K2R components, Fig. 6. Particularly at solar minimum, there seems to be a secular increase in this value. This is the presumed basis for the change of yet another parameter: the Wilson-Bappu effect (White & Livingston, 1981), also shown in Fig. 6. The W-B effect is defined as the log of the separation of the half intensity points between the K2 peak and the K1 minimum on both sides of the line. This measurement is intended to mimic the classical visual micrometer estimates from stellar spectra.
In Fig. 7 we see that the cycle minimum value for the Full Disk Ca II K index is 0.086, for Center Disk Ca II K index the mean is 0.073, and for Ca II K3 it is 0.055. See Fig. 1(b) for the definition of these parameters. These values at Center Disk are with the 2 arc-min spatial averaging lens in place. We can enquire what the value would be for a quiet region at higher resolution.
In Fig. 8 we show such an observation following a suggestion of N.R. Sheeley Jr. We scanned across a quiet region near solar minimum at a resolution of about 2 arc-sec. The minimum value for the Ca II K3 intensity is about 0.040. This intensity represents the lower limit of the quiet atmosphere at this epoch in the activity cycle. A similar result was reported by Skumanich et al. (1984) except they used the Ca II K index. On the same day and conditions the above was observed we also made a 2 arc-sec scan of C I 5380. We might expect granular modulation of this line but the spatial resolution was insufficient.
The behavior at Center Disk for Ca II K3 intensity is also given in Fig. 8. The Ca II K profile Center Disk is essentially the same as Full Disk at minimum phase (Fig.1). Initially, in 1975-1982, the observations were always taken at the geometric center of the disk. This does not mean that we are necessarily on the Sun’s equator since this position varies 7 degrees due to the inclination of the solar rotation axis to the plane of the ecliptic. Starting in 1983, and continuing up to the present, if any K2 emission indicating magnetic activity (plage or network) is present near disk center, the image was displaced to a nearby quiet area showing the weakest K2 emission. Once this procedure was adopted, the Ca II K Center Disk temporal record no longer showed any evidence of the 11 y cycle. Note also that the grating change in 1992 was imperceptible in Center Disk Ca II K. This is because the grating was always fully filled (unlike for the Full Disk data). The remaining short term variations in the Center Disk measurements may arise from the transient presence of ephemeral regions (Harvey-Angle, 1993). A comparison of the Center Disk Ca II K index with that for the Full Disk is encapsulated in Fig. 9 where the histograms are the distributions of the index for the Center Disk and Full Disk, respectively. The two distributions are clearly segregated with negligible overlap at the minimum values.
Finally, we computed the rms deviation in the annual means for the Full Disk Ca II K index. These results are seen in Fig. 10 where the solar cycle variation is readily apparent. We also note, however, that there appears to be a secular decline in the rms during the last three cycles. We speculate that this could indicate a long-term increase in the relative homogeneity of regions that are the principal contributors to the Full Disk K index.
We may comment that no cycle variation is seen in the strength of the very weak rare earth emission lines of Ce II 3967.043 and Nd II 3934.798 found in the wings of H and K, see Fig. 1 (Engvold & Halvorsen, 1973). Time series analysis shows the relative intensity of Ce II is (0.0050.0006)+0.00016y, and Nd II is (0.10.003)(6.8e-06)y, where y=year1900. These lines are only visible Full Disk and not at Center Disk.
Following the grating change in 1992 we ceased to measure the continuum near the H and K lines. Using the Houtgast (1970) high points by means of special scans at 3910, 3953, and 4020 Å, the purpose was to define the amount the Ca II K wings vary over the cycle. This quantity was reported in White & Livingston (1981). Because the color distribution from the new grating was quite different after the grating change, we chose to simplify the observing program and discontinue these continuum reference measurements.
In summary the peak-to-peak Full Disk cycle variations found in the K line are: 1 Å index = 25% (Fig. 7); 0.5 Å index = 35%; K3 intensity = 37% (Fig.8). In Figs. 11 and 12 we add the data for chromospheric He I 10830Å, Ca II 8542Å, H, and the CN bandhead at 3883Å. The CN bandhead represents the low chromosphere where magnetic features are more compact. Title’s (1966) collected spectroheliograms allows us to judge that Ca II K, Ca II 8542Å, and H display plage and faculae with comparable but decreasing contrast in that order. CN 3883, when the seeing is good, maps faculae particularly well (Bailey & Sheeley (1969), Sheeley (1969)). He I 10830Å spectroheliograms map the highest levels of the chromosphere (Giovanelli & Hall, 1977). Ca II 8542Å spectroheliograms map the lower levels of the chromosphere nearer the limb (Jones & Giovanelli, 1983).
3.1 Stellar Perspectives
In this section we discuss some aspects of our Sun-as-a-star results in the context of stellar observations. In particular, we examine the behavior of the variations we see in K2 peak separations in the solar spectrum from the perspective of stellar activity studies where this parameter is correlated with the degree of chromospheric heating that is present. In addition, we compare our Center Disk observations with the distribution of activity seen in samples of solar-type stars.
3.1.1 K2 Peak Separations
In the context of chromospheric physics, it is of interest to compare the behavior of the K2Violet vs K2Red peak separation in our temporal series of solar measurements (Fig. 6) with the predictions of the chromospheric scaling laws derived by Ayres (1979). These scaling laws relate chromospheric emission line profile characteristics, including the Wilson-Bappu width, to fundamental stellar properties and the degree of mechanical heating in the chromosphere of a star. Following eq. 15 in Ayres (1979); see also eq. 9 in Linsky et al. (1979), the scaling law corresponding to the K2 peak separation can be written as
log= constant+ log log (log + log + 5 log ) ,
| (1) |
where is the separation of the the K2V and K2R peaks, is the iron abundance, is the gravity, is the effective temperature, and is the chromospheric heating rate, each normalized to ‘quiet Sun’ values. The parameter is the chromospheric Doppler width in velocity units. The calcium abundance is assumed to scale proportionally with the iron abundance. The relative chromospheric heating rate, , is measured by the chromospheric emission in the Ca II H and K lines. We note that in the case of the Sun the normalized logarithmic terms for metallicity and surface gravity in parentheses in eq. (1) are all identically zero. We assume here that changes in effective temperature are negligible during the solar cycle. This assumption is corroborated by our own results given herein for temperature sensitive lines as well as the lack of any observed changes in the solar radius that could be associated with the observed cycle variations in the bolometric irradiance.
Since we are mainly interested in examining the variation of the solar K2 peak separations with the cyclic modulation of the chromospheric heating rate in the Sun-as-a-star, we write eq. (1) simply as
log = constant log ,
| (2) |
where is the total net radiative cooling (i.e., chromospheric emission) in the Ca II H and K lines corrected for the radiative equilibrium contribution; the Doppler velocity parameter along with unit conversions and the normalization factor for the chromospheric heating rate have been absorbed into the constant term. In order to estimate we convert our summed K Ca II K and H index values to total flux utilizing the scaling laws given in a stellar context by Hall & Lockwood (1995) and Hall (1996) as functions of color. For the Sun, we adopt () = +0.65 (VandenBerg & Bridges, 1984). In order to account for the non-chromospheric, photospheric contribution to the H and K lines, we apply the empirical correction given by Noyes et al. (1984), again as a function of color. The result is graphically displayed in Fig. 13 where we see a declining trend of the solar K2 peak separations with increasing chromospheric heating as represented by the increasing total chromospheric flux in the H and K lines of the Sun. The decreasing K2 separation with increasing chromospheric emission is in agreement with the trend predicted by the scaling laws derived by Ayres (1979). The regression line has a slope of -0.22 0.005, which is close to the value of -0.25 for the slope in eq. (2). We note, parenthetically, that adopting colors for the Sun-as-a-star ranging from as blue as 0.62 to as red as 0.67 does not change appreciably the above value for the slope of the best fit regression line.
Besides the dependences on photospheric constants (e.g., metallicity, gravity, and effective temperature), the scaling law for the K2 peak separation in eq. (1) depends on the chromospheric Doppler width in addition to the chromospheric heating rate. We therefore suggest that departures from eq. (2) above—and the cyclic variation of the Wilson-Bappu width (Fig. 6)—could be due to the cyclic modulation of the average chromospheric velocity field in the K2 peak formation region.
3.1.2 Center Disk Ca II K index Values and Activity in Solar-Type Stars
It is again of interest in a stellar context to compare our mean H and K index values for the Center Disk with that of solar-type stars, particularly stars that may be considered as Maunder-minimum candidates. Our mean Center Disk value could be indicative of the values to expect in especially quiescent stars or even in the Sun during prolonged episodes of relatively reduced activity, as appears to have occurred during the Maunder-minimum period.
In order to compare our results with stellar data in the literature, we convert our summed Center Disk H+K index values to the Mt. Wilson S index using the empirical relations given by Hall & Lockwood (1995) and Hall (1996). The S index is based on the summed relative strengths in approximately 1 Å bandpasses centered on the Ca II H and K line cores (Vaughan et al., 1978). We find the mean and rms for the S index corresponding to our center disk observations to be S = .133 0.006. This mean S index is at the lower limits of the distribution of chromospheric activity reported by Hall & Lockwood (2004) (their Figs. 2 and 3 in their sample of 57 Sun-like stars).
In addition, our estimated mean HK index of 150 7 mÅ for the solar Center Disk data is about 10% less than the seasonal mean values, as measured over several seasons of observation, for even the most quiet solar-type stars in the M67 Giampapa et al. (2006); their Fig. 3 in the solar-age and metallicity open cluster, M67, using an identically defined HK index. There is a little more overlap between the mean HK index for the solar Center Disk data and the M67 solar-type star data for individual seasons of observation. In any event, our mean center disk value in comparison with stellar observations appears to be representative of “immaculate photospheres” with little in the way of magnetic field-related nonradiative heating.
4 Results for Photospheric Lines
In our archives this lowest level in the atmosphere is represented by the lines: Fe I 5379.579, C I 5380.323, and Ti II 5381.026Å, see Fig. 1(a). C I 5380 is especially interesting because this 7.68 ev excitation line is formed deep in the photosphere close to the continuum in Livingston et al. (1991), p.1124. As previously noted, unlike other photospheric lines it weakens toward the limb and disappears there. In principle C I 5380 should be useful to determine temperature variations but the issue is complicated and the reader is referred to other papers on the subject (Livingston & Holweger, 1982), (Livingston & Steffen, 1988), (Penza et al., 2006).
In Fig. 14 we show the temporal record of the above lines near 5380Å corrected only for water blends. The initial period marked between (a) and (b) may be considered experimental where optical filters and slit widths were being selected. These data are not used. Epoch (b) to (c) is our most stable time series when no instrumental changes were made, and collimation was infrequent. These are the data studied by Gray & Livingston (1997a, b). The noise was sufficiently low that the annual variation of the apparent size of the solar disk projected on the smaller grating could be deduced from limb-effect variations. Point (c) in 1992 is where the larger grating was installed. This was followed by an interval of several years during which differing collimation procedures were tried. (The reader might wonder why it took such a long time to settle on such observational techniques. The answer is that any changes produced only small effects that were not evident until after several months of measurement). Finally, at point(d) such experimentation ceased and the system has remained unchanged to the present (e).
Note that the strength of both the Fe and Ti lines increased with the larger grating at point (c). This is because the depth of these lines increases near the limb. Limb regions were now better sampled by the new grating. Likewise, C weakened because this line is weaker near the limb. Why at point (d) the C intensity goes up, we do not know for certain. In fact all three lines show about the same increase. It could be that the intermediate slit width was made narrower as an experiment and this reduced grating scattered light (grating ghost and satellite structures). Another obvious result is the increase of variance. As we mentioned, this is the consequence of changing gratings between different observing runs, there being two gratings now. Alternating between IR and visible observations requires re-collimation and introduces slight changes in spectrograph performance.
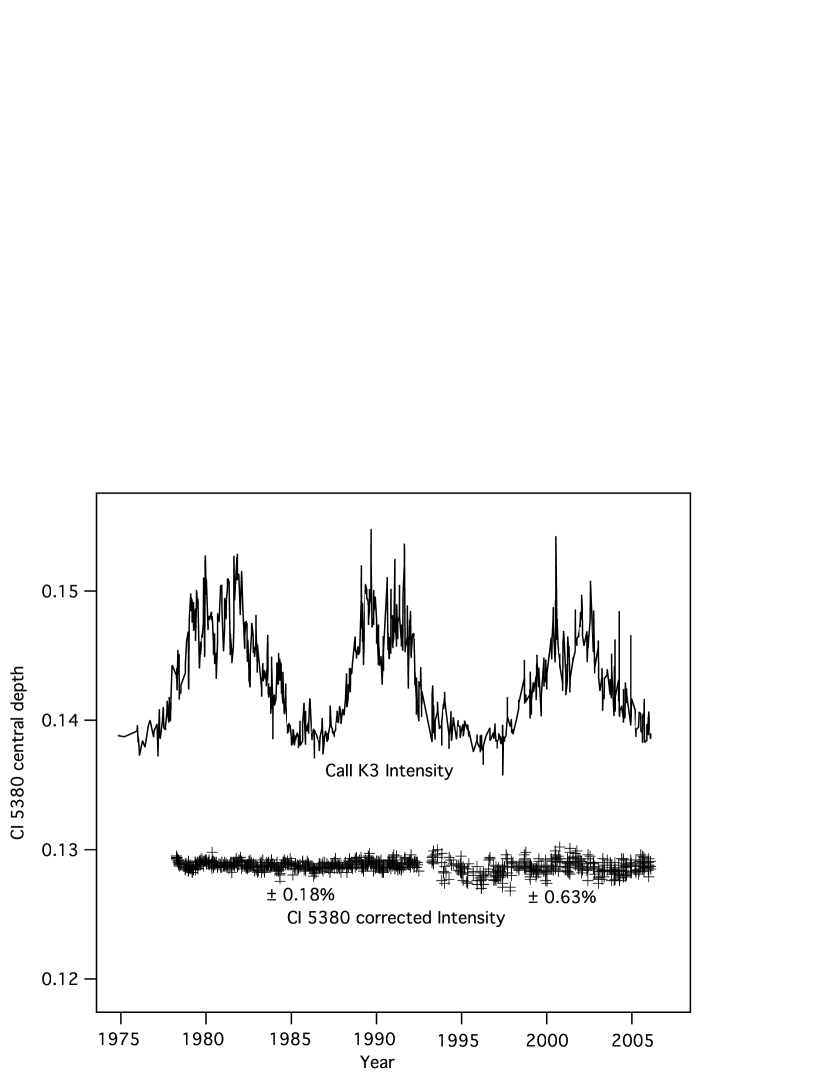
Another aspect seen in Fig. 14 is that many minor temporal artifacts are common to measurements in all three lines. By taking suitable line ratios we can eliminate most of these instrumental effects. The results are shown in Fig. 15. After this ‘correction’ and a shift of the (d) to (e) mean level, owing to the limb effect, the record is flat within 0.18% in the earlier epoch and 0.63% in the recent. No activity cycle modulation or secular change is evident.
An exception to the above constant behavior is photospheric Mn I 5394.672Å. This line is known to be sensitive to chromospheric conditions (Doyle et al., 2001; Malanushenko et al., 2004). Fig. 16 shows its temporal behavior and how it compares with Ca II K. The detailed explanation is controversial at present but may involve optical pumping from transition layer lines. Alternately, the explanation may lie, like Ca II H and K, in the surface distributions of faculae. In other words, the fine structure constant effect in this line makes it more sensitive to temperature (Danilovic et al., 2006).
5 Results for High Photosphere Lines
The upper photosphere is sensed by the cores of hundreds of medium to strong Fraunhofer lines. Mitchell compared FTS Full Disk spectra taken at the maximum of cycle 21 in 1980 with the following minimum in 1985 (Mitchell & Livingston, 1991). He deduced an average increase of 1.4% in central depth at minimum compared to maximum. Qualitatively this is what one would expect if the action of solar maximum hot faculae and plage is to slightly fill in line cores. Mitchell would have been surprised that his finding was not valid in the next cycle, but this is what we must now report.
Rather than study the hundreds of lines as Mitchell did, we turn our attention to selected unblended strong Fe I lines and the Na I D lines. Fig. 17 shows the FTS time history of these lines. Both Na I D and strong Fe I lines failed to respond to the minimum in 1996. Minimum cycle response in 1985 was 22% for Na and 6% for Fe, a significant amount. Fig. 18 indicates even more clearly the differences between what was observed and what was expected. It would be useful to have a standard line which did not vary as a reference check on FTS performance. The nearest we have to such a standard are the telluric oxygen lines near 6300Å. These lines, although much narrower than solar lines, and therefore questionable as standards, indicate that the FTS performance was constant to within 2%. We may note that Mn I 5394 does show a slight response in FTS records at solar minimum in 1996 (Fig. 16), but as explained in 4 this behavior is compromised by optical pumping or some other mechanism. In any case the 1996 rise for this line is much less than in 1986.
We also observed using the spectrograph a group of strong lines in the UV near 3131Å. See Figs. 1 (d) and 19. Their central depths are as follows: .90 for V II 3130.3; .76 Be II 3130.4; .90 Ti II 3130.8; .65 Be II 3131.1; .60 Fe II 3131.7; .90 Cr II 3132.1. Because there is no continuum available for this region (Houtgast, 1970), we normalized to the local high point in the spectrum. Line blanketing is strong, and no systematic cycle variability is seen in these lines despite their apparent depths. The lack of variability in the relative intensities for these lines shows that the central intensity and the reference intensity vary by the same amount. This emphasizes the importance of using reference intensities formed well above the formation level for the line and as close to the photospheric continuum as possible.
6 Determination of Precipitable Water above Kitt Peak
Many photospheric lines have water vapor blends. From the equivalent width of the telluric water line at 10832.2Å, Fig. 1(c), we find for each observing day the precipitable water above Kitt Peak (Wallace & Livingston, 1984). This archive is displayed in Fig. 20 where a strong seasonal variation is evident with up to nearly 4 cm of water in the summer monsoon and down to 0.7 mm on the driest winter day. All data in this paper have been corrected for water where necessary. There are no discrete telluric absorption lines shortward of 4000Å.
7 Discussion
We report here on 1215 single day observations of the Full Disk chromospheric Ca II K index from 1974-2006. Ca II K index tracked the 11 y activity cycle with peak-to-peak amplitude of about 25% (Fig. 7). Ca II K3 intensity had a larger peak-to-peak amplitude of 37%. Other chromospheric lines such as He I 10830, Ca II 8542, the CN band head at 3883Å, and H also followed the cycle but with reduced amplitudes (Fig. 11). Over the same time interval there were 243 Ca II K 2 arc-min resolution observations made at Center Disk. These were found not to be modulated by the cycle and constant within 1.4%. This residual variance is presumed traceable to short lived, possibly cycle independent, ephemeral regions (Harvey-Angle, 1993). Similar observations in the low photospheric lines at 5380Å display no cycle modulation. We reported on this before and explained how we suppose that cycle magnetism threads its way between granules and does not affect them, i.e. heat them (Livingston & Wallace, 2003; Livingston et al., 2005). High resolution (2 arc-sec) scans of the quiet Sun yield a minimum Ca II K3 intensity of 0.04. This value represents the basal quiet non-magnetic Ca II K atmosphere and could represent conditions during the Maunder Minimum. Converted to stellar S, the center disk Sun resides at a position of minimum activity as found for the most quiescent solar-type stars.
The wavelength of the K3 feature is observed to vary in phase with the sunspot cycle for both Full Disk and Center Disk measurements. While the phenomenon is confined to Ca II K in our archives, in other solar-type stars the process could extend to other chromospheric or even photospheric lines (e.g., see (Hall & Lockwood, 1998)), and might give rise to erroneous planetary detections.
The low photosphere is sensed by C I 5380Å, and nearby Fe and Ti, of which there are 1154 observations 1976-2006. Compared with the chromospheric lines, their intensity variations are small and subject to instrumental effects. Particularly important was a grating change in 1992. After this date the pinhole image of the Sun did not over-fill the new grating as was the case earlier. This change altered how the global center-to-limb variation influenced the Full Disk measurements after 1992. We discussed these and other instrumental aspects and show how, by taking line ratios, we can correct for minor collimation effects. After correction, we have allowed our two main observing epochs to be brought into agreement with simple additive shifts. Following these corrections and shifts we demonstrate that the low photosphere has been constant to within 0.18% in the early epoch and 0.63% in the later (Fig. 14). No cycle modulation is detected. We conclude that the basal photosphere is not affected (i.e. heated) by cycle magnetism.
The high photosphere is sensed by the cores of strong Fe lines and the D lines of Na I . These lines were observed from 1980-2006 with the FTS. This instrument and the telescope did not change optically (except for mirror and beam-splitter coatings) over this interval as indicated by O2 6303 (Fig. 18). Solar minimum in 1985 produced a significant signal (dip) in the central depths of these lines (6% in Fe I, 22% in Na I). But during the following minimum these dips were not detected. We have no physical explanation for this behavior. The time series looks like it might be following a 22 y cycle, but more observations will be needed to resolve this anomaly.
In summary, what have 30 y of spectral observations told us about the physical Sun? Recall that the day-to-day fluctuation over a 3 month run on temperature sensitive C I 5380Å yielded a fluctuation equivalent to 0.06% in the solar constant (Livingston et al., 1977). That behavior has basically continued over the entire observational period with no indication of cycle modulation or secular change. We conclude that the basal quiet photosphere is constant in temperature within our observational error as shown in Fig. 15. At the same time, and independently, chromospheric Ca II H & K observed Full Disk has traced out the magnetic activity cycle and this has been shown by others to be a surrogate for UV emission. At Center Disk Ca II H & K are constant, and so is the basal chromosphere. FTS observations suggest that the cores of high photosphere lines may vary with the 22 y Hale cycle. This has yet to be proven or understood. Perhaps another 20 y or so of observations will clarify this question.
Appendix A How to access and understand the data
Both the original raw data, i.e. spectrum scans, and the reduced data in terms of measured line parameters are available. The URL for this is as follows:
http://diglib.nso.edu/cycle_spectra.
Raw Data: All spectrum scans come in pairs of odd and even records in fits format. These correspond to the forward and backward grating motions and should be combined without adjustment for the best S/N (hysteresis is removed at the telescope). Record lengths are 512, 1024, 2048, or 4096 points. Most are one sample per point (nspp), but some are two (as for Ca I 8542). The grating change in 1992 resulted in dispersion changes, and in some cases a necessary change of record length. A Fortran program at the data site (rescnew) allows one to rescale the new data to that of the old (dispersion and record length). Records that have been through the rescnew program may not have values at all points. A few early observations will differ from the above rules. Note that the data has not been normalized and all intensities are in AD units. This means that cloud problems can be recognized by a diminished ABSMAX (absolute maximum) in the record header.
Reduced data: Observations have been reduced using a version of the program DECOMP. Normalization is to a 1, 2, or 3 point continuum of specified values. The record is filtered, adjusted as needed in wavelength, and selected lines are measured for central depth (or central intensity) and equivalent width across a specified window (usually 140 mÅ). The results are placed in dat2. files (e.g. dat2.5380). If corrections are made for water blends the dat2 files are converted to dat4 files. A typical file is in plain ASCII text: mm/dd/yy MST nn ri ewi ….., where MST is Mountain Standard Time (the local time at Kitt Peak), nn is the number of records averaged, ri is the line depth and ewi is the equivalent width measurements for the i-th species. If a water correction is needed the correction value is given in the column header.
Reduced Ca II H and K archives are contained in fd.log2 and cd.log2 files, where fd and cd refer to Full Disk and Center Disk. Information for reading these files is contained at the site.
References
- Ayres (1979) Ayres, T.R. 1979, ApJ, 228, 509
- Bailey & Sheeley (1969) Bailey, W.L. & Sheeley, N.R. Jr. 1969, Solar Phys., 7, 2
- Brault et al. (1971) Brault, J.W., Slaughter, C.D., Pierce, A.K., & Aikens, R.S. 1971, Solar Phys., 18, 366
- Danilovic et al. (2006) Danilovic, S., Solanki, S.K., Livingston, W., Krivova, N., & Vince, 2006, private correspondence
- Donnelly (1988) Donnelly, R.F. 1988, private correspondence
- Doyle et al. (2001) Doyle, J.G., Jevremovic, D., Short, C.I., Hauschildt, P.H., Livingston, W., & Vince, I. 2001, A&A, 369, L13
- Engvold & Halvorsen (1973) Engvold, O. & Halvorsen, H.D. 1973, Solar Phys., 28, 23
- Gray & Livingston (1997a) Gray, D.F. & Livingston, W. 1997, ApJ, 474, 798
- Gray & Livingston (1997b) Gray, D.F. & Livingston, W. 1997, ApJ, 474, 802
- Giampapa et al. (2006) Giampapa, M.S., Hall. J.C., Radick, R.R., & Baliunas, S.L. 2006, ApJ, 651, 444
- Giovanelli & Hall (1977) Giovanelli, R.G. & Hall, D. 1977, Solar Phys., 52, 211
- Hall (1996) Hall, J.C. 1996, PASP, 108 313
- Hall & Lockwood (1995) Hall, J.C. & Lockwood, G.W. 1995, ApJ, 438, 404
- Hall & Lockwood (1998) Hall, J.C. & Lockwood, G.W. 1998, ApJ, 493, 494
- Hall & Lockwood (2004) Hall. J.C. & Lockwood. G.W. 2004, ApJ, 614, 942
- Harvey-Angle (1993) Harvey-Angle, K.L. 1993, Magnetic Bipoles on the Sun, thesis, Univ. Utrecht
- Houtgast (1970) Houtgast, J. 1970, Solar Phys., 15, 273
- Jones & Giovanelli (1983) Jones, H.P. & Giovanelli, R.G. 1983, Solar Phys., 87, 37
- Keller et al. (2003) Keller, C.U., Harvey, J.W., & Giampapa, M.S. 2003, Innovative Telescopes and Instrumentation for Solar Astrophysics, Keil, S.L. ed., Proc. SPIE 4853
- Livingston et al. (1977) Livingston, W., Milkey, R., & Slaughter, C. 1977, ApJ, 211 281
- Linsky et al. (1979) Linsky, J.L., Worden, S.P., McClintock, W., & Robertson, R.M. 1979, ApJS, 41, 47
- Livingston & Holweger (1982) Livingston, W. & Holweger, H. 1982, ApJ, 252, 375
- Livingston & Steffen (1988) Livingston, W. & Steffen, M. 1988, Adv. Space Res., 8, no.7, 133
- Livingston et al. (1991) Livingston, W., Donnelly. R.F., Grigoryev, V., Demidov, M.L., Lean, J., Steffen, M., White, O.R., Willson, R.L. 1991, p. 1124 in Solar Interior and Atmosphere, Univ. Arizona Press, Tucson
- Livingston & Wallace (2003) Livingston, W. & Wallace, L. 2003, Solar Phys., 212, 227
- Livingston et al. (2005) Livingston, W., Gray, D., Wallace, L., & White, O.R. 2005, Large-Scale Structures and their Role in Solar Activity, ASP Conf Series 346, San Francisco
- Malanushenko et al. (2004) Malanushenko, O., Jones, H., & Livingston, W. 2004, IAU Symp 223, Stepanov, Benevolenskaya, & Kosovichev
- Mitchell & Livingston (1991) Mitchell, W.E. Jr. & Livingston, W. 1991, ApJ, 372, 336
- Noyes et al. (1984) Noyes, R.W., Hartmann, L.W., Baliunas, S.L., Duncan, D.K., & Vaughan, A.H. 1984, ApJ, 279, 763
- Penza et al. (2006) Penza, V., Pietropaolo, E. & Livingston, W. 2006, A&A, 454, 349
- Pierce (1964) Pierce, A. K. 1964, Appl. Opt., 3, 1337
- Sheeley (1969) Sheeley, N.R., Jr. 1969, Solar Phys., 9, 347
- Skumanich et al. (1984) Skumanich, A., Lean, J.L., White, O.R., & Livingston, W. 1984, ApJ, 282, 776
- Title (1966) Title, A. 1966, Selected Spectroheliograms, Calif Inst. Tech, Pasadena
- VandenBerg & Bridges (1984) VandenBerg, D.A. & Bridges, T.J. 1984, ApJ, 278, 679
- Vaughan et al. (1978) Vaughan, A.H., Preston, G.W., & Wilson, O.C. 1978, PASP, 90, 267
- Wallace & Livingston (1984) Wallace, L. & Livingston, W. 1984, PASP, 96, 182
- White & Livingston (1981) White, O.R. & Livingston, W. 1981, ApJ, 249, 798
- White et al. (1998) White, O.R., Livingston, W.C., Keil, S.L. & Henry,T.W. 1998, Synoptic Solar Physics, ASP Conference Series Vol. 140, eds. K.S. Balasubramaniam, Jack Harvey, & D. Rabin, p.293