The 15 – 20 Micron Spitzer Spectra of Interstellar Emission Features in NGC 7023
Abstract
We present 15 – 20 m long-slit spectra, from the Infrared Spectrograph (IRS) on Spitzer, of NGC 7023. We observe recently-discovered interstellar emission features, at 15.9, 16.4, 17.0, 17.4, 17.8, and 18.9 m, throughout the reflection nebula. The 16.4 m emission feature peaks near the photodissociation front northwest of the star, as do the aromatic emission features (AEFs) at 3.3, 6.2 and 11.3 m. The 16.4 m emission feature is thus likely related to the AEFs and radiates by non-equilibrium emission. The new 18.9 m emission feature, by contrast, decreases monotonically with stellar distance. We consider candidate species for the 18.9 m feature, including polycyclic aromatic hydrocarbons, fullerenes, and diamonds. We describe future laboratory and observational research needed to identify the 18.9 m feature carrier.
1 Introduction
The spectrum of aromatic emission features (AEFs) between 3.3 and 12.7 m has been previously well characterized by ground-based, airborne, and space-based spectroscopy. The 15 – 20 m region of AEF sources, however, has been far less examined. Beintema et al. (1996) obtained 2.4 – 45 m Infrared Space Observatory (ISO) spectra of three bright AEF sources, using the Short Wavelength Spectrograph (SWS). They found new emission features in the 15 – 20 m region at 17.0 (broad) and 17.9 m. Moutou et al. (2000), Van Kerckhoven et al. (2000), and Sturm et al. (2000) discovered a new emission feature at 16.4 m in a variety of sources, with ISO-SWS spectra. The 16.4 m feature was identified with C–C–C skeletal vibrational modes in polycyclic aromatic hydrocarbon (PAH) molecules with pentagonal rings (Moutou et al., 2000) or the C–C–C in-plane bending of PAHs with pendant hexagonal rings (Van Kerckhoven et al., 2000). Sturm et al. (2000) discovered a new 15.8 m emission feature in ISO-SWS spectra of five star-forming galaxies. Van Kerckhoven et al. (2000) detected a broad plateau of emission at 15 – 20 m in several sources, corresponding to the broad 17.0 m feature discovered by Beintema et al. (1996).
The Infrared Spectrograph (IRS; Houck et al. 2004) on Spitzer (Werner et al., 2004a) has the sensitivity to detect significant spectral substructure in the 15 – 20 m region not evident in previous observations. Werner et al. (2004b) (hereafter Paper 1) have discovered new spectral features at 17.4 and 19.0 m, in addition to previously detected narrow features at 15.8, 16.4 and 17.8 m and a broad feature at 17.0 m, in Spitzer IRS spectra of NGC 7023 (catalog ). We describe in §3.3 how we use higher resolution spectroscopy to improve the wavelengths for these features; as a result, the ‘15.8’ and ‘19.0’ m features become the ‘15.9’ and ‘18.9’ m features. These spectral features at 15.9, 16.4, broad 17.0, 17.4, 17.8, and 18.9 m have now all been observed in Spitzer IRS spectra of other star formation regions and galaxies (Armus et al. 2004; Brandl et al. 2004; Morris et al. 2004; Smith et al. 2004; Higdon et al. 2006; Engelbracht et al. 2006; Tappe 2006; Panuzzo et al. 2006; Smith et al. 2006), including the new 18.9 m feature which has been detected in several galaxies (Panuzzo et al. 2006; Smith et al. 2006).
We extend here the work of Paper 1, by presenting additional Spitzer IRS spectroscopy of NGC 7023, a well-studied photodissociation region (PDR) and reflection nebula. NGC 7023 is illuminated by the Herbig Be star HD 200775 (catalog ), at a distance of 430 pc (van den Ancker et al., 1997). This extension of our previous work allows us to better characterize the spatial distributions and emission mechanisms of the features in the 15 – 20 m region.
2 Observations
We describe our observational technique in Paper 1. We improve the data reduction and examine here, in further detail, the Short-High (SH) IRS spectrum (9.9 – 19.6 m; = / = 600) of NGC 7023 at one pointing position previously presented in Paper 1, obtained on 2003 September 19. The SH integration time was 6 s, repeated twice. We extract the SH spectrum from the entire aperture (47 113). We reduce three new slit pointing positions (24 additional spectra in NGC 7023) of second-order Long-Low (LL2) long-slit IRS spectra (14.0 – 21.3 m; = 80 – 128), obtained on 2003 October 1. The LL2 integration time was 30s, repeated 3 times. We refer to these new slit pointing positions as slits A, C, and D. In this notation, the LL2 slit in Paper 1 is slit pointing position B.
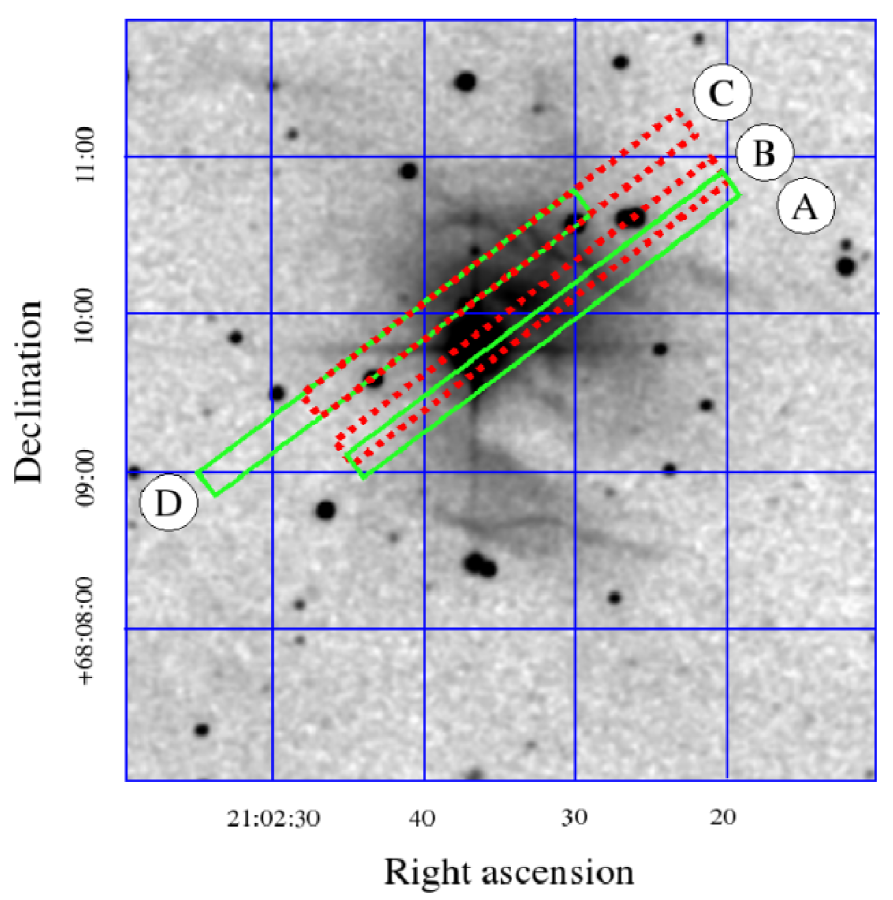
Figure 1 illustrates the location of slit pointing positions A, B, C, and D. We extract eight spectra from each slit, at evenly-spaced spatial positions we refer to as positions 1 through 8, labeled from southeast to northwest (see Fig. 1). All of the slits A, B, C, and D were observed at a slit position angle 306.4 east of north. Slit B crosses HD 200775 at position 3 (spectrum L3 in Paper 1). Slits A and C are shifted relative to B by 64 southwest and 192 northeast, respectively, in a direction perpendicular to the slit. Slit D is shifted southeast by 45′′, relative to C, in a direction parallel to the slit. We extract spectra from fixed pixel ranges (extraction box of 2 3 pixels, or 102 153) along the 2 pixel wide slit of LL2, producing eight spectra for each slit pointing position. We re-reduce Slit B, both for consistency with the other spectra presented in this paper and because of improvements in the calibration; this changes the intensities of Slit B spectra by 7%. We present here an analysis of a total of 32 spectra. All of our data was obtained prior to nominal Spitzer operations (pre-nominal status), so our intensity, wavelength, and pointing uncertainties are larger than for nominal (current) Spitzer operations. The SH and LL2 absolute positions are thus uncertain by 5″.
We reduce the data and extract spectra using Cornell IRS Spectroscopy Modeling Analysis and Reduction Tool (Higdon et al., 2004). All data are hand-calibrated by applying the spectrum and model template of point source calibrator HR 8585 (catalog ) ( Lac) to the intermediate un-flat-fielded product of the SSC pipeline. We subtract blank sky spectra only from the SH spectrum, observed as Spitzer cooled, to remove thermal emission from the then warm (45 K) baffles of the telescope. We apply the current extended source correction to the LL2 spectra. The LL2 spectra have an absolute uncertainty in their intensities of 15%, due to their being obtained very early in the Spitzer mission, before the detector bias was changed.
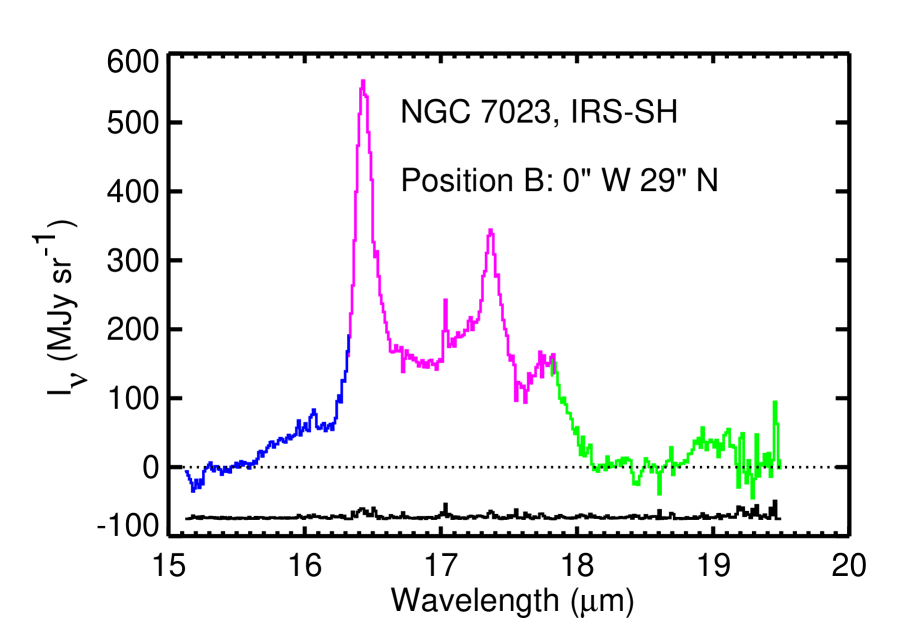
Figure 1 shows that three of the four LL2 slits we observe intersect the filaments seen to the northwest of HD 200775. The filaments, seen in Figure 1, trace a PDR front (Lemaire et al., 1996). All four LL2 slits also cover low-intensity regions to the southeast of HD 200775. The LL2 slit illustrated in Paper 1 is shown in Figure 1 as Slit B, and it intersects both the northwest filaments and HD 200775. The SH spectrum (Paper 1) is obtained 0′′W 29′′N of HD 200775, between the star and the PDR front.
3 Results
3.1 Observed Features at High Resolution
Figure 2 illustrates our SH spectrum (15.1 – 19.5 m; = 600) in NGC 7023. This is a part of the SH spectrum shown in Paper 1, although we improve the reduction, better matching the spectral segments by shifting wavelength zero points in each order by 0.05 m. For these pre-nominal Spitzer data, the SH wavelengths are more uncertain than relative intensity levels. We establish an absolute wavelength scale with the 17.03 m 0–0 S(1) H2 line. We also improve the contrast of weak features by subtracting a continuum.
We plot uncertainties in Figure 2 calculated from the root-mean-square difference between the data and a seven-point moving boxcar average of the data. The statistical uncertainties, as measured from the difference between two individual integrations, are too small to be visible as error bars.
Figure 2 clearly shows resolved emission features at 16.4, 17.4, and 17.8 m. We detect weaker resolved emission features at 15.9 and 18.9 m. The broadness of these emission features (0.1 – 0.6 m, or 5 – 20 cm-1) implies a solid-state material, a molecular band, or a molecular vibrational mode broadened for the same reasons that the AEFs are broad. The only unresolved emission line in Figure 2 is the 0 – 0 S(1) H2 line at 17.03 m.
3.2 Long-Slit Spectra
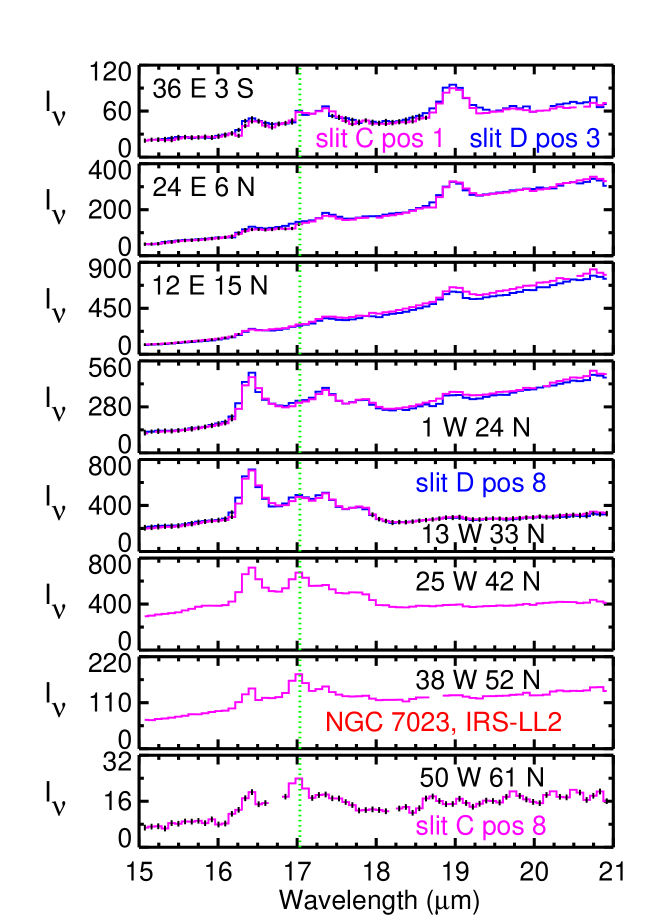
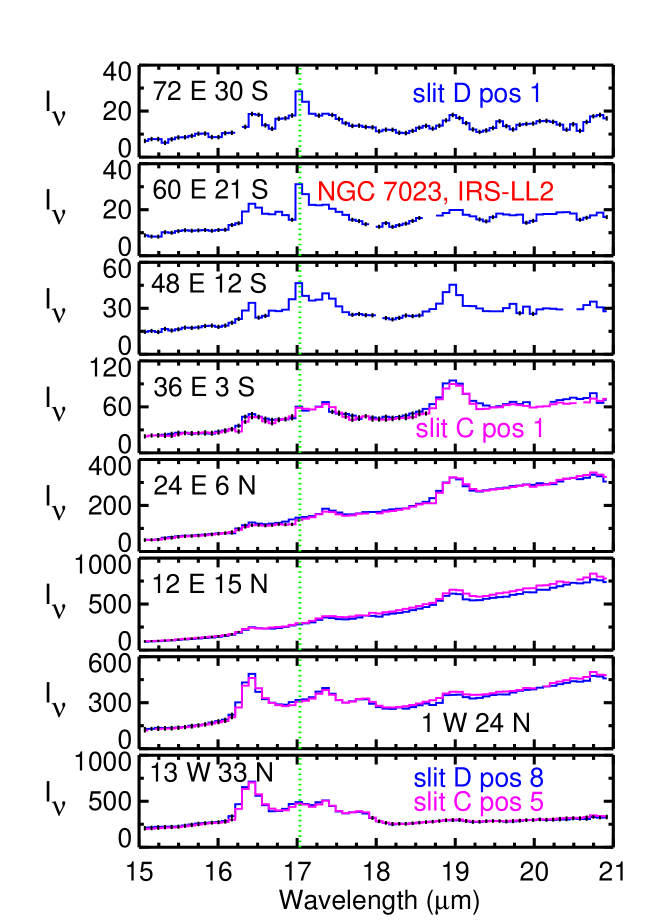
We present our LL2 spectra (14 – 21 m; = 80 – 128) in NGC 7023 in Figures 3, 4, 5, and 6. We plot uncertainties derived in the same way as for Figure 2, except that a five-point moving boxcar was used.
Figure 3 illustrates our new results for slit A. These spectra demonstrate marked spectral variability from the PDR traced by the northwest filaments, dominated by the 16.4 m emission feature, the broad 17.0 m feature, and the 0 – 0 S(1) H2 line at 17.0 m; to the regions between the PDR and the star, where the 16.4, 17.4, and broad 17.0 m features are strongest; to the southeast, where the 18.9 m feature is most prominent and the 16.4 m feature is extremely faint.
Figure 4 shows our results for slit B, from Paper 1, which have been re-calibrated (7% change) and are illustrated here for comparison. The spectral features vary with spatial position in slit B much as they do in slit A. The 17.4 m feature is most easily seen in spectra where both the 16.4 and 18.9 m features are present.
Figures 5 and 6 show our new data for slits C and D, respectively. Figures 5 and 6 reveal the 16.4 and broad 17.0 m emission features and H2 emission in the northwest filaments; a strong 18.9 m emission feature both northeast and southeast of HD 200775; and then a resurgence of the 16.4 m feature and H2 emission at the most southern positions.
Many of the observed positions on the sky coincide to within 1 pixel (5″) for slits C and D. We overplot the independently reduced spectra, at coincident spatial positions, on Figures 5 and 6. These independently reduced spectra at similar (within 5″) spatial positions are the best assessment we can provide of the quality of our data, because we are primarily limited by systematics rather than by signal-to-noise.
We highlight some of our main results in Figure 7. This figure illustrates two pairs of spectra at similar projected distances ( = 24 – 25″ or = 49″) from HD 200775, but in different directions (east or west). The continuum has been subtracted, by fitting a parabola to points well-separated from spectral emission features.
Figure 7 demonstrates that the LL2 spectra east and west of the star have striking differences even at the same projected distance from the star, and at the same gas phase (neutral or molecular). The two western spectra are in the well-studied northwestern region of NGC 7023 containing narrow, bright filaments marking the PDR front there. The two eastern spectra are typical of the poorly-studied southeastern region of NGC 7023, where we recently discovered the 18.9 m interstellar emission feature (Paper 1).
The 16.4 m emission feature has the highest intensity (in MJy sr-1) of any emission feature in the 15 – 20 m spectra of NGC 7023 (Figs. 3, 4, 5, 6, and 7). The 16.4 m feature emission, however, with its strong spatial correspondence with the northwest filaments in NGC 7023, has much lower intensity east and southeast of the star. Thus the 16.4 m feature becomes weaker than the 18.9 m feature in the two eastern spectra of Figure 7.
Figure 7 shows that the 18.9 m emission feature is very prominent in the eastern spectra, especially when compared to its relative weakness in western spectra at similar . This difference is observed at the southeast and northwest PDR fronts, as traced by H2 emission ( = 49″), and within the neutral H I gas ( = 24 – 25″).
Figure 7 shows that the 15.9 m feature is easily seen at = 49″ NW, hinted at in the spectrum of = 24″ NW, but is not detected at = 25″ NE or = 49″ SE. We also conclude from Figure 7 that the 17.8 m feature is observed only where the 16.4 m emission feature dominates the spectrum of NGC 7023: = 24 – 49 ″ NW. The 17.4 m feature is apparent in all spectra of Figure 7. Its relative strength is difficult to estimate at this spectral resolution, due to strong blending with H2, the 17.8 m feature, and probably at least one other feature (see below).
At the spectral resolution of LL2 ( = 80 – 128), it is difficult to measure the relative strengths of individual emission features, particularly in the crowded 16 – 18 m spectral complex. Still, there must be additional emission between the 16.4 m emission feature and the 17.4 m feature in order to explain the overall 16 – 18 m emission complex. Smith et al. (2006) fit this additional emission in LL2 spectra with a broad (1.1 m FWHM) feature at 17.0 m. We attempted a similar fit to this additional emission in NGC 7023, at the resolution of LL2 spectra, and were unable to find a unique fit. We examine this broad emission, underlying the 15.9, 16.4, 17.4, and 17.8 m features, further in the next section using higher spectral resolution.
3.3 Profile Fitting to Observed Spectra
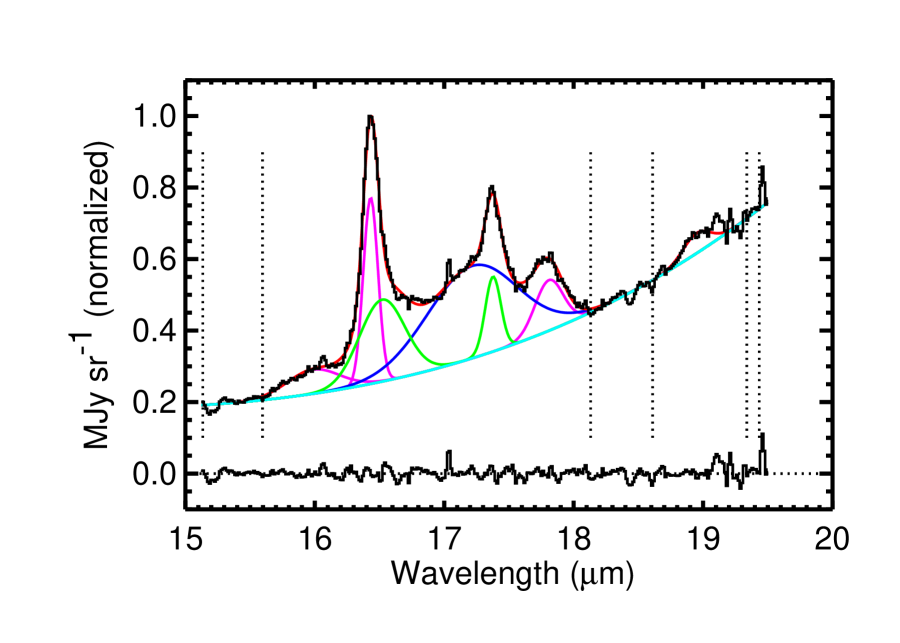
We model our SH spectrum, in order to quantify the FWHM of each emission feature. We use a program called LINER (Pogge, 2004) to fit multiple blended Gaussians to the SH spectrum we observe. We illustrate our technique in Figure 8. We also ran fits with Lorentzian profiles (Boulanger et al., 1998), which are similar to the Drude profiles used by Smith et al. (2006); our conclusions do not depend on whether a Gaussian or Lorentian profile is used.
First, we use a routine within LINER to interactively choose ranges of wavelengths for the continuum, as shown in Figure 8. LINER requires a minimum of two wavelength ranges, and a minimum of two wavelength points per wavelength range. The continuum for LINER is equal to a parabolic fit to the spectrum in these wavelength ranges.
Second, we use another routine within LINER to make initial guesses at the height, width, and center of each Gaussian that is used to model each feature within the SH spectrum. We do not fit profiles to features whose peak intensities are less than 5% of the continuum intensity, taking this as the limit for possible calibration artifacts (Uchida, 2005).
Third, we use an interactive plotting tool within LINER to refine our guesses for the Gaussian parameters of each feature. This routine plots the individual Gaussians and the sum of the multi-Gaussian fit, resulting from our refined guesses, plotted over the data. This routine also plots the residuals between the data and the fit to highlight where the model needs adjustment. This routine allows us to modify our refined guesses, by adding or subtracting features, or by changing a feature’s central wavelength, peak intensity, or FWHM, in response to the quality of the model fit and its residuals. It is during this step that broader features, such as the 17.0 m feature, are better defined. We iterate within this routine, modifying the refined guesses, until we have fit the observed spectrum by eye as well as we can.
Fourth, we use a routine within LINER which uses standard numerical techniques to search for best fit parameters for each feature (modeled as a Gaussian) that minimizes the difference between the entire model fit and the observed spectrum, based on the refined guesses we provide. If the routine does not converge on a solution that is similar to our refined guesses, we repeat the process, modifying our initial and refined guesses, until we and the software concur on the fit.
We show the resulting fit, using this technique, for our SH spectrum in Figure 8. We illustrate the wavelength ranges for the continuum points, the derived continuum, the individual Gaussians, the sum of the multi-Gaussian fit, and the residuals plotted together with the original spectrum. The residuals are another measure of the uncertainty in our SH spectrum.
We measure the central wavelength and full width at half maximum (FWHM) of emission features in our SH spectrum ( = 600). We list these derived properties in Table 1. All emission features are resolved except for H2.
The wavelength calibration is uncertain for our SH spectrum, because it was acquired during pre-nominal operations. We therefore examine seven SH spectra 8″ from Position B, from AOR key 3871232 (pid 28). These spectra, obtained from a spectral map with short integration times per position, are noisier than our SH spectrum and so are not reduced beyond the pipeline products or presented here. These spectra, however, are sufficient to measure the central wavelengths and FWHMs of all emission features except the 18.9 m emission feature. For the 18.9 m emission feature, we select the ten spectra with the highest signal-to-noise 18.9 m emission feature, from the entire spectral map, to measure the central wavelength and FWHM of the 18.9 m emission feature. Nine of these spectra are 15 – 42″ southwest of the star; one is 10″ southeast of the star.
| TABLE 1 | ||
| Observed Interstellar Emission Features at = 600 in NGC 7023 | ||
| FWHMa | ||
| (m) | (m) | References for Discoveryb |
| 15.9 0.1 | 0.3 – 0.6 | Sturm et al. 2000 |
| 16.4 0.1 | 0.1 – 0.2 | Moutou et al. 2000; Van Kerckhoven et al. 2000; Sturm et |
| al. 2000 | ||
| 16.6 0.1 | 0.4 – 0.9 | This paper |
| 17.03 | 0.021 | 0–0 S(1) H2 |
| 17.2 0.1 | 0.2 – 0.8 | This paper |
| 17.4 0.1 | 0.1 – 0.2 | Paper 1 |
| 17.8 0.1 | 0.3 – 0.4 | Beintema et al. 1996 |
| 18.9 0.1 | 0.2 – 0.3 | Paper 1 |
(a) Central wavelength and FWHM for all features measured from SH spectra ( = 0.021 m). The 0–0 S(1) H2 line at 17.03 m, used to fix the zero point of the wavelength calibration, is unresolved.
(b) Reference for first detection of emission feature.
The very broad 16 – 18 m emission plateau underneath most of the features in Table 1 is not well fit by a single Gaussian at 17.0 m, as found in the ISM previously at lower signal-to-noise (Beintema et al. 1996; Van Kerckhoven et al. 2000) or lower spectral resolution (Smith et al. 2004, Smith et al. 2006). Our best fit is with two broad features, one at 16.6 0.1 m and another at at 17.2 0.1 m. We find a best fit with two broad features both for Gaussian and Lorentzian fits, although the central wavelengths shift: 16.6 and 17.2 m for a Gaussian fit, or 16.8 and 17.1 m for a Lorentzian fit. The 16.6 m feature might be a long wavelength wing to the 16.4 m emission feature rather than an independent emission feature, analogous to the long wavelength wings of the 6.2 or 11.3 m AEFs.
4 Discussion
4.1 Laboratory comparison to NGC 7023 spectrum
To prepare for the launch of ISO, Moutou et al. (1996) published the 14 – 40 m laboratory spectra of neutral PAHs. They considered a number of PAH mixes, and successfully predicted the 16.4 m feature in the ISM. They did not, however, predict the 18.9 m emission feature. They also did not predict any of the other emission features observed in NGC 7023 and elsewhere in the ISM, such as the 15.9, 17.4, or 17.8 m features, or the broad 17.0 m feature which we fit best by two features at 16.6 and 17.2 m.
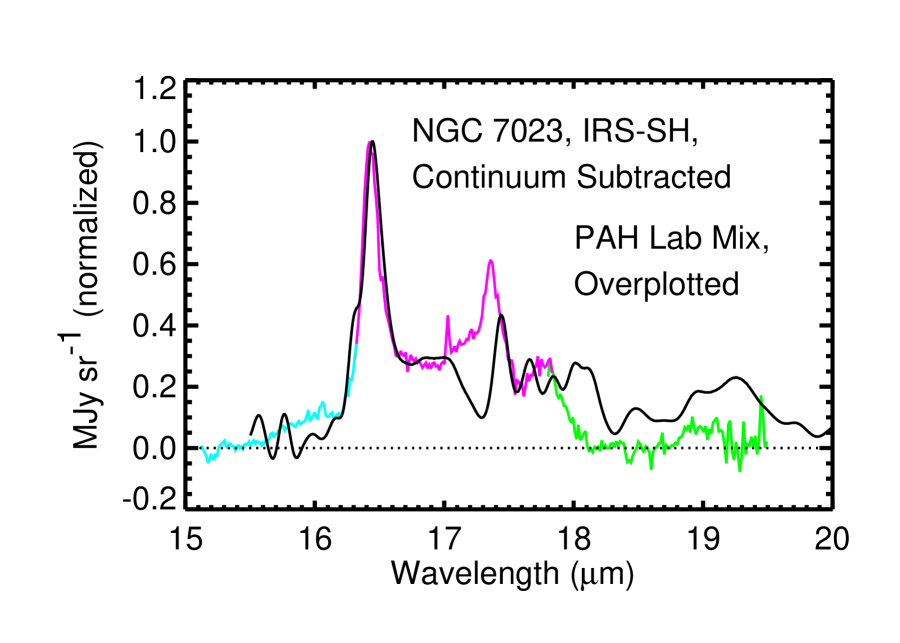
Peeters et al. (2004) construct the spectra of two laboratory mixes of PAHs, from the extensive PAH spectral database at NASA Ames Research Center. They compare these two mixes to ISO-SWS spectra of two different AEF sources, and find good fits. One source is dominated by the broad 17.0 m feature, with no other strong emission features. The other source, CD 11721 (catalog ), is dominated by the 16.4 m feature, as are many of our NGC 7023 spectra.
Peeters et al. (2004) overplot our SH spectrum (15.1 – 19.5 m; = 600; see Paper 1 and Fig. 2) of NGC 7023 on the ISO-SWS spectrum of CD 11721, to show the spectral similarities. Both are dominated by the 16.4 m feature. They then plot a spectrum of a PAH laboratory mix on top of their CD 11721 spectrum, to show the promising match in features. But they do not directly compare their spectrum of a PAH laboratory mix to our SH spectrum of NGC 7023. We show this comparison in Figure 9, with the PAH laboratory spectrum courtesy of Peeters and her collaborators. The 16.4 m feature in the laboratory mix is an excellent match to the nebular 16.4 m feature in NGC 7023. The weaker substructure in the laboratory mix bears some resemblance to the SH spectrum of NGC 7023. Figure 9 shows, however, significant mismatches when the laboratory and SH spectra are compared in detail.
Peeters et al. (2004) suggest that the 18.9 m feature is due to ionized PAHs, based on fits to laboratory mixes of PAHs, but they do not specifically search for a PAH mix that would reproduce the spectrum of NGC 7023. Furthermore, they do not explore a mix including both neutral and ionized PAH species, as would be expected for NGC 7023. They plan a more detailed analysis of their laboratory data in the future. Their excellent match to the strong 16.4 m emission feature, and their modest success in producing weaker emission features at 15 – 20 m, holds out promise that further laboratory work may provide identifications for some of the emission features at 15 – 20 m.
4.2 Spatial variations in different emission features
We observe marked changes in spectral features across NGC 7023 (Figs. 3, 4, 5, 6, and 7), which can be studied reliably using the long-slit capabilities of the IRS on Spitzer. In Figure 10, we have divided the 16.4 and 18.9 m feature intensity data into nebular regions east and west of HD 200775, and then plotted the spatial distribution of each. The statistical uncertainties are less than the sizes of the points in Figure 10; the uncertainty in this plot comes from the intrinsic scatter between intensity values at different nebular positions with similar projected distances from the star.
Figure 10 shows the 16.4 m feature is strongly peaked 36″ west of HD 200775. This is near the PDR front traced by H2-emitting filaments (Lemaire et al. 1996; An & Sellgren 2003; Witt et al. 2006) northwest of the star.
The 3.3, 6.2, and 11.3 m AEF emission is strongly peaked on the northwest filaments (Cesarsky et al. 1996; An & Sellgren 2003). Moutou et al. (2000) and Van Kerckhoven et al. (2000) identify the 16.4 m feature with C–C–C vibrational modes of neutral PAHs, while the AEFs are widely attributed to PAHs. The spatial distribution of the 16.4 m emission feature thus supports the current identification of it with PAHs.
Figure 10 also shows that, by contrast, the 18.9 m feature is symmetrically distributed east and west of HD 200775, with a smooth fall-off in intensity with , the projected distance from HD 200775. We can fit a power-law to the distribution of the 18.9 m feature intensity, , with . We find that .
We find the same results for both the 16.4 and 18.9 m features if the data are instead split into northern and southern sections: the 16.4 m feature peaks in the north at the PDR front, and the 18.9 m feature peaks symmetrically on the star. The feature intensities in Figure 10 come from the area under a locally-defined linear baseline, rather than the Gaussian fit to the entire spectrum described in §3.3, but the results described in this section are unchanged if feature intensities from Gaussian fits to the entire spectra are analyzed instead.
A basic difference between the 16.4 m feature and the 18.9 m feature in NGC 7023 is that the 16.4 m feature is bright in the northwestern PDR, where the column density is known to be high, while the 18.9 m feature remains bright 30″ east and south of the star, where it appears the column density is low.
The regions east and south of the star appear, at least in projection, to lie inside the fossil bipolar outflow observed in the 24 m Spitzer MIPS emission (Paper 1). The northwest PDR, by contrast, appears to be part of the remnant molecular material surrounding the original bipolar outflow. It is possible that shock processing plays a role in the creation of the 18.9 m feature carrier.
4.3 Identifying the 18.9 Micron Interstellar Emission Feature
4.3.1 Minerals
The strength of the 18.9 m feature near the star, and its rapid falloff with , leads us to consider whether the excitation of this feature could be equilibrium thermal emission from large grains, rather than non-equilibrium emission from tiny grains, PAHs, or other large molecules. We can (with difficulty) construct a model of equilibrium thermal emission that explains the 18.9 m feature itself, but cannot construct a equilibrium thermal emission model for the underlying 18.9 m continuum. In this case, the observed 18.9 m continuum would be due to non-equilibrium emission, from tiny grains or large molecules.
In the equilibrium thermal emission model for the 18.9 m feature, its carrier is large grains of unknown composition. We searched the literature for astrophysically important minerals, and also searched the Jena - St. Petersburg Database of Optical Constants at http://www.astro.uni-jena.de/Laboratory/Database/jpdoc/index.html (Henning et al., 1999). We can rule out the following substances as carriers of the 18.9 m feature: graphite (Draine & Lee, 1984), amorphous carbon (Colangeli et al., 1995), hydrogenated amorphous carbon (Ogmen & Duley, 1988), hydrocarbon nanoparticles (Herlin et al., 1998), amorphous silicates (both olivines, Mg2yFe2y-2SiO4, and pyroxenes, MgxFe1-xSiO3; Jäger et al. 1994; Dorschner et al. 1995; Koike et al. 2000), crystalline silicates (both olivines and pyroxenes; Koike et al. 1993; Jäger et al. 1994; Koike et al. 2000, 2003), quartz (SiO2; Koike & Shibai 1994; Posch et al. 1999), corundum (Al2O3; Posch et al. 1999), spinel (MgAl2O4; Posch et al. 1999; Fabian et al. 2001), FeO (Henning et al., 1995; Henning & Mutschke, 1997), MgO (Henning et al., 1995), rutile (TiO2; Posch et al. 1999), SiC (Mutschke et al., 1999; Henning & Mutschke, 2001), TiC (Henning & Mutschke, 2001), carbonates such as CaMg(CO3)2, CaCO3, MgCO3, FeCO3 and CaFe(CO3)3 (Kemper et al., 2002), FeS (Henning & Mutschke, 1997), MgS (Hony et al., 2002), crystalline or amorphous SiS2 (Begemann et al., 1996; Kraus et al., 1997; Henning & Mutschke, 1997), or silicon nitride (Si3N4; Clément et al. 2005).
4.3.2 Aromatic Molecules
If the 18.9 m feature is not due to emission from large grains in thermal equilibrium, then it, like the 16.4 m feature, is due to non-equilibrium emission from nanoparticles: tiny grains, PAHs, or other large molecules. Here we discuss one main class of large molecules: aromatics such as PAHs.
Rapacioli et al. (2005) combine ISO-CAM circular variable filter (CVF) images of NGC 7023 with laboratory and theoretical spectra of neutral and ionized PAHs, and analyze these with a decomposition technique, to construct what they call images of the ionized PAHs (PAH+) and neutral PAHs (PAH0) in NGC 7023. They measure the strength of PAH+ and PAH0 emission along a line from the star, through the northwest filaments, into the molecular cloud. Their results show that PAH+ does not peak on the star, but rather peaks between the star and the northwest filaments, at = 24″ from the star. They find that PAH0 peaks at = 42″ from the star, in the northwest filaments.
Flagey et al. (2006) use ISO-CAM CVF images plus Spitzer IRAC images to derive improved images for PAH+ and PAH0 in NGC 7023, with a similar decomposition technique. Their images show the same results as those of Rapacioli et al. (2005). Flagey et al. (2006) find that PAH+ peaks midway between the star and the northwest filaments, at = 22″, not on the star itself. Flagey et al. (2006) observe PAH0 to peak on the northwest filaments, at = 40″.
We compare the spatial distribution of our 18.9 m emission feature intensity to the Flagey et al. (2006) results in Figure 11. We calculate PAH+ and PAH0 relative intensities, from images kindly provided to us by Flagey et al. (2006), at the same spatial positions at which we measure the 18.9 m feature intensity. Figure 11 vividly illustrates how unique the 18.9 m feature distribution is compared to the distribution of neutral and singly ionized PAHs inferred by Flagey et al. (2006). Figure 11 shows that the peak 18.9 m feature emission is centered at = 0, in contrast to the regions of peak PAH+ ( = 22″ west) and PAH0 ( = 40″ west) emission. This is true even if one excludes the 18.9 m data point at the position of HD 200775.
Figure 11 clearly demonstrates that the distribution of intensity for the 18.9 m feature we observe is spatially quite distinct from the distributions for PAH+ and PAH0 derived by Flagey et al. (2006). A similar plot of the Rapacioli et al. (2005) PAH+ and PAH0 data yields the same result. PAH+ and PAH0 are appealing carriers for the 18.9 m feature, because of their likely ubiquity in space and the probability that laboratory data and theoretical modeling of mixes of their spectra at 15 – 20 m will be published in the near future. If the analyses of Rapacioli et al. (2005) and Flagey et al. (2006) are correct, however, concerning the location of PAH+ and PAH0 in NGC 7023, then PAH+ and PAH0 would both be unlikely carriers for the 18.9 m feature.
Witt et al. (2006) observe the the Extended Red Emission (ERE) in NGC 7023 to be bright in the northwestern filaments. They show that the ERE is coincident in most cases with the H2 emission in the filaments. The 16.4 m feature peaks in these filaments (Fig. 10), as do the AEFs (Cesarsky et al. 1996; An & Sellgren 2003). This argues against the ERE carrier and the 18.9 m carrier being the same. Witt et al. (2006) propose that PAH dications (PAH++) are the carriers of the ERE. This is a tentative argument against PAH++ being the carriers for the 18.9 m emission feature, but the PAH++ identification model for the ERE (Witt et al., 2006) needs to be confirmed.
If a mix of neutral and ionized PAHs does not provide a match to our NGC 7023 spectra, then there are many other PAH variants to explore. A long list of references is given in Halasinksi et al. (2005), including (among others) PAHs with side groups, nitrogen-substituted PAHs, dehydrogenated PAHs and protonated PAHs.
4.3.3 Fullerenes
The 18.9 m feature has a spatial distribution quite distinct from that of the 16.4 m feature in NGC 7023. Figure 7 illustrates that spectra west of the star are dominated by the 16.4 m feature (likely due to PAHs), while spectra east of the star are dominated by the 18.9 m feature. Figure 10 shows that the 18.9 m feature peaks on the star, with an intensity proportional to ; the 16.4 m feature shows no dependence on . This spatial distinction between the 18.9 and 16.4 m features suggests that two different species may be needed, rather than two ionization states of similar species.
Jura (2004) has suggested that the 17.4 and 18.9 m features in NGC 7023 are due to neutral C60. C60 would emit by non-equilibrium emission in NGC 7023 (Moutou et al., 1999). Kwok et al. (1999) detect narrow features at 17.85 and 18.90 m in the C-rich protoplanetary nebula IRAS 07135+1005 (catalog ). They tentatively detect a third narrow feature at 19.15 m. Kwok et al. (1999) note that neutral C60 has four fundamental vibrational frequencies, at 7.1, 8.6, 17.5 and 19.0 m (Frum et al., 1991). They stop short of identifying the features observed in IRAS 07135+1005 as due to C60, however. The emission feature in IRAS 07135+1005 at 17.85 m is not a good wavelength match for the C60 17.5 m line. Furthermore, Kwok et al. (1999) do not detect the 8.6 m C60 feature in IRAS 07135+1005 (they are unable to search for the 7.1 m line).
We observe emission features at 17.4 and 18.9 m, together, to the east and southeast of the star. These two features are a better wavelength match to the 17.5 and 19.0 m lines of neutral C60. This suggests that these two features might be due to C60. The 17.4 m feature, however, is also observed northwest of the star, where the 16.4 feature peaks and the 18.9 m feature is weak. This casts doubt on attributing the 17.4 m feature, at least, to C60.
Two possibilities exist to explain why the 17.4 m feature is observed in both east and west of the star, while the 18.9 m feature is not. First, the 17.4 m feature could be unrelated to the 18.9 m feature. In this case, neither feature is due to C60, and the 17.4 m feature has a spatial distribution which is distinct from both the 16.4 and the 18.9 m features. Second, the 17.4 m feature could be a blend (at the lower resolution of our LL2 spectra) of two features. In this case, one contributor to the 17.4 m intensity, perhaps C60, follows the 18.9 m feature, while the other contributor to the 17.4 m intensity, probably PAHs, follows the 16.4 m feature. These two possibilities might be distinguished by comparing higher resolution 15 – 20 m spectra east and west of the star.
Another way to test the possibility that the 17.4 and 18.9 m features are from C60 is to search for emission from its other two vibrational modes at 7.1 and 8.6 m (Frum et al., 1991). Moutou et al. (1999) searched for the 7.1 and 8.6 m lines of C60 at the nebular peak of NGC 7023, near the northwest PDR, and placed strong upper limits on C60. The 18.9 m feature is weak in this northwest region, however, so this does not rule out C60 as an identification for the 18.9 m feature. By obtaining 7 – 9 m spectra east and southeast of the star, where the 18.9 m feature is observed, one could search for the 7.1 and 8.6 m lines of C60, to directly test the hypothesis that the 18.9 m feature (and part of the 17.4 m feature intensity) is due to C60.
Moutou et al. (1999) use the models of Bakes & Tielens (1994) to show that fullerenes in NGC 7023 should be divided between neutral C60 (35%) and ionized C (50%). Moutou et al. (1999) also put stringent upper limits on C at the NGC 7023 nebular peak, from the absence of the 7.1 and 7.5 m vibrational modes of C (Fulara et al., 1993). Moutou et al. (1999), however, did not search for these emission lines east or southeast of the star. Spectra of NGC 7023 at 7 – 9 m, at these positions where the 18.9 m feature is bright, would simultaneously search for the 7.1 and 7.5 m lines of C as well as the 7.1 and 8.6 m lines of C60. No laboratory spectra at 15 – 20 m exist for C, so it is not known where its longer wavelength lines might be. If C60 is present in NGC 7023, however, then C should also be present at a similar abundance. Laboratory spectra at 10 – 40 m of C are needed, to measure the wavelengths of all four infrared lines, and to measure their relative strengths.
C70 has lines at 17.4, 18.1, and 19.0 m (Nemes et al., 1994). The lines at 18.1 and 19.0 m have equal intensity in gas-phase C70 emission (Nemes et al., 1994). The absence of a detectable 18.1 m feature in NGC 7023, particularly in the regions where the 18.9 m feature is observed to be strong, makes C70 an unlikely identification for the 17.4 or 18.9 m features.
4.3.4 Diamonds
Many authors suggest that interstellar nanodiamond grains, similar to pre-solar nanodiamonds extracted from meteorites, can explain some infrared emission features seen in the ISM or circumstellar environments (Koike et al. 1995; Hill et al. 1997; Hill et al. 1998; Guillois et al. 1999; Van Kerckhoven et al. 2002). Pre-solar meteoritic nanodiamonds have a median radius of 1.3 nm, and thus can radiate by non-equilibrium thermal emission in the ISM (Koike et al., 1995).
Laboratory spectra of pre-solar nanodiamonds have problems with surface contamination of the nanodiamonds, which adds strong features that can mask the weak features of diamond. Pure diamond itself has no infrared-active lines at 15 – 20 m, but impurities and crystal defects break the symmetry and allow lines to appear in the diamond spectrum. Laboratory spectra of pre-solar nanodiamonds (from the Allende, Murchison, and Orgueil meteorites), natural (terrestrial) diamonds, and synthetic diamonds (Lewis et al. 1989; Colangeli et al. 1994; Koike et al. 1995; Mutschke et al. 1995; Hill et al. 1997; Andersen et al. 1998; Braatz et al. 2000; Mutschke et al. 2004) show no features at 18.9 m and thus rule out nanodiamonds as identifications for the 18.9 m feature.
Oomens et al. (2006) argue that the identification of interstellar diamonds in meteorites make it worth considering smaller diamonds, such as diamondoids, as possible ISM components. Diamondoids, whose surfaces are fully hydrogenated, are the smallest diamond molecules. These diamond molecules can have a varying number of diamond cages, such as one (adamantane; C10H16), two (diamantane; C14H20), or three (triamantane; C18H24). The 3 – 15 m spectra of diamondoids with one through six diamond cages have been measured in the laboratory by Oomens et al. (2006). No laboratory data exist at 15 – 20 m. Lu et al. (2005) predict vibrational frequencies at 15 – 20 m for diamondoids with one through ten diamond cages. They do not predict any features at 18.9 m for the first five diamond cages. Pirali (2006), who predicts vibrational frequencies at 15 – 20 m for the same diamondoids measured by Oomens et al. (2006), predicts a 19.1 m line for [121]tetramantane. This 19.1 m line is accompanied by a much stronger 16.3 m line, however, which does not explain the strong 18.9 m and faint 16.4 m feature emission to the east and southeast of the star. Laboratory spectra of diamondoids at 15 – 20 m are needed, but it looks unlikely that diamondoids can explain the 18.9 m feature.
4.4 Further work
Further observations, and further laboratory work, are needed to better identify the 18.9 m emission feature in NGC 7023, as well as other emission features at 15 – 20 m.
Further observations are needed where the 18.9 m feature is bright in NGC 7023, east and southeast of the star, particularly high-resolution spectra at 7 – 9 m and 15 – 20 m. Spectra should be obtained with enough spectral resolution to cleanly measure the strength of the 17.4 m feature (LL2 spectra are too low resolution), and compared east and west of the star, to search for any blending of the 17.4 m feature. This tests the hypothesis that the 18.9 m feature (and part of the 17.4 m feature intensity) is due to C60. New 7 – 9 m spectra in regions where the 18.9 m feature dominates the spectrum are needed to test the C60 identification, by searching for the 7.1 and 8.6 m lines of C60. This will also simultaneously search for the 7.1 and 7.5 m lines of C. High spectral resolution ( 2000) is important at 7 – 9 m because the C60 features are superposed on the very strong 7.7 m AEF and are expected to be weak.
The firm detection of the 18.9 m feature in only two out of a sample of 27 H II nuclei galaxies (Smith et al., 2006) demonstrates that this feature exists outside NGC 7023, but it is not common. Detailed observations of the phenomenology for all of the 15 – 20 m features, but especially the 18.9 m feature, are important to obtain in sources other than NGC 7023.
Published 15 – 20 m laboratory spectra of PAHs, fullerenes (especially C), and nanodiamonds/diamondoids are essential; these species, so far, are the leading candidates for the 18.9 m feature. But the spatial dependence of the 18.9 m feature intensity in NGC 7023, with (Fig. 10), suggests that ionized and photochemically altered forms of these materials should be especially pursued.
Alternatively, the 18.9 m feature carrier could be a photodissociation or shock product, or a species only able to exist or survive near the star. Theory aimed at understanding the spatial distribution of the 18.9 m feature intensity in NGC 7023 may be able to predict new ISM components for which 15 – 20 m spectra laboratory spectra could be obtained, and compared with 15 – 20 m spectra of NGC 7023.
We are interested in identifying all the features at 15 – 20 m, not merely the 18.9 m feature. In this context, laboratory 15 – 20 m spectra should be obtained of PAH variants which have proven fruitful for studies of the AEFs, such as PAHs with side groups, nitrogen-substituted PAHs, protonated PAHs, or dehydrogenated PAHs (Halasinksi et al., 2005).
A final possibility is that nanoparticles (radius 1 nm) of minerals thought or known to be present in the ISM, such as silicates or SiC, might have spectra that differ from those of the solid-state mineral. Such nanoparticles would emit by non-equilibrium emission in NGC 7023. Infrared gas-phase emission spectra of 1 – 2 nm radius nanoparticles, when technically feasible in the laboratory, would be an important area of exploration for ISM studies.
5 Conclusions
We observe the 15 – 20 m spectra of the photodissociation region (PDR) and reflection nebula NGC 7023. We analyze four LL2 slit pointing positions in NGC 7023, including a re-reduction of the one LL2 slit pointing position presented in Paper 1. We extract spectra at eight spatial positions along each LL2 long-slit. We fit blends of Gaussian profiles to our observed SH spectrum from Paper 1, to derive central wavelengths and FWHMs for each interstellar emission feature.
We observe spectral emission features at 15.9, 16.4, 17.4, 17.8, and 18.9 m. All of these features are resolved in our SH spectrum. We observe the broad 17.0 m emission feature first discovered by Beintema et al. (1996), and later studied by Van Kerckhoven et al. (2000), Smith et al. (2004), and Smith et al. (2006). We find, however, that it is better fit at higher spectral resolution by two features at 16.6 and 17.2 m. We observe 0–0 S(1) H2 emission, particularly at the filaments northwest of the star which mark the edge of the PDR there, and again at the PDR southwest of the star.
The 16.4 m feature is the brightest emission feature northwest of the star, and peaks in the northwest filaments. Southeast of the star, by contrast, the 18.9 m feature is the brightest emission feature. The 18.9 m feature peaks on the star, with its intensity falling off with projected distance from the star as . The 17.4 m feature is present both northwest and southeast of the star.
Moutou et al. (2000) and Van Kerckhoven et al. (2000) identify the 16.4 m feature with C–C–C vibrational transitions of neutral PAHs. We observe that the 16.4 m emission feature peaks 36″ northwest of the star; this is in the PDR traced by H2-emitting filaments (Lemaire et al. 1996; An & Sellgren 2003; Witt et al. 2006). The 3.3, 6.2, and 11.3 m AEFs also peak in the northwest filaments (Cesarsky et al. 1996; An & Sellgren 2003). The AEFs are widely attributed to PAHs, thus supporting the current laboratory identification of PAHs with the 16.4 m feature.
Peeters et al. (2004) propose the 18.9 m feature is due to ionized PAHs. Rapacioli et al. (2005) and Flagey et al. (2006) derive images of singly ionized PAHs (PAH+) and neutral PAHs (PAH0) in NGC 7023. PAH+ peaks at = 20 – 22″, between the star and the northwest filaments; PAH0 peaks at = 40 – 42″, on the northwest filaments (Rapacioli et al. 2005; Flagey et al. 2006). We observe the 18.9 m feature to peak at = 0″, and to be symmetrically distributed around the star with no peak at the northwest filaments. If the analyses of Rapacioli et al. (2005) and Flagey et al. (2006) are correct, then PAH+ and PAH0 are unlikely as identifications for the 18.9 m feature. Witt et al. (2006) propose that PAH dications (PAH++) are the carriers of the Extended Red Emission (ERE) in NGC 7023, but they observe the ERE to be bright in the northwest filaments. If their identification of the ERE with PAH++ is correct, then that would make PAH++ unlikely as an identification for the 18.9 m feature. Other PAH variants remain to be explored.
Jura (2004) notes that neutral C60 has features at 17.5 and 19.0 m, while we observe emission features in NGC 7023 at 17.4 and 18.9 m. Southeast of the star, we see these features together, with the 18.9 m feature always stronger than the 17.4 m feature. Northwest of the star, however, we observe the 17.4 m feature alone or much stronger than the 18.9 m feature. Either the 17.4 and 18.9 m features are not due to C60, or the 17.4 m feature is due to C60 plus a second 17.4 m carrier with a different spatial distribution.
Moutou et al. (1999) suggest that 50% of the C60 in NGC 7023 should be singly ionized in NGC 7023. The wavelengths for the two longer wavelength infrared active C modes are not known; they are likely to fall near the wavelengths for C60 (i.e. 17.5 and 19.0 m), but need to be measured in the laboratory. The 7 – 9 m lines of C60 and C have been searched for in NGC 7023, but not yet southeast of the star where the 18.9 m feature is bright; these observations also need to be made.
We search the literature for other identifications for the 18.9 m feature. We do not find a match among all other minerals that have been, to our knowledge, been proposed as components of the ISM and for which we were able to locate 15 – 20 m laboratory spectra. In particular, we rule out amorphous silicates, crystalline silicates, amorphous carbon, graphite, SiC, corundum, and diamonds.
We desire a better understanding of the 15.9, broad 17.0, 17.4, 17.8, and 18.9 m emission features we observe in NGC 7023. This awaits new and better laboratory data on PAH variants, C, other fullerenes, nanodiamonds, diamondoids, and related species. Laboratory spectra, and ISM theory as a guide, are essential to sort through the possible identifications of these features. Detailed observations of these features in sources other than NGC 7023 will determine how widespread each feature is, and clarify whether the same phenomenology is observed elsewhere.
References
- An & Sellgren (2003) An, J. H. & Sellgren, K. 2003, ApJ, 599, 312
- Andersen et al. (1998) Andersen, A. C., Jorgensen, U. G., Nicolaisen, F. M., Sorensen, P. G., & Glejbol, K. 1998, A&A, 330, 1080
- Armus et al. (2004) Armus, L. et al. 2004, ApJS, 154, 178
- Bakes & Tielens (1994) Bakes, E. L. O., & Tielens, A. G. G. M. 1994, ApJ, 427, 822
- Beintema et al. (1996) Beintema, D. A. et al. 1996, A&A, 315, L369
- Begemann et al. (1996) Begemann, B., Dorschner, J., Henning, Th., & Mutschke, H. 1996, ApJ, 464, L195
- Boulanger et al. (1998) Boulanger, F., Boissel, P., Cesarsky, D., & Ryter, C. 1998, A&A, 339, 194
- Braatz et al. (2000) Braatz, A., Ott, U., Henning, T., Jäger, C., & Jeschke, G. 2000, Meteoritics and Planetary Science, 35, 75
- Brandl et al. (2004) Brandl, B. R. et al. 2004, ApJS, 154, 188
- Cesarsky et al. (1996) Cesarsky, D., Lequeux, J., Abergel, A., Pérault, M., Palazzi, E., Madden, S., & Tran, D. 1996, A&A, 315, L305
- Clément et al. (2005) Clément, D., Mutschke, H., Klein, R., Jäger, C., Dorschner, J., Sturm, E., & Henning, Th. 2005, ApJ, 621, 985
- Colangeli et al. (1994) Colangeli, L., Mennella, V., Stephens, J. R., & Bussoletti, E. 1994, A&A, 284, 583
- Colangeli et al. (1995) Colangeli, L., Mennella, V., Palumbo, P., Rotundi, A., & Bussoletti, E. 1995, A&AS, 113, 561
- Draine & Lee (1984) Draine, B. T., & Lee, H. M. 1984, ApJ, 285, 89
- Dorschner et al. (1995) Dorschner, J., Begemann, B., Henning, Th., Jäger, C., & Mutschke, H. 1995, A&A, 300, 503
- Engelbracht et al. (2006) Engelbracht, C. W., et al. 2006, ApJ, 642, L127
- Fabian et al. (2001) Fabian, D., Posch, Th., Mutschke, H., Kerschbaum, F., & Dorschner, J. 2001, A&A, 373, 1125
- Flagey et al. (2006) Flagey, N., Boulanger, F., Verstraete, L., Miville Deschênes, M. A., Noriega Crespo, A., & Reach, W. T. 2006, A&A, 453, 969
- Frum et al. (1991) Frum, C. I., Engleman, R. Jr., Hedderich, H. G., Bernath, P. F., Lamb, L. D., & Huffman, D. R. 1991, Chem. Phys. Lett., 176, 504
- Fulara et al. (1993) Fulara, J., Jakobi, M., & Maier, J. P. 1993, Chem. Phys. Lett., 211, 227
- Guillois et al. (1999) Guillois, O., Ledoux, G., & Reynaud, C. 1999, ApJ, 521, L133
- Halasinksi et al. (2005) Halasinksi, T. M., Salama, F., & Allamandola, L. J. 2005, ApJ, 628, 555
- Herlin et al. (1998) Herlin, N., Bohn, I., Reynaud, C., Cauchetier, M., Galvez, A., & Rouzaud, J.-N. 1998, A&A, 330, 1127
- Henning et al. (1995) Henning, Th., Begemann, B., Mutschke, H., & Dorschner, J. 1995, A&AS, 112, 143
- Henning & Mutschke (1997) Henning, Th. & Mutschke, H. 1997, A&A, 327, 743
- Henning et al. (1999) Henning, Th., Il’in, V. B., Krivova, N. A., Michel, B., & Voshchinnikov, N. V. 1999, A&AS, 136, 405
- Henning & Mutschke (2001) Henning, Th. & Mutschke, H. 2001, Spectrochimica Acta, A57, 815
- Higdon et al. (2004) Higdon, S. J. U. et al. 2004, PASP, 116, 975
- Higdon et al. (2006) Higdon, S. J., Higdon, J. L., & Marshall, J. 2006, ApJ, 640, 768
- Hill et al. (1997) Hill, H. G. M., D’Hendecourt, L. B., Perron, C., & Jones, A. P. 1997, Meteoritics and Planetary Science, 32, 713
- Hill et al. (1998) Hill, H. G. M., Jones, A. P., & D’Hendecourt, L. B. 1998, A&A, 336, L41
- Hony et al. (2002) Hony, S., Waters, L. B. F. M., & Tielens, A. G. G. M. 2002, A&A, 390, 533
- Houck et al. (2004) Houck, J. R. et al. 2004, ApJS, 154, 18
- Jäger et al. (1994) Jäger, C., Mutschke, H., Begemann, B., Dorschner, J., & Henning, Th. 1994, A&A, 292, 641
- Jura (2004) Jura, M. 2004, private communication
- Kemper et al. (2002) Kemper, F., Molster, F. J., Jäger, C., & Waters, L. B. F. M. 2002, A&A, 394, 679
- Koike et al. (1993) Koike, C., Shibai, H., & Tuchiyama, A. 1993, MNRAS, 264, 654
- Koike & Shibai (1994) Koike, C. & Shibai, H. 1994, MNRAS, 269, 1011
- Koike et al. (1995) Koike, C., Wickramasinghe, N. C., Kano, N., Yamakoshi, K., Yamamoto, T., Kaito, C., Kimura, S., & Okuda, H. 1995, MNRAS, 277, 986
- Koike et al. (2000) Koike, C. et al. 2000, A&A, 363, 1115
- Koike et al. (2003) Koike, C., Chihara, H., Tsuchiyama, A., Suto, H., Sogawa, H., & Okuda, H. 2003, A&A, 399, 1101
- Kraus et al. (1997) Kraus, G. F., Nuth, J. A. III, & Nelson, R. N. 1997, A&A, 328, 419
- Kwok et al. (1999) Kwok, S., Volk, K., & Hrivnak, B. J. 1999, A&A, 350, L99
- Lemaire et al. (1996) Lemaire, J. L., Field, D., Gerin, M., Leach, S., Pineau des Forêts, G., & Rouan, D. 1996, A&A, 308, 895
- Lewis et al. (1989) Lewis, R. S., Anders, E., & Draine, B. T. 1989, Nature, 339, 117
- Lu et al. (2005) Lu, A. J., Pan, B. C., & Han, J. G. 2005, Phys Rev B, 72, 035447-1
- Morris et al. (2004) Morris, P., Noriega-Crespo, A., Marleau, F., Teplitz, H., Uchida, K., & Armus, L. 2004, ApJS, 154, 339
- Moutou et al. (1996) Moutou, C., Léger, A., D’Hendecourt, L., & Maier, J. P. 1996, A&A, 310, 297
- Moutou et al. (1999) Moutou, C., Sellgren, K., Verstraete, L., & Léger, A. 1999, A&A, 347, 949
- Moutou et al. (2000) Moutou, C., Verstraete, L., Léger, A., Sellgren, K., & Schmidt, W. 2000, A&A, 354, L17
- Mutschke et al. (1995) Mutschke, H., Dorschner, J., Henning, T., Jager, C., & Ott, U. 1995, ApJ, 454, L157
- Mutschke et al. (1999) Mutschke, H., Andersen, A. C., Clément, D., Henning, Th., & Peiter, G. 1999, A&A, 345, 187
- Mutschke et al. (2004) Mutschke, H., Andersen, A. C., Jäger, C., Henning, T., & Braatz, A. 2004, A&A, 423, 983
- Nemes et al. (1994) Nemes, L., Ram, R. S., Bernath, P. F., Tinker, F. A., Zumwalt, M. C., Lamb, L. D., & Huffman, D. R. 1994, Chem Phys Lett, 218, 295
- Ogmen & Duley (1988) Ogmen, M., & Duley, W. W. 1988, ApJ, 334, L117
- Oomens et al. (2006) Oomens, J., et al. 2006, J Mol Sp, 238, 158
- Panuzzo et al. (2006) Panuzzo, P., et al. 2006, ArXiv Astrophysics e-prints, arXiv:astro-ph/0610316
- Peeters et al. (2004) Peeters, E., Mattioda, A. L., Hudgins, D. M., & Allamandola, L. J. 2004, ApJ, 617, L65
- Pirali (2006) Pirali, O. 2006, private communication
- Pogge (2004) Pogge, R. W. 2004, private communication
- Posch et al. (1999) Posch, T., Kerschbaum, F., Mutschke, H., Fabian, D., Dorschner, J., & Hron, J. 1999, A&A, 352, 609
- Rapacioli et al. (2005) Rapacioli, M., Joblin, C., & Boissel, P. 2005, A&A, 429, 193
- Skrutskie et al. (2006) Skrutskie, M. F., et al. 2006, AJ, 131, 1163
- Smith et al. (2004) Smith, J. D. et al. 2004, ApJS, 154, 199
- Smith et al. (2006) Smith, J. D. et al. 2006, ArXiv Astrophysics e-prints, arXiv:astro-ph/0610913
- Sturm et al. (2000) Sturm, E., Lutz, D., Tran, D., Feuchtgruber, H., Genzel, R., Kunze, D., Moorwood, A. F. M., & Thornley, M. D. 2000, A&A, 358, 481
- Tappe (2006) Tappe, A., Rho, J., & Reach, W. T. 2006, ArXiv Astrophysics e-prints, arXiv:astro-ph/0609133
- Uchida (2005) Uchida, K. I. 2005, private communication
- van den Ancker et al. (1997) van den Ancker, M. E., Thé, P. S., Tjin A Djie, H. R. E., Catala, C., de Winter, D., Blondel, P. F. C., & Waters, L. B. F. M. 1997, A&A, 324, L33
- Van Kerckhoven et al. (2000) Van Kerckhoven, C. et al. 2000, A&A, 357, 1013
- Van Kerckhoven et al. (2002) Van Kerckhoven, C., Tielens, A. G. G. M., & Waelkens, C. 2002, A&A, 384, 568
- Werner et al. (2004a) Werner, M. W., et al. 2004a, ApJS, 154, 1
- Werner et al. (2004b) Werner, M. W., et al. 2004b, ApJS, 154, 309 (Paper 1)
- Witt et al. (2006) Witt, A. N., Gordon, K. D., Vijh, U. P., Sell, P. H., Smith, T. L., & Xie, R.-H. 2006, ApJ, 636, 303