XMM-Newton observation of Mrk 110
Abstract
Context. We report on the first XMM-Newton observation of the bright Narrow-Line Seyfert 1 galaxy Mrk 110.
Aims. Our analysis is aimed to study the properties of the X-ray spectrum of Mrk 110 and compare them with those inferred from optical spectroscopy.
Methods. We make use of detailed timing and spectral analysis as well as high resolution X-ray spectroscopy with the XMM-Newton gratings.
Results. We find a narrow Fe K fluorescent line, a broad component ( km s-1) of the O VII triplet, either due to infall motions or gravitational redshift effects in the vicinity of the central black hole, a Comptonized accretion disc layer, and a strong starburst component.
Conclusions. We found that Mrk 110 has a complex X-ray spectrum, exhibiting relatively strong broadening of the O VII emission line, probably associated to X-ray emission from the Broad Line Region (BLR), which might be correlated with the optical gravitationally redshifted, asymmetric line profiles. Spectral fits including a Gaussian line or a discline give the same statistical significance. If the broad redshifted soft X-ray components are due to gravitational redshift effects, the distance of the line emitting regions ranges between about 0.2 and 1 light day with respect to the central black hole. In addition, the EPIC pn spectrum shows a double power-law and a strong starburst component. One power-law component exhibits a photon index slope of , while the second is much steeper with a power-law slope of . The second power-law is most probably due to thermal Comptonization of a hot electron layer above the accretion disc. Mrk 110 is another example of extragalactic sources showing Comptonization effects in the accretion disc and its properties are very similar to the Narrow-Line Seyfert 1 Galaxy Ton S 180.
Key Words.:
galaxies: active – galaxies: individual: Mrk 110 – galaxies: Seyfert – X-rays: galaxies1 Introduction
Narrow Line Seyfert 1 galaxies, identified by the unusual narrowness of their H lines, are believed to be powered by super-massive black holes (SMBH) of relatively small masses, with high accretion rates, possibly close to the Eddington limit (e.g. Pound et al. 1995; Boller et al. 1996, Tanaka, Boller and Gallo 2005). Furthermore, NLS1 have long been known to be characterized by extreme properties of their X-ray emission: a strong soft excess in the ROSAT soft band ( keV; Boller et al. 1996), unusually steep X-ray spectra in the hard X-ray band ( keV, Brandt 1997; Vaughan et al. 1999), very rapid and large variability (Leighly 1999, Boller 2002 et al.).
Recent XMM-Newton detailed spectral studies have revealed more unusual spectral properties, most notably in the form of sharp spectral drops above 7 keV, the most extreme examples are found in 1H (Boller et al. 2002) and in IRAS 13224–3809 (Boller et al. 2003a). These features are sharp (within the EPIC pn resolution of about 200 eV) and time-variable (Gallo et al. 2004). Detailed spectral modeling of these data so far have suggested that either partial covering (Boller et al. 2002, Tanaka et al. 2004; Gallo et al. 2004) or ionized reflection-dominated discs with light bending effects (Fabian et al. 2004; Miniutti et al. 2003) can explain the observed features in these objects as well as in other bright Seyfert galaxies. Within the partial covering model, variability is induced by rapid changes in the covering fraction of the absorbers. In the light bending model, instead, variability is essentially produced by a change of the distance of a compact source, emitting a power-law spectrum, to the central black hole.
Mrk 110 is a low-redshift () X-ray bright NLS1s. Studies of the kinematics in the central Broad Line Region (BLR) of Mrk 110 based on the variability of the Balmer and Helium (He I, He II) emission lines, indicated a connection between the BLR and the central accretion disc as well as gravitational redshift effects (Kollatschny 2004). From the detection of gravitational redshifted emission in the variable fraction of all broad optical emission lines in Mrk 110, a central black hole mass of is obtained.
Throughout this paper we use the following cosmological parameters: km s-1 Mpc-1, and . Error estimations for the XMM-Newton data analysis are given for the 90 per cent confidence range.
2 Observation and Data analysis
Mrk 110 was observed with XMM-Newton slightly off-axis () for ks on 2004 November 15 (revolution 0904). During this time the EPIC pn (Strüder et al. 2001) and the MOS1 and MOS2 (Turner et al. 2001) cameras, as well as the Optical Monitor OM (Mason et al. 2001) and the Reflection Grating Spectrometers (RGS1 and RGS2) collected data. The EPIC-PN and MOS1 cameras were operated in small window mode to reduce the pile-up, given the brightness of this source (a few counts ), and utilized the thin filter. The MOS2 camera was operated in full-frame mode, utilizing the medium filter.
The Observation Data Files were processed to produce calibrated event lists using the XMM-Newton Science Analysis System (SAS v6.5.0). Unwanted hot, dead, or flickering pixels were removed as were events due to electronic noise. Event energies were corrected for charge-transfer losses, and EPIC response matrices were generated using the SAS tasks ARFGEN and RMFGEN. Light curves were extracted from these event lists to search for periods of high background flaring. We cut time intervals with count rates higher than 1.0 and 0.35 counts s-1 for the PN and MOS1, respectively. The total good exposure times selected for the PN and MOS1 were and ks, respectively.
The source photons were extracted from a circular region with a radius of , centered at the nominal source position. Since the PN and MOS1 were operated in the small window mode, we made use of the blank field background files taken from the XMM-SOC111ftp://xmm.vilspa.esa.es/pub/ccf/constituents/extras/background/. Single and double events were selected for the PN detector, and single-quadruple events were selected for the MOS. The resulting PHA files were grouped with a minimum of 20 counts per bin. Pile-up effects were determined to be negligible for the PN, but not for the MOS, given the brightness of the source ( counts s-1, the threshold for a 1% pile-up being 0.70 counts in the full-frame mode and 5.0 counts in the small-window mode). Therefore the MOS data were excluded from the analysis presented in this paper.
The RGS were operated in standard Spectro+Q mode. The first- and second-order RGS spectra were extracted, both for RGS1 and RGS2, using the SAS task rgsproc, and the response matrices were generated using rgsrmfgen.
The OM was operated in imaging mode for the entire observation. images were taken in three filters: in ( nm), in ( nm), and in ( nm). We will not discuss the OM data in this paper.
3 Timing properties
During the observation the source flux varied by less than 15% both in the soft ( keV) and hard ( keV) band, with no significant spectral variations, as shown from the hardness ratio (see Fig. 1). Therefore our spectral analysis is performed on the spectrum integrated over the whole good exposure time.

4 Broad band spectral complexity
The EPIC-pn spectrum of Mrk 110 has a relatively high signal-to-noise ratio (S/N) up to high energies. The spectrum of the source is clearly detected above the background up to keV (at less than 11 keV the source count rate is still above the background as shown in Fig. 2).
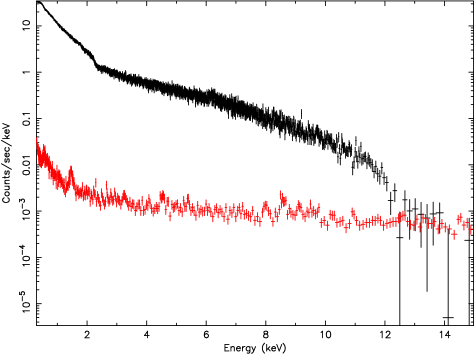

If the EPIC-pn broad band ( keV) spectrum was first fitted with a simple power law. The result is a statistically very poor fit ( for 1732 d.o.f..). This is indicative for strong spectral complexity. Strong soft X-ray excess emission is usually expected as well as steep hard photon indices (sometimes sharp spectral drops above 7 keV, (Boller et al. 2002, 2003a, Gallo et al. 2004, Tanaka, Boller, Gallo 2005)). In the following we examine these spectral parameters to provide an acceptable spectral fit and to reveal the underlying physical processes.
4.1 The baseline model: Comptonized accretion disc and collisionally ionized plasma emission
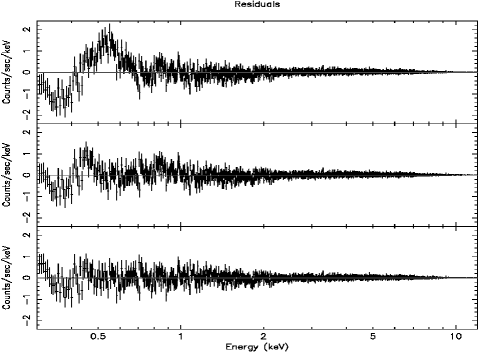

We have fitted the EPIC pn data with two power-law models and a narrow unresolved Fe K line. The foreground absorption value is always fixed to the Galactic value of . The residua are shown in the upper panel of Fig. 4. While the energy band above 1 keV is well fitted with these components, strong deviations are apparent between 0.3 and 1.0 keV. The value is 2151.3 for 1730 d.o.f., resulting in a reduced value of 1.24. A strong excess is found between about 0.45 and 0.7 keV in the observers frame as well as a significant underestimation of the data below 0.45 keV. From the detailed analysis of the RGS grating data, presented in Sect. 5, the presence of a significant, broad and redshifted emission line, most probably associated with the O VII triplet, has been revealed (the significance of the broad line is above the limit). Also an indication for the presence of a broad O VIII line is found (between the 2 and 3 limit). In order to take into account the presence of the broad O VII and O VIII lines detected with the RGS we have added two Gaussian lines with the energies as detected with the RGS gratings and fixing the line widths in the fit. This significantly improves the fit (the value is 1858.6 for 1728 d.o.f., resulting into a reduced value of 1.08; upper middle panel of Fig. 4). Between 0.5 keV and 0.8 keV the model is now consistent with the data. However, strong deviations remain below 0.5 keV and between about 0.7 and 1 keV (c.f. Fig. 4 upper middle panel). To account for these residua we have added two model components. Firstly, for observations in the small window mode it is known that calibration uncertainties occur between 0.4 and 0.5 keV (XMM-SOC-CAL-TN_0052 (2006)). The deviations reach 10% of the flux in this energy range. To account for this calibration uncertainties we have added a Gaussian line and leaving the energy free in the band between 0.4 and 0.5 keV. The corresponding line width is also a free parameter. Secondly, we have added a collisionally ionized plasma emission to the model (strong starburst emission is expected in NLS1s; Mathur 2000). The value is 44 for 2 d.o.f. This improves the fit above the 3 limit. The presence of the starburst component is further supported by the detection of an excess emission between about 0.7 and 1.0 keV in the EPIC pn count rate spectrum and the identification of emissions lines probably associated with Ne IX, Fe XVII and O VIII (Ly- and Ly-) between 0.7 and 1.0 keV in the observers frame (see also Fig. 5). The best fitting model we obtained has a reduced value of 1.02 for 1723 d.o.f. (Fig. 4, lower panel). The value for the photon indices of the power-law components are and , respectively. The flat power-law component is quite consistent with the canonical slope found in broad-line Seyfert 1 Galaxies and is assumed to arise via inverse Compton scattering of accretion disc photons in the hot accretion disc corona. The steeper power-law component is most probably due to inverse Compton scattering of accretion disc photons on a hot electron layer above the accretion disc (see below for further details). The temperature of the plasma emission is keV. This is consistent with the lowest temperature component found in ULRIGs (e.g. NGC 6240, Boller et al. 2003) and in starburst galaxies (e.g. NGC 253; Pietsch et al. 2001). The abundance remains unconstrained and was therefore fixed to solar metallicities.
To achieve a more physical understanding of the origin of the steep power-law photon index, we have replaced the simple power-law component with the compTT model in XSPEC (the soft excess is modeled by Comptonization of a thermal spectrum from the accretion disc). The statistical significance of the two models is the same. The temperature of the thermal spectrum is eV. The values for the temperature of the hot electron layer and the optical depth are kT = keV and . The resulting value is 0.9 for a photon index of 2.5. To our knowledge no other physical mechanisms, apart from disc comptonization, are able to produce the steep power-law spectral component. Miniutti, Fabian and Goyder et al. (2003) have proposed the presence of a compact source above the accretion disc (the reflection model) emitting a power-law continuum. However, the physical interpretation of the power-law component is not discussed.
A narrow unresolved Fe K line is detected at an energy of with an equivalent width of eV. The line width remains unresolved within the energy resolution of the EPIC pn detector.
The absorption corrected flux value in the 0.3 to 11 keV band is . The corresponding luminosity is .
Disc comptonization have been discussed for other sources. The NLS1 Ton S 180 can also be modeled with two power-law components (Vaughan, Boller and Fabian et al. 2002). The electron temperatures are quite similar to that of Mrk 110. Other sources are Mrk 335 (Gondoin, Orr, Lumb et al. 2002) or PKS 0558–504 (Brinkmann, Arevalo, Gliozzi et al. 2004).
4.2 Testing other models
As almost all NLS1s do show multicolour disc emission (MCD emission), we have modeled the spectral energy distribution of Mrk 110 with a black body component, an underlying power-law and a narrow unresolved Fe K line. Although the black body temperature-, power-law-, and Fe K line parameters are constrained, the fit is statistically not acceptable ( for 1730 d.o.f.), resulting into a reduced value of 1.42. Strong residua are apparent at energies greater than 5 keV. We conclude, that a simple thermal emission from the accretion disc is not consistent with the spectral energy distribution between 0.3 and 11 keV. When replacing the black body component with an optically thin emission component (using the apec model in XSPEC for a collisionally ionized plasma), the spectrum can also not be fitted with the required statistical significance ( for 1730 d.o.f.). Also a combined black body plus apec model does not give an adequate spectral model to the EPIC pn spectrum of Mrk 110 ( for 1728 d.o.f.).
Ionized reflection may also account for the soft X-ray excess. We have modeled the EPIC pn spectrum of Mrk 110 with ionized reflection code reflion within XSPEC. The best fitting model gives a rather poor fit to the data (). In addition, the ionization parameter appears to be unphysically high (). We have tried a second ionizing reflection component and found that it is not required by the EPIC pn data. Even freezing the model parameters from the single reflection component does not result in a better fit as the model parameters of the second component remain unconstrained. We therefore conclude, that ionized reflection from the disc is most probably not the underlying physical model for the XMM-Newton X-ray spectrum of Mrk 110.
Finally we have tested whether a combination of thermal and nonthermal Comptonization of an accretion disc layer can account for the observations using the eqpair code from Copi (1992). The model describes a single plasma emission with a hybrid thermal, non-thermal electron distribution and was successfully applied to the NLS1 Ton S 180 (Vaughan et al. 2002). We tried to apply this model to the data as a successful fit would give important information on the non-thermal electron distribution, e.g. the soft compactness parameter, the non-thermal compactness, or the non-thermal injection of relativistic electrons. Applying the hybrid comptonized plasma layer to the Mrk 110 data, again no statistically acceptable fit could be obtained.
5 Relativistically broadened optical and X-ray lines?
5.1 Spectral analysis of the RGS
| Line | Elab (eV) | E (eV) | (eV) | Flux | EW (eV) | ||
|---|---|---|---|---|---|---|---|
| O VIII Ly- | 24.2 | 0.999 | |||||
| O VIII broad | 6.8 | 0.985 | |||||
| O VII 1s-2p (r) | 9.5 | 0.992 | |||||
| O VII 1s-2p (i) | 8.0 | 0.987 | |||||
| O VII 1s-2p (f) | 7.1 | 0.978 | |||||
| O VII broad | 165 | 0.999 | |||||
| N VII Ly- | 1.7 | 0.605 | |||||
| N VII broad | 16.6 | 0.995 | |||||
| C VI Ly- | 3.2 | 0.802 | |||||
| C VI broad | 14.5 | 0.994 |
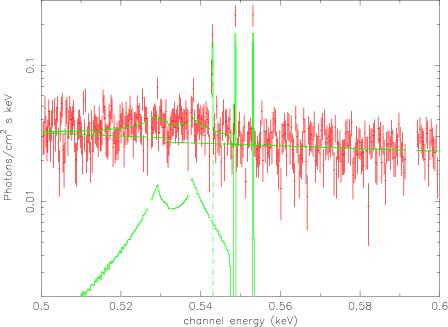
The EPIC spectrum shows a broad feature at about keV (redshifted with respect to the mean energy of the O VII triplet). To study the soft X-ray spectra in more detail, we examined the simultaneous XMM-Newton gratings data of Mrk 110. Fig. 5 shows the smoothed fluxed spectrum, resulting from the sum of the two orders of RGS1 and RGS2. We analyzed simultaneously the binned RGS1 and RGS2 data with XSPEC. Here we present measurements of the strongest emission lines showing complex profiles, that are the Oxygen triplet (O VII recombination (r), intercombination (i) and forbidden (f) lines at , and eV, respectively), the Ly- lines of O VIII at eV, N VII at eV and C VI at eV. These narrow lines are unresolved and neither red- or blueshifted given the present data quality. The most significant narrow line features are the O VII triplet and fluorescence O VIII line. The N VII and C VI line emission features are below the the limit. For the narrow O VII triplet we deduce a R factor of . According to Porquet and Duban (2000) this corresponds to densities ranging from about . A detailed modeling of the complete RGS spectrum, including a simultaneous treatment of absorption and emission lines, is beyond the scope of this paper, and it will be treated elsewhere.

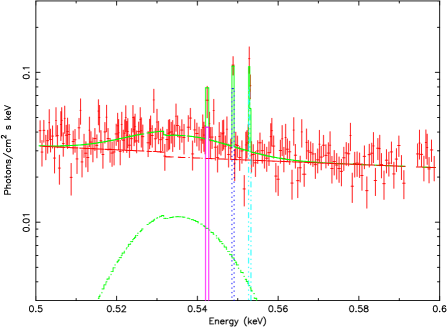
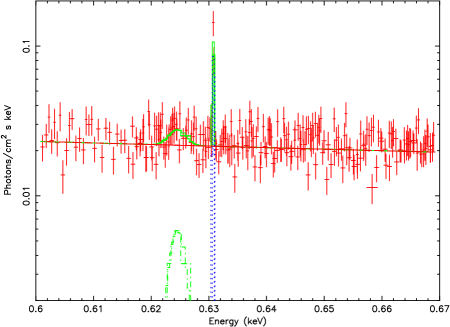
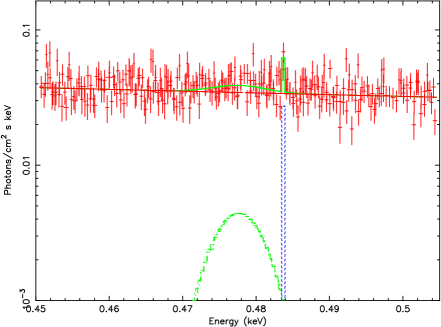
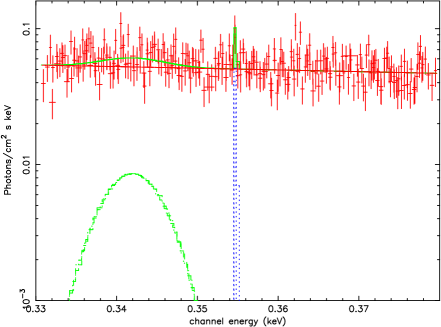
Interestingly, we found a broad line component around the O VII triplet (c.f. Fig. 6, left upper panel, dashed line) required by the data (the significance is above the limit). The redshift is 0.023 and the FWHM of the broad component is about . We caution, however, that the broad O VII component is related to a triplet and, therefore, gives an overestimate of the line width due to the superposition of the three broadned O VII lines. We treat this value of the line width as an upper limit. The mean rest energy of the line depends on the relative fluxes of the triplet, which in turn depend on the density of the emission region. Unfortunately we are unable to constrain the triplet line ratios or the density with the present data quality, therefore we assume a representative ratio of the recombination (r), intercombination (i) and forbidden (f) lines. Assuming that the displacement of the broad line it is due to gravitational redshift effects ( following Müller and Wold (A&A, 2006)), we would infer a distance of about 30 of the line emitting region to the central black hole . The presence of relativistically broadened soft X-ray lines in MCG-6-30-15 or in Mrk 766 have already been discussed by Branduardi-Raymont et al. (2001), Mason et al. (2003) or Sako et al. (2003). Ogle et al. (2004) reported on the discovery of a relativistically broadened O VIII line in NGC 4051. The XMM-Newton observation of Mrk 110 shows indications for broad redshifted components also for the O VIII, N VII and C VI lines with significance levels between 2 and 3 . Presently, we cannot decide whether the redshift of the broad component, associated with the O VII triplet, is due to gravitational redshift effects or to infall motions towards the central black hole.
5.2 Comparison with optical data
The optical spectra of Mrk 110 were studied in great detail by Kollatschny (2003a, 2003b and 2004). Kollatschny (2003b) investigated the variable broad line components of the , , , and lines. The shifts between the rms profile and the mean line profiles were measured and the differential shifts were interpreted as gravitational redshift effects. In addition, the cross-correlation lags were calculated from reverberation measurements. In Fig. 3 of Kollatschny (2003b) a relation between the redshift of the rms profiles (in terms of velocity shifts) as a function of distance of the rms line emitting regions is found. Using the relation of Zheng and Sulentic (1990) (, where ) a gravitational black hole mass of is determined. From the narrow optical lines gravitational redshift values of 0.00025 (H), 0.00039 (H), 0.00062 (He I), and 0.00183 (He II) are obtained. As an example, the distance of the optical line emitting regions based on He II measurements from the central black hole originates at a distance of 3.9 light-days, corresponding to 230 Schwarzschild radii. To avoid confusion, we would like to remind the reader that in NLS1s the broad lines are relatively narrow, and that the gravitational reshift values mentioned above are measured for the BLR.
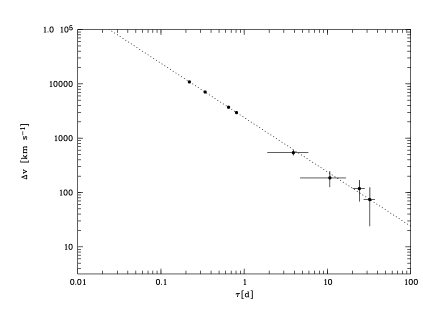
Under the assumption that the broad redshifted soft X-ray lines are due to gravitational redshift effects, we extrapolate the velocity shift into the soft X-ray regime (Fig. 7). If longer X-ray observations will confirm the presence of relativistic effects for soft X-ray lines, Fig. 7 could be used to test our prediction on the distance of the four soft X-ray lines to the central black hole.
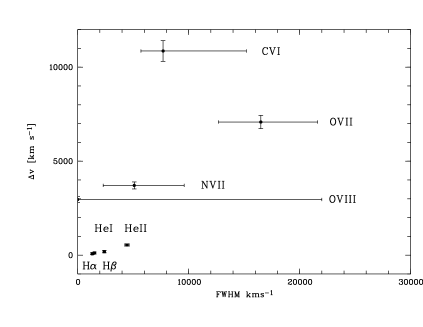
Following Kollatschny (2003b, his Fig. 2) we have plotted in Fig. 8 the velocity shift values and the FWHM for the broad soft X-ray lines in addition to the optical measurements. With the present data quality we cannot disentangle between gravitational redshift effects or infall motions.
If the lines are optically thin one expects to see redshifted double peaked profiles due to relativistic beaming and gravitational redshift effects. Therefore, we have fitted the RGS data with a discline profile for the broad redshifted O VII component (c.f. Fig. 9). The statistical significance of the fit is equivalent to the fit with a broad Gaussian. The best-fit parameters for the discline model are as follows: degrees. The value of is 1.084 for 333 d.o.f.
Another approach is to model the broad component by fixing the restframe line energy and assuming the line is broadened by gravitational redshift and Doppler effects in a Keplerian disc. In this way we obtain that all the emission should come from the innermost region () and the emissitity of the disk needs to be extremly steep () which appears unlikely. However this could be still consistent with emission from the BLR. The value of is 1.080 for 334 d.o.f.
With the present data quality we cannot disentangle between gravitational redshift effects or just infall motions at soft X-rays. However, all of the putative broad components are also redshifted with respect to the narrow emission line energies. The narrow X-ray lines from these elements remain unresolved and the presence of a double peaked profile remains speculative.
6 Discussion and conclusions
We have analyzed the XMM-Newton spectra of Mrk 110. The EPIC pn spectrum revealed the presence of a Comptonized accretion disc layer and the presence of a starburst component. Ionized disc models, optically thick emission from the disc and hybrid thermal/non-thermal emission models appear to be ruled out by the data. Mrk 110 is another active galaxy showing a Comptonized accretion disc layer. The optical data from Mrk 110 show asymmetric line profiles which are interpreted as gravitational redshift effects from the central black hole. We find broad X-ray line emission features associated with the BLR, e.g. the broad component of the O VII triplet has a FWHM of km s-1. The RGS data show in addition to the narrow unresolved components a broad redshifted O VII line. The widths of the broad O VII line is giving a clear indication that this line originates from the BLR. With the present data quality we cannot disentangle between gravitational redshift effects for the X-ray lines or infall bulk motion towards the central black hole. Spectral fits to the redshifted O VII line with a Gaussian profile or a discline profile yield the same statistical significance. Indications for broad redshifted X-ray lines are also found for O VIII, N VII and C VI. The significance of these lines is below the limit. Longer X-ray observations or future missions are required to distinguish between broad Gaussian lines or gravitationally distorted line profiles in the soft X-ray regime.
Acknowledgements.
Based on observations obtained with XMM-Newton, an ESA science mission with instruments and contributions directly funded by ESA Member States and the USA (NASA). We thank the anonymous referee for very helpful comments to improve the paper.References
- (1) Boller Th., Brandt W.N., and Fink H., 1996, A&A 309, 431
- (2) Boller Th., Fabian, A.C., Sunyaev R.A., Trümper J., Vaughan S., Ballantyne D.R., Brandt W.N., Keil R., Iwasawa K., 2002, MNRAS 329, 1
- (3) Boller Th., Tanaka Y., Fabian A.C., Brandt W.N., Gallo L., Anabuki N., Haba Y., Vaughan S., 2003a, MNRAS 343, 89
- (4) Boller Th., Keil R., Hasinger, G., Costantini E., Fujimoto R., Anabuki N., Lehmann L., Gallo L., 2003b, A&A 411, 63 NGC 6240
- (5) Brandt W.N., Mathur S., Elvis, M., 1997, MNRAS 285, 25
- (6) Branduardi-Raymont G., et al. 2001, A&A, 365, 140
- (7) Brinkmann W., Arevalo P., Gliozzi M., Ferero E., 2004, A&A 415, 959
- (8) ESA Vilspa TN 52, 2006, xmm.vislpa.esa.es/documents/CAL-TN-0052-3-0.ps.gz
- (9) Fabian A.C., Miniutti G., Gallo L., Boller Th., Tanaka Y., Vaughan S., Ross R.R., 2004, MNRAS 353, 1071
- (10) Fabian A.C., Miniutti G., Iwasawa K., Ross R.R., 2005, MNRAS 361, 1197
- (11) Gallo L., Tanaka Y., Boller Th., Fabian A.C., Vaughan S., Brandt W.N., 2004, MNRAS 353, 1064
- (12) Gondoin P., Orr A., Lumb D., Santos-Lleo M., 2002, A&A 388, 74
- (13) Kollatschny W., Bischoff K., Robinson E.L., Welsh W.F., Hill, G.J., 2001 A&A 379, 125
- (14) Kollatschny W., 2003a, A&A , 407, 461
- (15) Kollatschny W., 2003b, A&A , 412, 61
- (16) Kollatschny W., 2004, IAUS, 222, 105
- (17) Leighly K., 1999, ApJS 125, 317
- (18) Mason K.O., Breeveld A., Much R., Carter M., et al., 2001 A&A 365, 36
- (19) Mason K.O. et al. 2003, ApJ 582, 95
- (20) Mathur S., New Astronomy Reviews, 2000, 44, 469
- (21) Miniutti G., Fabian A.C., Goyder R., Lasenby A.N., 2003, MNRAS 344, 22
- (22) Müller A., Wold M., 2006, A&A 457, 485
- (23) Ogle P. M., Mason, K. O., Page, M. J., Salvi, N. J., Cordova, F. A., McHardy, I. M., Priedhorsky, W. C., 2004, ApJ 606, 1510
- (24) Pietsch W., Roberts T.P., Sako M., Freyberg M.J., Read A.M., Borozdin K.N., Branduardi-Raymont G., Cappi M., Ehle M., Ferrando P., 2001, A&A 354, 174
- (25) Porquet D., Duban J., 2000, A&AS 143, 495
- (26) Sako M. et al., 2003, ApJ 596, 114
- (27) Strüder L., Briel U., Dennerl K., Hartmann R. et al., 2001, A&A 365, 18
- (28) Tanaka Y., Boller Th., Gallo L., Keil R., Ueda Y., 2004, PASJ 56, 9
- (29) Tanaka Y., Boller Th., Gallo L., 2005, In: Growing Black hole. Proceedings of the MPA, ESO, MPE, USM Joint Astronomy Conference held at Garching, Eds. A. Berloni, S. Nayakshin, R.A. Sunyaev, ISBN 3-540-25275-7
- (30) Turner M.J.L., Abbey A., Arnaud M., Balasini M., et al., 2001, A&A 365, 27
- (31) Vaughan S., Reeves J., Warwick R., Edelson R., 1999, MNRAS 309, 113
- (32) Vaughan S., Boller Th., Fabian A.C., Ballantyne D.R., Brandt W.N., Trümper J., 2002, MNRAS 337, 247
- (33) Zheng W., Sulentic J.W., 1990, ApJ 350, 512