Unification Issues and the AGN Torus
Abstract
Observations give strong support for the unification scheme of active galactic nuclei. Clumpiness of the toroidal obscuration is crucial for explaining the IR observations and has significance consequences for AGN classification: type 1 and type 2 viewing is an angle-dependent probability, not an absolute property. The broad line region (BLR) and the dusty torus are, respectively, the inner and outer segments, across the dust sublimation radius, of a continuous cloud distribution. Continuum X-ray obscuration comes mostly from the inner, BLR clouds. All clouds are embedded in a disk wind, whose mass outflow rate is diminishing as the accretion rate, i.e., AGN luminosity, is decreasing. The torus disappears when erg s-1, the BLR at some lower, yet to be determined luminosities.
Physics & Astronomy Dept.
University of Kentucky
Lexington, KY 40506-0055
USA
1. Introduction
The basic premise of the unification scheme is that every AGN is intrinsically the same object: an accreting supermassive black hole. This central engine is surrounded by a dusty toroidal structure so that the observed diversity simply reflects different viewing angles of an axisymmetric geometry. Since the torus provides anisotropic obscuration of the center, sources viewed face-on are recognized as “type 1”, those observed edge-on are “type 2”.
A scientific theory must make falsifiable predictions, and AGN unification does meet this criterion. Unification implies that for every class of type 1 objects there is a corresponding type 2 class, therefore the theory predicts that type 2 QSO must exist. After many years of searching, QSO2 have been discovered, thanks to the Sloan Digital Sky Survey. Furthermore, spectropolarimetry of type 2 quasars even reveals the hidden type 1 nuclei at as large as 0.6 (Zakamska et al 2005). This is a spectacular success of the unification approach. There are not that many cases in astronomy — in fact, in all of science — where a new type of object has been predicted to exist and then actually discovered.
In light of this success, it would be hard to question the basic validity of the unification approach. There is no reason, though, why the obscuring torus should be the same in every AGN; it is unrealistic to expect AGN’s to differ only in their overall luminosity but be identical in all other aspects. Here I summarize the properties of the obscuring torus and try to speculate on how it might evolve with the AGN luminosity, i.e., its accretion rate.
2. IR Emission
Obscuring dust must re-radiate the absorbed radiation at longer wavelengths. Indeed, type 1 AGN display at short wavelengths (X-rays through optical) the power law spectrum characteristic of accretion disks and at 1m an IR bump, which can be attributed to reprocessing by the torus dust (Barvainins 1987); a striking example is provided by the recent observations of Mrk 1239 (Rodríguez-Ardila & Mazzalay 2006). In contrast, type 2 sources display only the IR emission, as expected. The SED’s do conform to the unification prediction: type 1 = type 2 + AGN.
IR observations also bring puzzles. The 10 m torus emission in NGC1068 was recently resolved in VLTI interferometry by Jaffe et al (2004). They analyzed their observations with a model that contains a compact ( 0.5 pc) hot ( 800 K) core and cooler (320 K) dust extending to 1.7 pc. Poncelet et al (2006) reanalyzed the same data with slightly different assumptions and reached similar conclusions — the coolest component in their model has an average temperature of 226 K and extends to = 2.7 pc. As noted by the latter authors, the presence of dust temperatures of only 200–300 K so close to the AGN is a most puzzling, fundamental problem. The bolometric luminosity of NGC1068 is 2 erg s-1 (Mason et al 2006), therefore the dust temperature expected at = 2 pc is 960 K, much higher than those found by the observations; = 320 K is expected only at = 26 pc, not the 1.7 pc that Jaffe et al find, and = 226 K should be still further out at = 57 pc, not the 2.7 pc that Poncelet et al find.
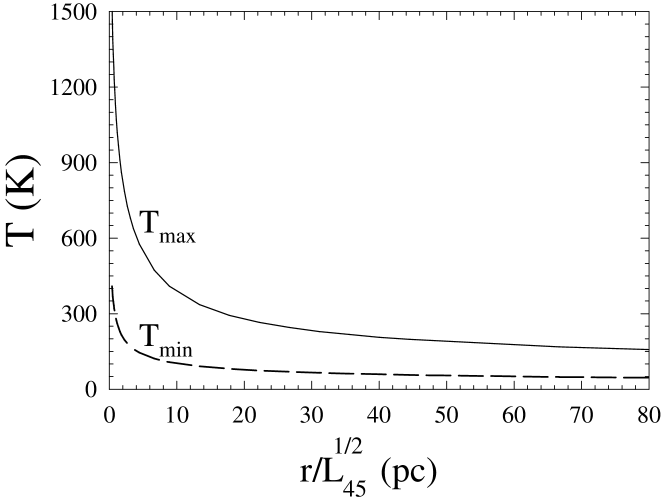
These discrepancies are resolved when we recall that the torus is comprised of dusty clouds, which are individually optically thick (Krolik & Begelman 1988). The temperature of an optically thick dusty cloud is much higher on the side illuminated by the AGN than on the opposite, dark side (Nenkova et al 2002). Figure 1 displays the variation of the surface temperatures on the bright side () and dark side () of an optically thick cloud with distance from the AGN. While the dust temperature on the bright sides of clouds at 2 pc from the center of NGC1068 is 950 K, the temperature on their dark sides is only 250 K, declining to 210 K at 3 pc. Indeed, the temperatures deduced in the model synthesis of the VLTI data fall inside the range covered by the cloud surface temperatures at the derived distances.
Another puzzle is the apparent similarity between the IR emission from type 1 and type 2 sources: the torus obscuration is highly anisotropic (which is the essence of unification), yet its emission seems to be nearly isotropic. This was first noted by Lutz et al (2004). They compared the 6 m emission of Seyfert 1 and 2 galaxies normalized to the intrinsic hard X-ray emission, and concluded that the distributions of the two populations are essentially identical within the observational errors. Horst et al (2006) used the same approach for the 12 m emission and reached similar conclusions. Buchanan et al (2006) conducted Spitzer observations of 87 Seyfert galaxies in the = 5–35 m range and normalized the IR fluxes with the optically thin radio emission, which is free from the large corrections required to determine the intrinsic X-ray flux densities from the observed ones. Although at 6 m they find a larger variation than Lutz et al, they find that the emission from Seyfert 1 and 2 galaxies are within factor 2 of each other for all 15 m. The authors of all these studies note the problems the observations pose to smooth-density torus models, which predict a highly anisotropic torus emission.
This problem, too, is solved by the torus clumpiness. Nenkova et al (2006) performed detailed radiative transfer calculations for the emission from a clumpy torus in which each cloud is characterized by , its optical depth at visual. The cloud distribution starts at the dust sublimation radius, and the number of clouds encountered on average along radial equatorial rays is . The cloud angular distribution is parametrized as Gaussian with width parameter , the radial distribution as an inverse power law with index ; that is, the number of clouds per unit length as a function of radial distance and angle from the equatorial plane is111The proportionality constant is determined from
| (1) |
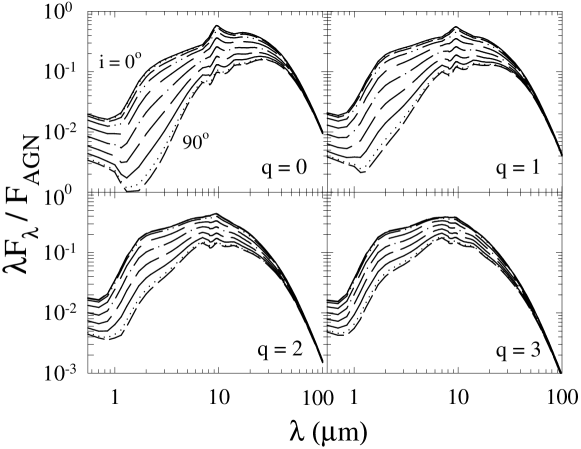
Figure 2 shows sample SED’s for models in which all the parameters are the same except for , the index of the power-law radial distribution. At any viewing angle, the AGN obscuration is identical for all these models since obscuration depends only on the total number of clouds along the radial ray, which is the same in all cases. Because of the Gaussian angular distribution, the obscuration is highly anisotropic, decreasing by two orders of magnitudes between polar and equatorial viewing. However, the variation of SED with viewing angle is quite moderate and the emission becomes progressively more isotropic as increases (the radial distribution gets steeper). A clumpy torus can produce extremely anisotropic obscuration of the AGN together with nearly isotropic IR emission, as observed. In particular, the mild anisotropy of the = 2 models is compatible with that found by Buchanan et al.
All in all, clumpy torus models (Nenkova et al 2002, 2006) seem to produce SED’s that are in reasonable overall agreement with observations for the following range of parameters:
-
•
Number of clouds, on average, along radial equatorial rays = 5–10
-
•
Angular width = 30∘–60∘
-
•
Index of power law radial distribution = 1–2
-
•
Optical depth, at visual, of each cloud = 40–120
-
•
Torus extends from dust sublimation at = 0.4 pc to an outer radius 5
There is increasing evidence that the torus is quite compact (see Elitzur 2006 and references therein). All observations are consistent with / being no larger than 20–30, and perhaps even only 5–10. It is especially significant that, thanks to the low temperatures on the dark sides of nearby clouds, models of clumpy tori can produce sufficient IR emission with dimensions that are rather compact.
While the above listed parameters lead to SED’s compatible with observations, some additional considerations can further restrict the acceptable range. For example, the near-isotropy of IR emission indicates that = 2 may provide a more appropriate description of the radial distribution than = 1. Finally, all model calculations were performed with standard Galactic ISM dust, which seems to provide satisfactory results. Current data do not provide any compelling reason for drastic changes in the dust composition.
3. Clumpy Unification
The classification of AGN into types 1 and 2 is based on the extent to which the nuclear region is visible. In its standard formulation, the unification approach posits the viewing angle as the sole factor in determining the AGN type. This is indeed the case for a smooth-density torus that is optically thick within the angular width (figure 3, left sketch). All AGN viewed at then appear as type 1 sources, while viewing at gives type 2 appearance. If denotes the fraction of type 2 sources in the total population, then . From statistics of Seyfert galaxies Schmitt et al (2001) find that 70%, hence their estimate 45∘. The issue is currently unsettled because Hao at al (2005) have found recently that is only about 50%, or 30∘.
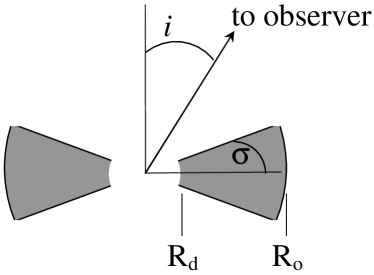
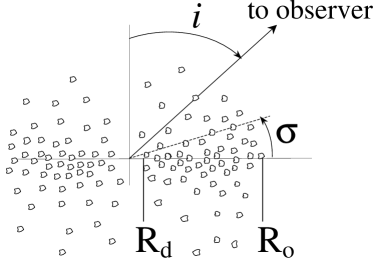
Because of clumpiness, the difference between types 1 and 2 is not truly an issue of orientation but of probability for direct view of the AGN (figure 3, right sketch); AGN type is a viewing-dependent probability. Since that probability is always finite, type 1 sources can be detected from what are typically considered type 2 orientations, even through the torus equatorial plane: if = 5, for example, the probability for that is on average. This might offer an explanation for the few Seyfert galaxies reported by Alonso-Herrero et al (2003) to show type 1 optical line spectra together with 0.4–16 m SED that resemble type 2. Conversely, if a cloud happens to obscure the AGN from an observer, that object would be classified as type 2 irrespective of the viewing angle. In cases of such single cloud obscuration, on occasion the cloud may move out of the line-of-sight, creating a clear path to the nucleus and a transition to type 1 spectrum. Such transitions between type 1 and type 2 line spectra have been observed in a few sources (see Aretxaga et al 1999, and references therein). It is worth while to conduct monitoring observations in an attempt to detect additional such transitions. The most promising candidates would be obscured systems with relatively small X-ray obscuring columns, small torus sizes and large black-hole masses (Nenkova et al 2006).
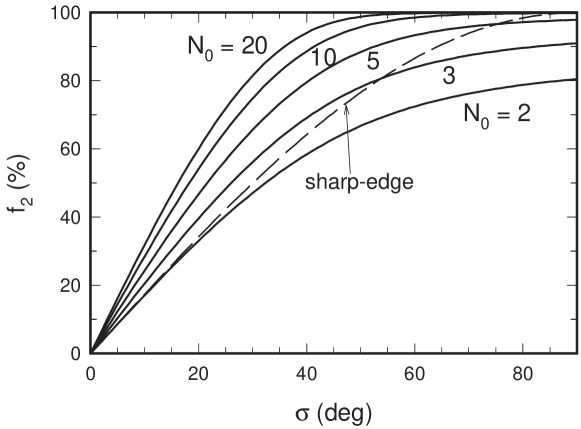
A sharp-edge clumpy torus has , and is practically indistinguishable from its smooth-density counterpart when exceeds 3–4. However, the situation changes fundamentally for soft-edge distributions because at every viewing angle, the probability of obscuration increases with the number of clouds. As is evident from figure 4, the Gaussian distribution produces a strong dependence on and significant differences from the sharp-edge case. Since the sharp-edge angular distribution is ruled out by observations (Nenkova et al 2006), the fraction of obscured sources depends not only on the torus angular width but also on the average number of clouds along radial rays. While the fraction requires in the smooth-density case, it implies in a Gaussian clumpy torus with = 5 clouds.
There are indications that the fraction of obscured sources decreases with luminosity (Hao et al 2005; Simpson 2005), although counter claims exist too (see talk by Junxian Wang, these proceedings). The possible decrease of with has been interpreted as support for the “receding torus” model, in which decreases with (Simpson 2005 and references therein). However, all the quantitative analyses performed thus far for the -dependence of were based on sharp-edge angular obscuration. Removing this assumption affects profoundly the foundation of the receding torus model because the dependence on the number of clouds necessitates analysis with two free parameters, therefore cannot be determined without . A decrease of with at constant will also produce a decrease in , the same effect as a decrease of (figure 4). An observed trend of with may arise from a dependence on either or or both. There is no obvious a-priori means for deciding between the various possibilities.
4. X-rays and Unification
X-ray observations give overwhelming evidence for the orientation-dependent absorption and reprocessing expected from AGN unification (see talk by R. Maiolino, these proceedings). But in spite of the close correspondence between the two, the “X-ray torus” probably does not coincide with the “dusty torus”. The decisive evidence comes from the short time scales for transit of X-ray absorbing clouds across the line of sight, which establish the clouds location inside the dust sublimation radius. A recent extreme case is the two-day flips between Compton thick ( cm-2) and thin X-ray absorption in NGC 1365 (G. Risaliti, these proceedings). These observations show that the torus extends inward of the dust sublimation point to some inner radius . Clouds at partake in X-ray absorption but do not contribute appreciably to optical obscuration or IR emission because they are dust-free. The bulk of the X-ray absorption likely comes in most cases from the clouds in the dust-free inner portion of the torus. The columns for X-ray absorption exceed those for UV absorption (Maiolino et al 2001), showing that the inner radial segments contain more clouds than the outer segments at . This is the expected behavior in the steep distribution, where most of the clouds are concentrated toward the center. All observations are consistent with 0.1 and roughly 10 dust-free X-ray absorbing clouds for every dusty cloud, therefore the fraction of absorbed sources should be higher in X-rays than in UV/optical. This explains the discovery of type 1 QSO that show Compton thick X-ray absorption but no UV absorption (Gallagher et al 2006; see also talk by S. Gallagher, these proceedings).
5. What is the Torus?
In the ubiquitous sketch by Urry & Padovani (1995), the AGN central region, which is comprised of the black hole, its accretion disk and the broad-line emitting clouds, is surrounded by a large doughnut-like structure — the torus. This hydrostatic object is a separate entity, presumably populated by molecular clouds accreted from the galaxy. Gravity controls the orbital motions of the clouds, but the origin of vertical motions capable of sustaining the “doughnut” as a steady-state, hydrostatic structure whose hight is comparable to its radius (for 45∘) was recognized as a problem since the first theoretical study by Krolik & Begelman (1988). This problem has eluded solution to this date.
Two different types of observations now show that the torus is in fact a smooth continuation of the broad lines region, not a separate entity. The first evidence comes from the IR reverberation results of Suganuma et al (2006). They show that the dust sublimation radius scales with luminosity as , as expected. More importantly, the sizes of broad line emission regions scale similarly as and in each source for which both data exist, the IR time lag is the upper bound on all time lags measured in the broad lines; that is, the BLR extends all the way to the inner boundary of the dusty torus, a relation verified over a range of in luminosity. This finding validates the Netzer & Laor (1993) proposal that the BLR size is bounded by dust sublimation. The second evidence is the finding by Risaliti et al (2002) that the X-ray absorbing columns in Seyfert 2 display time variations caused by cloud transit across the line of sight. Most variations come from clouds that are dust free because of their proximity ( 0.1 pc) to the AGN, but some involve dusty clouds at a few pc. Other than the different time scales for variability, there is no discernible difference between the dust-free and the dusty X-ray absorbing clouds.
These observations show that the X-ray absorption, broad line emission and dust obscuration and reprocessing are produced by a single, continuous distribution of clouds. The different radiative signatures merely reflect the change in cloud composition across the dust sublimation radius . The inner clouds are dust free. Their gas is directly exposed to the AGN ionizing continuum, therefore it is atomic and ionized, producing the broad emission lines. The outer clouds are dusty, therefore their gas is shielded from the ionizing radiation and the atomic line emission is quenched. Instead, the material in these clouds is molecular and dusty, obscuring the optical/UV emission from the inner regions and emitting IR. Thus the BLR occupies while the torus is simply the region. Both regions produce X-ray absorption, but because each radial ray contains most of its clouds in its BLR segment, that is where the bulk of the X-ray obscuration is produced. Since the X-ray obscuration region coincides mostly the with BLR, it seems appropriate to name this region instead BLR/XOR. By the same token, since the unification torus is just the outer portion of the cloud distribution and not an independent structure, it is appropriate to rename it the TOR for Toroidal Obscuration Region.
The merger of the ionized and dusty clouds into a single population offers a solution to the torus vertical structure problem. Mounting evidence for cloud outflow (see, e.g., Elvis 2004) indicates that instead of a hydrostatic “doughnut”, the TOR is a region in a clumpy wind coming off the accretion disk (see Elitzur & Shlosman 2006 and references therein). The accretion disk appears to be fed by a midplane influx of cold, clumpy material from the main body of the galaxy. The outer regions of the disk are dusty and molecular, as observed in water masers in some edge-on cases. At smaller radii the disk composition switches to atomic and ionized, producing a double-peak signature in emission line profiles. Approaching the center, conditions for developing hydromagnetically- or radiatively-driven winds above this equatorial inflow become more favorable. The disk-wind geometry provides a natural channel for angular momentum outflow from the disk and is found on many spatial scales, from protostars to AGN. In both the inner (atomic and ionized) and outer (dusty and molecular) regions, as the clouds rise and move away from the disk they expand and lose their column density. Therefore the X-ray absorption, broad line emission and dust obscuration and emission all have a limited vertical scope, resulting in a toroidal geometry for both the BLR/XOR and the TOR.
The properties of the dusty TOR clouds are determined from their IR emission and the requirement that they withstand tidal shearing. The cloud column density is – cm-2. At a distance (in pc) from a black hole with mass (in ), the cloud density is / cm-3, its size is / cm and its mass . These parameters are similar to what is found at molecular cores of ISM clouds. Indeed, molecular clouds with such properties and uplifted from the disk appear to have been detected in water maser observations of NGC 3079 (Kondratko et al. 2005).
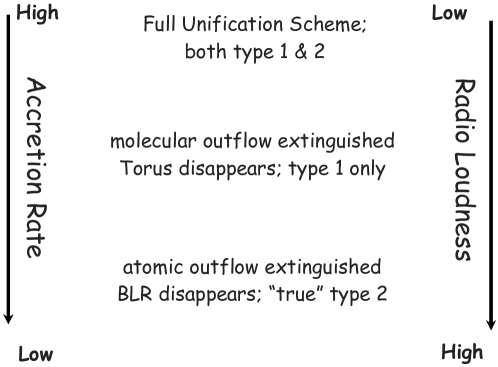
A key prediction of the wind scenario is that the TOR disappears at low bolometric luminosities ( erg s-1) because mass accretion can no longer sustain the required cloud outflow rate. This prediction seems to be corroborated in observations of both FR I radio galaxies (Chiaberge et al. 1999) and LINERs (Maoz et al 2005). In particular, the histogram of UV colors shows an overlap between the two populations of type 1 and type 2 LINERs with erg s-1. The difference between the peaks corresponds to dust obscuration in the type 2 LINERs of only 1 magnitude in the R band, minute in comparison with higher luminosity AGN. If the TOR was the only component removed from the system, all low luminosity AGN would become type 1 sources. In fact, among the low-obscuration LINERs Maoz et al (2005) find sources both with broad H wings (type 1) and without (type 2). Therefore the broad line component is truly missing in the type 2 sources in this sample. Similarly, Laor (2003) presents arguments that some “true” type 2 sources, i.e., having no obscured BLR, do exist among AGN with . Both findings have a simple explanation if when decreases still further, the suppression of mass outflow spreads radially inward from the disk’s dusty, molecular region into its atomic, ionized zone. Then the TOR disappearance would be followed by a diminished outflow from the inner ionized zone and disappearance of the BLR/XOR at lower, still to be determined luminosities. This evolutionary scheme is sketched in figure 5.
Ho (2002) finds that the radio loudness of AGN is inversely correlated with the mass accretion rate. That is, when is decreasing, the cloud outflow rate is decreasing too while the radio loudness is increasing. It seems that the AGN switches its main dynamic channel for release of excess accreted mass from torus outflow at higher luminosities to radio jets at lower ones. X-ray binaries display a similar behavior, switching between radio quiet states of high X-ray emission and radio loud states with low X-ray emission. Comparative studies of AGN and X-ray binaries seem to be a most useful avenue to pursue.
Acknowledgments.
Partial support by NASA and NSF is gratefully acknowledged.
References
- (1)
- (2) Alonso-Herrero, A., et al. 2003, AJ, 126, 81
- (3) Aretxaga, I., et al. 1999, ApJl, 519, L123
- (4) Barvainis, R. 1987, ApJ, 320, 537
- (5) Buchanan, C.L. et al, 2006, AJ, 132, 401
- (6) Chiaberge, M., Capetti, A., & Celotti, A. 1999, A&A, 349, 77
- (7) Elitzur, M. 2006, New Astronomy Review, 50, 728
- (8) Elitzur, M., & Shlosman, I. 2006, ApJ, 648, L101
- (9) Elvis, M. 2004, in “AGN Physics with the Sloan Digital Sky Survey”, eds. G.T. Richards & P.B. Hall, ASP Conf. Proc. 311, p. 109
- (10) Gallagher et al. 2006, ApJ, 644, 709
- (11) Hao, L., et al. 2005, AJ, 129, 1795
- (12) Ho, L. C., 2002, ApJ, 564, 120
- (13) Horst, H., Smette, A., Gandhi, P., & Duschl, W. J. 2006, A&A, 457, L17
- (14) Jaffe et al, 1994, Nature, 429, 47
- (15) Kondratko, P.T., Greenhill, L.J., & Moran, J.M., 2005, ApJ, 618, 618
- (16) Krolik, J. & Begelman, M., 1988, ApJ, 329, 702
- (17) Laor, A., 2003, ApJ 590, 86
- (18) Lawrence, A. 1991, MNRAS, 252, 586
- (19) Lutz, D., Maiolino, R., Spoon, H.W.W., & Moorwood, A. F. M. 2004, A&A, 418, 465
- (20) Maiolino, R. et al., 2001, A&A, 365, 28
- (21) Maoz, D., Nagar, N. M., Falcke, H., & Wilson, A. S. 2005, ApJ, 625, 699
- (22) Mason, R. E., et al. 2006, ApJ, 640, 612
- (23) Nenkova, M., Ivezić, Ž. & Elitzur, M., 2002, ApJ, 570, L9
- (24) Nenkova, M., Sirocky, M. M., Ivezić, Ž. & Elitzur, M., 2006 (in preparation)
- (25) Netzer, H., & Laor, A. 1993, ApJ, 404, L51
- (26) Poncelet, A., Perrin, G. & Sol, H., 2006, A&A 450, 483
- (27) Risaliti, G., Elvis, M. & Nicastro, F., 2002, ApJ, 571, 234
- (28) Risaliti, G., et al. 2005, ApJ, 630, L129
- (29) Rodríguez-Ardila, A., & Mazzalay, X. 2006, MNRAS, 367, L57
- (30) Schmitt, H. R., et al. 2001, ApJ, 555, 663
- (31) Simpson, C. 2005, MNRAS, 360, 565
- (32) Suganuma, M., et al. 2006, ApJ, 639, 46
- (33) Urry, C.M., & Padovani, P., 1995, PASP 107, 803
- (34) Zakamska, N. L., et al. 2005, AJ, 129, 1212
- (35)