An Explanation for the Observed Weak Size Evolution of Disk Galaxies
Abstract
Surveys of distant galaxies with the Hubble Space Telescope and from the ground have shown that there is only mild evolution in the relationship between radial size and stellar mass for galactic disks from to the present day. Using a sample of nearby disk-dominated galaxies from the Sloan Digital Sky Survey (SDSS), and high redshift data from the GEMS (Galaxy Evolution from Morphology and SEDs) survey, we investigate whether this result is consistent with theoretical expectations within the hierarchical paradigm of structure formation. The relationship between virial radius and mass for dark matter halos in the CDM model evolves by about a factor of two over this interval. However, N-body simulations have shown that halos of a given mass have less centrally concentrated mass profiles at high redshift. When we compute the expected disk size-stellar mass distribution, accounting for this evolution in the internal structure of dark matter halos and the adiabatic contraction of the dark matter by the self-gravity of the collapsing baryons, we find that the predicted evolution in the mean size at fixed stellar mass since is about 15–20 percent, in good agreement with the observational constraints from GEMS. At redshift , the model predicts that disks at fixed stellar mass were on average only 60% as large as they are today. Similarly, we predict that the rotation velocity at a given stellar mass (essentially the zero-point of the Tully-Fisher relation) is only about 10 percent larger at (20 percent at ) than at the present day.
Subject headings:
galaxies: spiral – galaxies: evolution – galaxies: high redshift – surveys – cosmology: observations1. Introduction
The relationship between the radial size and the luminosity or stellar mass of galactic disks is a fundamental scaling relation that reveals important aspects of the formation history of these objects. The size, luminosity/mass, and rotation velocity form a ‘fundamental plane’ for disks at the present epoch (Pizagno et al. 2006) that is analogous to the more familiar fundamental plane for early-type galaxies (Burstein et al. 1997). The zero-point, slope, and scatter of the fundamental plane for both disks and spheroids, and the evolution of these quantities over cosmic time, pose strong constraints on models of galaxy formation.
In the modern paradigm of disk formation, Cold Dark Matter (CDM) dominates the initial gravitational potential, and dark matter (DM) and gas aquire angular momentum via tidal torques in the early universe (Peebles 1969). When the gas cools and condenses, this angular momentum may eventually halt the collapse and lead to the formation of a rotationally supported disk (Fall & Efstathiou 1980). Under the assumption that the specific angular momentum of the pre-collapse gas is similar to that of the DM and is mostly conserved during collapse, this picture leads to predictions of present-day disk sizes that are in reasonably good agreement with observations (Kauffmann 1996; Dalcanton et al. 1997; Mo et al. 1998; Avila-Reese et al. 1998; Somerville & Primack 1999; van den Bosch 2000; Dutton et al. 2007; Gnedin et al. 2006).
However, in the most sophisticated numerical hydrodynamic simulations of disk formation in a CDM universe, the proto-disk gas tends to lose a large fraction of its angular momentum via mergers, leading to disks that are too small and compact (Navarro & White 1994; Sommer-Larsen et al. 1999; Navarro & Steinmetz 2000). It is still not clear whether this problem reflects a fundamental difficulty with CDM (i.e., excess small scale power), or is due to inadequate numerical resolution or treatment of “gastrophysical” processes like star formation and feedback (Governato et al. 2004; Robertson et al. 2004). However, it has been suggested that delayed cooling and star formation, perhaps due to strong feedback in low-mass progenitors, could help to stem this angular momentum loss (Weil et al. 1998; Maller & Dekel 2002). These ideas can be tested by observing the evolution of disk scaling relations at high redshift relative to the present epoch.
The observational relationship between radial size (effective radius or disk scale length) and luminosity or stellar mass for disks at low redshift has now been well-characterized by studies based on the Sloan Digital Sky Survey (SDSS; e.g. Shen et al. 2003, hereafter S03). Several pioneering studies in the past decade studied the size-luminosity relation for disks out to redshift (e.g. Lilly et al. 1998; Simard et al. 1999). Sizes were also measured for Lyman Break Galaxies (LBGs) at redshifts (Giavalisco et al. 1996; Lowenthal et al. 1997). However, there was significant disagreement between the results of different studies, and a clear understanding of the evolution of galaxy sizes over cosmic time was hampered by the difficulty of obtaining large samples with accurate redshifts and high-resolution imaging, and by concerns about the impact of surface brightness selection effects. An additional problem with interpreting high redshift data is that as higher redshifts are probed, the observed optical begins to shift into the rest-UV, and k-corrections become highly uncertain. Moreover, the stellar mass-to-light ratios of galaxies increase as their stellar populations age, and therefore the size-luminosity relation would change over time even for galaxies that were just “passively” aging.
Recently, new studies with the Advanced Camera for Surveys (ACS) on the Hubble Space Telescope (HST) have provided greatly improved constraints on the disk size-luminosity relation at high redshift. Ravindranath et al. (2004) and Ferguson et al. (2004) presented size distributions for disk-type galaxies and for rest-UV selected galaxies from , respectively, based on samples selected from the Great Observatories Origins Deep Survey (GOODS). Barden et al. (2005, hereafter B05) presented the luminosity-size and stellar mass-size relation out to based on the GEMS (Galaxy Evolution from Morphology and SEDs) survey (Rix et al. 2004). They concluded that disk galaxies of a given size at are 1 magnitude brighter in the -band, but that there is less than about a ten percent change in the stellar mass at a given size between and the present. This result is consistent with a mean stellar mass-to-light ratio that increases with time, as expected based on the simple aging of stellar populations. An interesting complementary result was recently found by Sargent et al. (2006) based on the COSMOS survey. They found that the number density of disks with half-light radii between 5 and 7 kpc is nearly constant from until the present. Coupled with findings that the stellar mass function of spiral galaxies at was about the same as it is today (Borch et al. 2006), this reinforces a picture in which disks have a fixed relationship between their stellar mass and their radial size over this redshift interval (i.e., that as disks grow in mass through star formation, their sizes grow in such a way as to keep them on this relation, on average).
Trujillo et al. (2004) measured luminosity-size and stellar mass-size relations in the rest-frame optical (based on the ground-based Near Infrared selected FIRES sample) out to , and found that the average surface brightness at is about 2–3 mag arcsec-1 brighter than in the local universe, but the average size at a fixed stellar mass has evolved by less than a factor of two. Trujillo et al. (2006, hereafter T06) presented the results of a similar analysis of a larger sample from FIRES, and combined those results with the lower redshift studies of S03 and B05.
How do these observations compare with theoretical expectations? In the simplest version of the Fall-Efstathiou picture, under the assumption that halo mass density profiles are singular isothermal spheres (SIS; ) and neglecting the self-gravity of the baryons, we expect the size of a galactic disk that forms within a dark matter halo to scale as , where is the dimensionless spin parameter and is the virial radius of the dark matter halo. N-body simulations have demonstrated that the spins of dark matter halos are not correlated with halo mass or most other properties, and the distribution does not evolve with time (e.g. Bullock et al. 2001a). If the stellar mass of the disk is a constant fraction of the halo virial mass, then, in this simple picture, the expectation is that the average size of galactic disks of a given stellar mass will evolve as evolves for halos of a given virial mass. In the currently favored CDM cosmology, this would imply a decrease of a factor of out to and a factor of out to . This scaling (hereafter referred to as the SIS model) has frequently been used in the literature as a theoretical baseline (e.g. Mao et al. 1998; Ferguson et al. 2004, B05,T06). Mao et al. (1998) found that the SIS model was consistent with the size evolution of disks out to compared with the data available at the time, but the samples were tiny, and the observational selection effects were not well characterized or accounted for. Ferguson et al. (2004) also found that the average rest-UV sizes of rest-UV selected galaxies at were consistent with the SIS model, but the connection of rest-UV luminosity with stellar mass (or halo mass) is quite uncertain. Most recently, B05 and T06 concluded that the predicted evolution in the SIS model is considerably stronger than the observed evolution of the rest-optical sizes in their stellar-mass selected disk samples.
However, the SIS model neglects several important factors that are believed to play a role in determining the size of galactic disks forming in CDM halos. 1) The mass density profiles of CDM halos are not SIS, but have a universal form (known as the Navarro-Frenk-White (NFW) profile; Navarro et al. 1997), characterized by the concentration parameter . The concentration parameter quantifies the density of the halo on small ( kpc) scales relative to the virial radius, and has an important impact on the structural parameters of the resulting disk. There is a correlation between halo virial mass and concentration (Navarro et al. 1997), though with a significant scatter (Bullock et al. 2001b), and this mean halo concentration-mass relation evolves with time, in the sense that halos of a given mass were less concentrated in the past (Bullock et al. 2001b). 2) The self-gravity of the baryonic material may modify the distribution of the dark matter as it becomes condensed in the central part of the halo (“adiabatic contraction”) 3) Disks with low values of and/or large baryonic-to-dark mass ratios may not have sufficient angular momentum to support a stable disk. These unstable disks may form a bar or a bulge, and might no longer be included in a sample of ‘disk dominated’ galaxies.
There are of course numerous other potential complications in the process of the formation and evolution of galactic disks, which we do not consider here (though we discuss some of them in §5). Here we present the predictions of a model for disk formation that improves on the simple SIS model by incorporating NFW halo profiles, adiabatic contraction, and disk instability. This model is based on the formalism and basic ingredients presented in Blumenthal et al. (1986), Flores et al. (1993), and Mo et al. (1998, MMW98). Our main result is that the predictions of this improved model are compatible with the rather weak observed evolution of the disk stellar mass-size relation out to reported by B05. We also extend these predictions out to higher redshift , and find acceptable agreement with the results reported by T06.
We discuss the ingredients of our model in §2, give a brief summary of the observational data in §3, present our results in §4, and discuss our results and conclude in §5. We assume the following values for the cosmological parameters: matter density , baryon density , cosmological constant , Hubble parameter km s-1 Mpc-1, fluctuation amplitude , and a scale-free primordial power spectrum .
2. Model
The fundamental hypothesis of our model, following the Fall-Efstathiou paradigm, is that galactic disks form within massive, extended dark matter halos. The structural properties and multiplicity functions of dark matter halos in a given cosmology can be robustly predicted from N-body simulations and analytic fitting formulae. Therefore, the main challenge is to relate the structural properties of dark matter halos to the observable properties of disk galaxies. Making this connection is the goal of our model, which we now briefly present. Note that our approach, and the exposition here, are closely based on the formalism presented in Blumenthal et al. (1986), Flores et al. (1993), and Mo et al. (1998, MMW98).
We assume that a fraction of the halo’s virial mass is in the form of baryons that are able to cool and collapse, forming a disk with mass . We denote the angular momentum of the disk material as , and assume that it is a fixed fraction of the halo angular momentum and that specific angular momentum is conserved when the baryons cool and collapse. We also assume that the disk is thin, in centrifugal balance, and has an exponential surface density profile . Here and are the disk scalelength and central surface density, and are related to the disk mass through .
The angular momentum of the disk is:
| (1) |
If we were to assume that the initial dark matter density profile is a singular isothermal sphere, and to neglect the self-gravity of the disk, then the rotation velocity is constant and equal to , and the angular momentum of the disk reduces to:
| (2) |
Using the definition of the spin parameter, (Peebles 1969), where is the total energy of the halo, we can write:
| (3) |
We now define to be the ratio of the specific angular momenta of the disk and the halo.
If we assume all particles to be on circular orbits, the total energy of a truncated singular isothermal sphere can be obtained from the virial theorem:
| (4) |
If we assume that the spin parameter does not change with cosmic epoch, this leads to the expected scaling . We refer to this model as the ‘SIS’ model, reflecting the assumption that the initial halo profiles are singular isothermal spheres.
A more realistic model would incorporate cosmologically motivated Navarro-Frenk-White (NFW) halo profiles (Navarro et al. 1997) and should also include the effect of the self-gravity of the baryons on the predicted properties of the disk. If the gravitational effects of the disk were negligible, then the rotation curve would be the same as that of the unperturbed NFW halo, which rises to a maximum value at a radius , where is the NFW scale radius . However, on scales where the mass of baryonic material becomes significant compared with the dark matter, we must account not only for the direct gravitational effects of the baryonic disk material, but also for the fact that the dark matter contracts in response to the gravitational force of the baryons as they collapse to form the disk. We compute the effect of this contraction under the assumption that the disk forms gradually enough that the response of the halo is “adiabatic”, i.e., that the following “adiabatic invariant” quantity is conserved:
| (6) |
where is the initial mass within an initial radius (assumed to be given by the NFW profile), and is the post-collapse mass within a final radius . Numerical tests of the validity of the “adiabatic collapse” formalism have shown that it works surprisingly well, even when some of the underlying assumptions (such as spherical symmetry and all particles being on circular orbits) are violated (Jesseit et al. 2002; Gnedin et al. 2004).
The final mass within a radius is the mass of the exponential disk plus the mass of dark matter within the initial radius : . The modified rotation curve can then be written as a sum in quadrature of the contributions from the disk and the (contracted) dark matter halo: . The rotation curve for the disk is given by the usual expression for a thin exponential disk (see e.g. Binney & Tremaine 1987), and the dark matter component of the rotation velocity is given by . Using eqn. 2 again, and making a change in variable , we can write the expression for the angular momentum of the disk as:
| (7) |
and, in direct analogy to eqn. 5, we obtain
| (8) |
where
| (9) |
and is the total energy for a halo with an NFW profile, relative to that for a singular isothermal sphere with the same mass. Note that in this step we have also used the fact that , and that the disk density profile declines exponentially, to set the upper limit of integration to infinity.
For a given set of halo properties , , and , and disk parameters and , we can solve this system of equations iteratively to obtain and 111For a more detailed account of how to go about solving the equations, and analytic fitting functions for and , see MMW98). We describe how we obtain the halo properties and disk parameters in the following section. We will refer to the improved model as the ‘NFW’ model.
Comparing eqn. 8 with the corresponding expression in the SIS model, eqn. 5, we can see that they differ by two factors: , which reflects the difference in energy of a singular isothermal sphere vs. a NFW profile, and , which reflects both the NFW density profile and the effect of the adiabatic contraction. The ratio of eqn. 8 and eqn. 5 (/) is plotted in Fig. 1, as a function of disk fraction and of halo concentration . From this plot, we can gain several insights into the behavior of the model. First, we can see that the NFW model generally predicts disk sizes that are smaller than the values in the SIS model. For a dark matter halo with , the present-day virial radius is kpc, and so from eqn 5, the predicted scale radius would be about 6 kpc for the median value of the spin parameter . This is almost a factor of two larger than one might expect, if such a halo hosts a galaxy similar to the Milky Way or M31. Therefore, there is room for this reduction in size predicted by the new model.
We can also see that smaller values of lead to larger values of . This is because there is less mass and therefore less gravity to contract the halo, leading to a more extended disk. Finally, we see that lower values of concentration also lead to larger (more extended) disks. Lower values of imply that there is less mass near the center of the halo relative to the outer parts, again leading to weaker gravitational forces on the kpc scales where the disk is forming, and less contraction of the halo, therefore a more extended disk.
2.1. Disk Stability
Because of the rather large range of allowed spin parameters , our model predicts a fairly broad distribution of galaxy sizes at fixed stellar mass. However, it is possible that not all of these disks gravitationally stable. It is well-known from numerical studies that galaxies in which the self-gravity of the baryons dominates may be unstable to the formation of a bar (e.g. Christodoulou et al. 1995). Following MMW98, who base their stability criterion on the study of Efstathiou et al. (1982), we adopt a threshold for instability , where is the maximum rotation velocity, which we approximate as the rotation velocity at . We adopt (Syer et al. 1999), and assume that galaxies with less than this critical value may form a significant bar or bulge and be excluded from a disk sample. Because of the uncertainties associated with the fate of these “unstable” disks, however, we present the results of our analysis both including and excluding these objects.

2.2. Initial Conditions and Model Parameters
Let us consider a virialized dark matter halo of a given virial mass () at a specific redshift. We require the following information, all as a function of redshift:
-
•
The number density of these halos
-
•
The halo virial radius and virial velocity
-
•
The initial halo mass density profile , here characterized by the Navarro-Frenk-White concentration parameter
-
•
The halo specific angular momentum, characterized by the dimensionless spin parameter .
All of this information can be robustly obtained with a high degree of accuracy from modern numerical cosmological N-body simulations. We now describe each ingredient in some detail, and how we obtain it.
Halo number density as a function of redshift: Over a given redshift interval, we select halo masses from the mass function of Sheth & Tormen (1999) using a Monte Carlo procedure.
Halo virial radius and virial velocity: It is standard to define dark matter halos as spherical regions within which the average overdensity exceeds a critical value times the mean background density of the universe. The value of is computed based on the spherical collapse model. In an Einstein-de Sitter () universe, and by definition the background density equals the critical density . During the early years of the development of the CDM paradigm, when the Einstein-de Sitter model was widely assumed to be correct, it became common to define halos as overdensities greater than 200 times the critical density (the value 200 was obtained by just rounding off 178). This assumption is still commonly used by many authors today, in spite of the fact that it is no longer well-motivated in the now-favored concordance cosmology. We instead use the appropriate value of for our adopted cosmology, as predicted by the spherical collapse model () times the mean background density. This assumption is also commonly used in the literature, and was used in the Bullock et al. (2001a, 2001b) papers from which we obtain our halo profile and spin relations. The details of the adaptation of the spherical collapse model to a general cosmology (with cosmological constant) and formulae for and plots of the relations for halo virial radius as a function of mass and redshift are given in the Appendix of Somerville & Primack (1999), and are the same relations that we use here. The halo virial velocity is then easily obtained by use of the virial relation, . Note that, because halos are defined with respect to the background density of the universe, average halo densities were higher in the past. This implies that halos of a given virial mass had smaller virial radii, and higher virial velocities, in the past than they do today.
Halo Density Profile: We assume that initially the halo mass density profiles obey the Navarro-Frenk-White form (Navarro et al. 1997), and compute the halo concentration as a function of mass and redshift using the analytic model provided by Bullock et al. (2001b, B01), which is based on the results of numerical simulations. The results of B01 have been confirmed by a number of other studies (Jing 2000; Eke et al. 2001; Wechsler et al. 2002; Macció et al. 2006).
The basic ingredients of the B01 analytic model for are as follows. They define a “collapse redshift” for each halo as , where . Here, F is a parameter of the model, which is measured by fitting to N-body simulations, is the linear rms density fluctuation on the comoving scale encompassing a mass , is the linear theory value of the critical density in the spherical tophat model, and is the linear growth factor. Then the concentration is given by , where is another adjustable parameter of the model. Note that is independent of , and therefore at fixed mass.
Bullock et al. (2001b) found values of and for a CDM model with the same values of , , and as our cosmology, but with a higher value of . A recent study by Macció et al. (2006), based on a larger sample of higher resolution simulations, confirms the B01 model but finds for a CDM cosmology with (corresponding to a 15 percent lower normalization than B01, but with the same mass dependence). In the model presented here, we adopt the updated Macció et al. (2006) normalization of the relation ().
The concentration of halos of a given mass at a given redshift depends on the cosmology and the power spectrum. In cosmologies in which halos assemble their mass early (late), a halo of a given mass has a higher (lower) concentration (Wechsler et al. 2002). We can see from the above formulae that in a cosmology with a modified (for example, if we changed the value of the cosmological constant, ), the redshift evolution of would be different. Similarly, if we modified the normalization or shape of the power spectrum (which enters through ), it would alter the normalization and slope of the relation. For example, in the cosmology derived from the WMAP three year results of Spergel et al. (2006)222, , , km s-1 Mpc-1, , , the relation has a normalization about 30 % lower than in our adopted cosmology, but a nearly identical redshift dependence.
Halo Specific Angular Momentum: N-body simulations have demonstrated that the spin parameter , which characterizes the specific angular momentum of dark matter halos, is uncorrelated with the halo’s mass and concentration (Bullock et al. 2001a; Macció et al. 2006) and does not evolve with redshift. The distribution of is log-normal, with mean and width (Bullock et al. 2001a). We therefore assign each halo a value of by selecting values randomly from this distribution, assuming that it is not correlated with any other halo properties or with redshift.
2.3. Predicting observable disk properties
We assume that each halo with a virial velocity below 350 km/s hosts one disk galaxy at its center. Once the halo properties are specified as described above (based on dissipationless N-body simulations), there are only two free parameters in our model: the fraction of mass in the form of baryons in the disk, , and the fraction of the specific angular momentum of the DM halo captured by the disk, . Throughout this work, we assume . Although there are physical reasons to think that may not be exactly equal to unity, note that in order to change our main conclusions, would have to be a strong function of redshift. There is no obvious physical reason to expect this to be the case.
Since is now the only free parameter, we can fix its value by requiring that we reproduce the observed scale length of a galaxy of a given virial mass scale. For example, adopting produces a galaxy with disk mass and scale length kpc in a halo of mass , similar to the Milky Way and in good agreement with the median value for the scale length of disks in our SDSS sample at this stellar mass. However, if we assume a constant value of for all halo masses, we find that the slope of the stellar mass vs. disk scale length relation is too steep, i.e. the sizes of smaller mass disks are too small, and those of larger mass disks too large, compared with the observed relation. This has also been noted before by other authors working with similar models (e.g. Shen et al. 2003; Dutton et al. 2007). We can solve this problem by assuming that the disk baryon fraction varies with halo mass, in the sense that lower mass halos form disks with lower baryon fractions. This is in fact what is found in physically motivated models of galaxy formation, as supernova feedback can more easily heat and eject gas from low-mass halos (Natarajan 1999; Dekel & Silk 1986). We therefore adopt a simple functional form for as a function of halo mass: , following S03, and find good agreement with the observed stellar mass vs. disk scale length relation with parameter values , , and . Note that we do not discriminate between stellar mass and the mass in cold gas. For the relatively massive disks that we will focus on, the cold gas fraction should be fairly low.
3. Summary of Observational Data
For the main part of our analysis, we use the same sample of disk-dominated galaxies that was used for the analysis of B05. We give a brief summary of that sample here, and refer to B05 for details. For our local sample, we use the NYU Value-added Galaxy Catalog (VAGC; Blanton et al. 2005), based on the second data release of the SDSS (DR2). The VAGC catalog was used to obtain Sérsic parameters, -band half-light radii, and magnitudes. We then construct a sample of disk-dominated galaxies by requiring Sérsic parameter . We convert the -band half-light radii to rest-frame -band radii using the conversion derived in B05, . We compute stellar masses from the (k-corrected) and -band photometry, using the prescription of Bell et al. (2003), which relies on a conversion between color and average stellar mass-to-light ratio. We assume a normalization for this relation consistent with a Kroupa (2001) IMF.
Our high redshift disk sample comes from the GEMS survey (Rix et al. 2004; Caldwell et al. 2006), which consists of and imaging over an area of arcmin2 with the ACS on HST. The 5 point source detection limit is 28.3 magnitude in the band and 27.1 magnitude in . The GEMS object catalog is based on the image; for details see Caldwell et al. (2006). High-accuracy photometric redshift estimates () are obtained from the ground-based COMBO-17 survey (Wolf et al. 2004). The -band selection limit of COMBO-17 () limits the range of the sample to redshifts . The 17-band photometry of COMBO has also been used to obtain stellar mass estimates (Borch et al. 2006), assuming a Kroupa IMF. The GEMS main sample consists of almost 8000 galaxies with COMBO counterparts and redshifts. We fit each galaxy with a Sérsic profile and select a disk-dominated sample with good quality fits, Sérsic , and extended light profiles. This sample contains 5664 objects. Typical uncertainties are % in and magnitudes in (Häussler et al. 2006). The apparent half-light sizes measured in the observed band are converted to rest-frame V-band using an average color gradient correction based on a local sample of disk galaxies (see B05). These corrections are small ( %) over the entire redshift range of our sample (the observed band samples the rest-frame -band at ). Where disk scale radii are quoted in this work, we have obtained them by simply assuming that the measured half-light radius and the disk scale radius are related by the standard expression for a pure exponential disk, .
In order to estimate the completeness of the combined GEMS+COMBO disk sample, we have performed extensive simulations (Häussler et al. 2006; Rix et al. 2004). Artificial disks were inserted into blank sky, and the source detection and fitting software was run on this image. Poor fits are excluded in the same manner as for the real galaxy images. We can then calculate the success rate for detecting and obtaining a good fit for the artificial galaxies, as a function of apparent effective radius and apparent magnitude. We multiply this GEMS completeness factor by the (redshift, magnitude, and color-dependent) probability that the galaxy would be detected and successfully assigned a redshift in the COMBO survey. Based on these estimates, B05 argue that GEMS is not surface brightness limited even in the highest redshift bin, and that the combined GEMS+COMBO sample is complete down to stellar masses of . As in B05, we limit our analysis to galaxies with stellar mass greater than this value, and we weigh galaxies by the inverse completeness factor in computing distributions and means. To avoid using galaxies with very large weights, we exclude objects with a completeness factor smaller than 0.5. B05 have shown that the average sizes and surface densities are insensitive to the choice of this limiting completeness factor at our adopted stellar mass limit.
4. Results
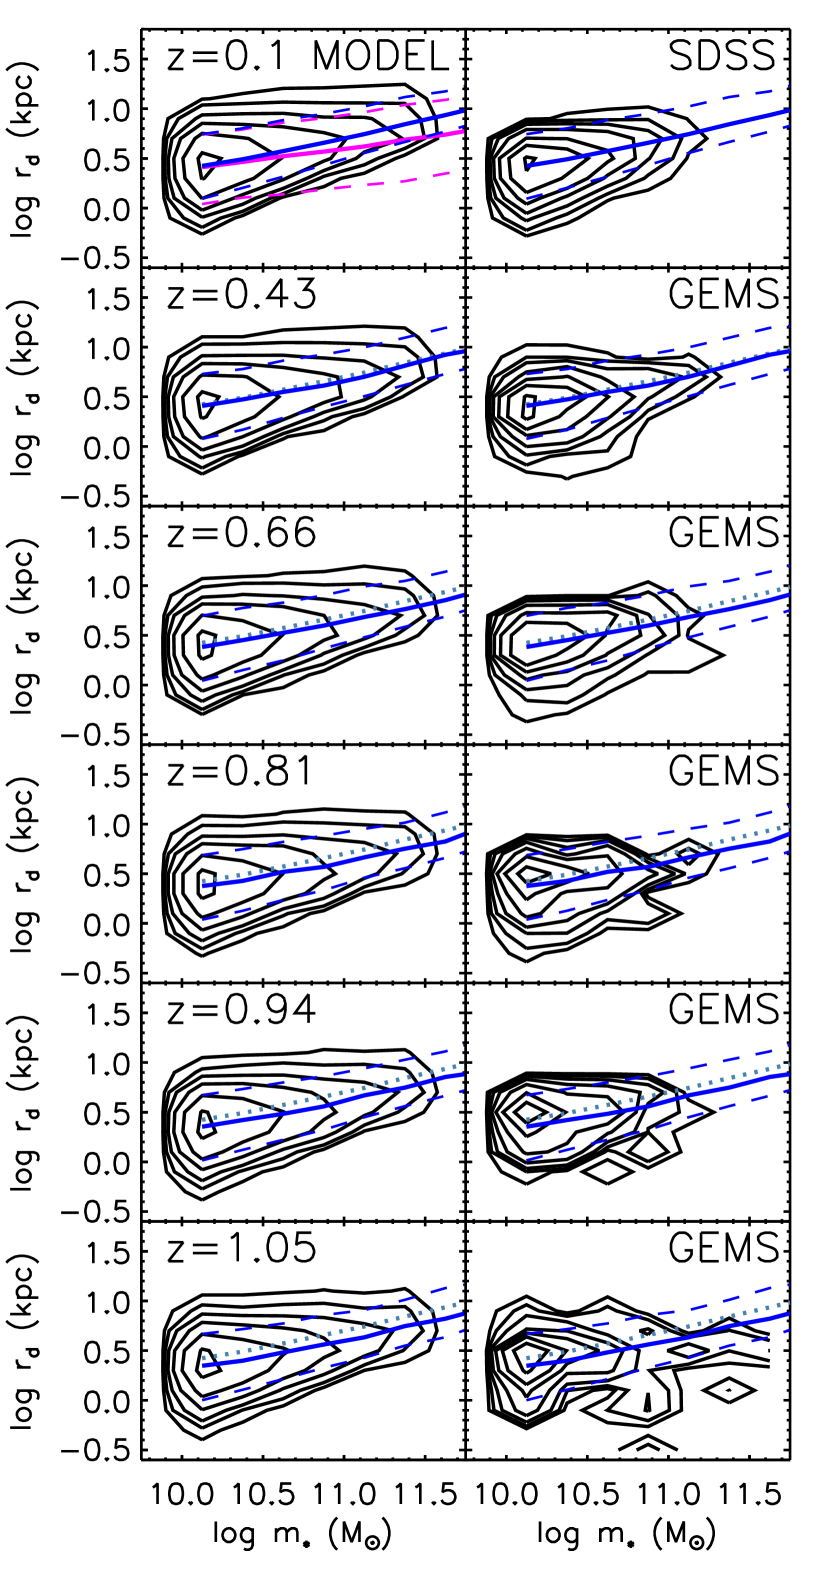
Using the models outlined above, we construct a mock catalog for a low redshift slice () representative of the SDSS sample, as well as a lightcone from with approximately ten times the area of GEMS ( arcmin2), which we divide into five bins with roughly equal comoving volume (, , , , ). Following MMW98, we define “stable disks” as those with stability parameter above a critical value, and adopt (Syer et al. 1999). The stellar mass vs. disk scale length relations for the six redshift bins from –1 are shown in Figure 2, for the mock catalogs on the left and the observed SDSS and GEMS disk samples on the right333Note that, strictly speaking, the models predict the scale length of the baryonic mass in the disk, while the observed scale lengths are for the rest-frame -band light. We do not attempt to correct for the known difference between these two quantities, since we are mainly interested in the redshift evolution. We do note here, however, that time-evolving color gradients could therefore change our results.. The observational samples are corrected for completeness as described in Section 3.
4.1. The size-mass relation and its evolution to
In the left panels of Fig. 2, the contours show the results for stable disks only. To illustrate the impact of excluding the unstable disks, the median and 10 and 90th percentiles in size as a function of stellar mass for all disks, without any stability criterion applied, are shown in the panel. The relative impact of applying the stability criterion on the size-mass relation and its scatter is similar in all the redshift bins considered here, so for clarity we show only the median relation for stable disks in the other panels. It is clear from the definition of the stability parameter that at a given halo mass, disks with larger values of are more likely to be unstable, and also at a given stellar mass, more compact disks (low ) are more likely to be unstable. Therefore, more massive galaxies are more likely to be unstable (recall that we assumed that increases with increasing halo mass), and so excluding the unstable (compact) disks results in a steepening of the slope in the – relation at . Excluding the unstable disks also significantly reduces the scatter in disk size at fixed stellar mass for the massive disks. The fraction of disks deemed stable by our criterion is nearly constant over the redshift range considered here, and ranges from 95% at to 97% at .
Figure 2 shows that the NFW model can reproduce both the observed slope of the size-mass relation and the scatter in size at a given stellar mass fairly well at . Our results agree with those of S03 and other investigations. The median and 10 and 90th percentiles in disk scale length as a function of stellar mass for the stable model disks from the low redshift bin are repeated in every panel, and against these contours we can immediately see that the model predicts that the average size of disks at fixed stellar mass has increased by about 15–20% since . The GEMS sample is consistent with no evolution in size at fixed stellar mass. Note that we have normalized the model and data histograms to the same total number density in each redshift bin.
An important side issue is that we could see in Figure 2 that the model produces too many massive disks (), especially at high redshift, compared with the observational samples. This is not surprising, since we have assumed that every dark matter halo contains a single disk galaxy, which is clearly not realistic, and we know that more massive halos (which produce the massive disks) are more likely to instead host an early type galaxy. Therefore, in order to avoid any bias from the unrealistically massive model galaxies, in Figures 3 and 4, we show these distributions for galaxies with stellar masses in the range .
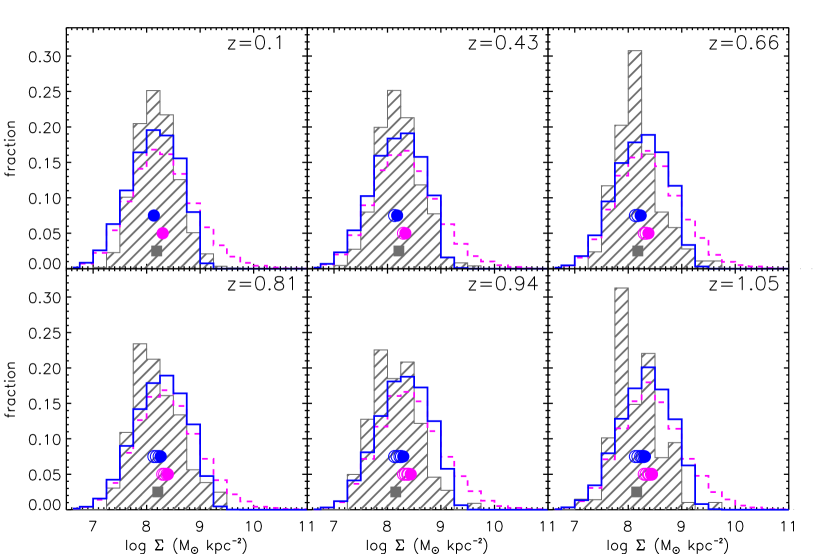
Figure 3 shows the distribution of stellar surface densities for the same six redshift bins from to . We define the stellar surface density as , where . From this figure, we can readily see that if we had not excluded unstable disks, the model would have predicted a broader distribution of surface densities than is seen in the data, with a highly skewed tail to very high densities that are not observed in the disk samples. With unstable disks excluded, the width of this distribution is reasonably consistent with the data at all redshifts, though there are hints of some interesting discrepancies; namely, the observational distributions appear perhaps a bit narrower and a bit more skewed than the model predictions.
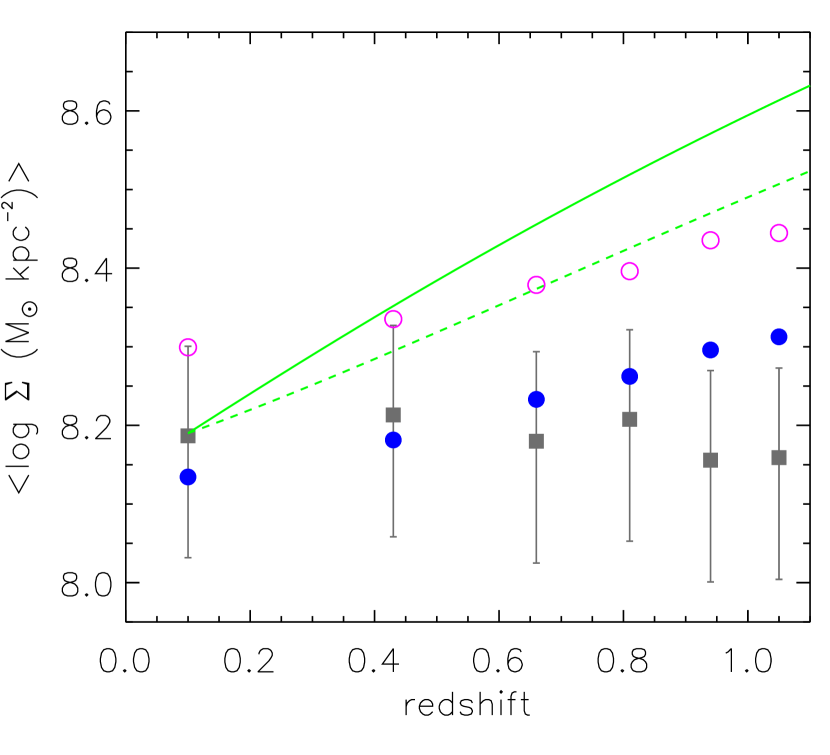
Figure 4 shows the evolution of the average value of for the same stellar mass range. As seen in the previous figure, the model predicts significant, but fairly mild, evolution in over the redshift range considered (about 0.2 dex, or about a factor of 1.5; consistent with ). We also show the SIS scalings both for and for (see §2)444Note that the evolution is somewhat more rapid when the definition is used, because the virial overdensity used to define the halo, , evolves with redshift while with the definition it remains constant. Because is larger at higher redshift, the halos are smaller in radius.. Both of these predict much more dramatic redshift evolution than is observed: as found in B05, and as seen here, the results from the GEMS analysis are consistent with no evolution in the average value of over the redshift range .
B05 found that the 2- error bars on the average values of obtained from bootstrap resampling are –0.1 dex, but this certainly underestimates the possible systematic errors. For example, the stellar mass estimates may be systematically incorrect if galaxies have more bursty star formation histories at high redshift, or the size estimates could be systematically biased by the increasingly irregular morphologies of high redshift disks (our fitting simulations assume perfectly smooth galaxies). We estimate the overall systematic uncertainty in size at fixed stellar mass to be %, and show representative error bars reflecting this in Figure 4. The prediction of the NFW model is a significant improvement over the SIS scaling, and it is in acceptable agreement with the GEMS data to within these estimated uncertainties.
The surface density of disks is important because nearly all semi-analytic galaxy formation models assume that the efficiency of star formation is determined by the disk surface density through the Kennicutt Law, above a critical surface density . Predicting disk surface densities correctly is therefore very important for self-consistent models of galaxy formation. Note, however, that many semi-analytic models (e.g. Somerville & Primack 1999; Kauffmann et al. 1999; Croton et al. 2006) effectively assume that the disk surface density scales according to the SIS prediction. This will clearly lead to fairly serious inaccuracies in the predictions of the evolution of the star formation rates in galaxies in these models.
4.2. Evolution to higher redshift
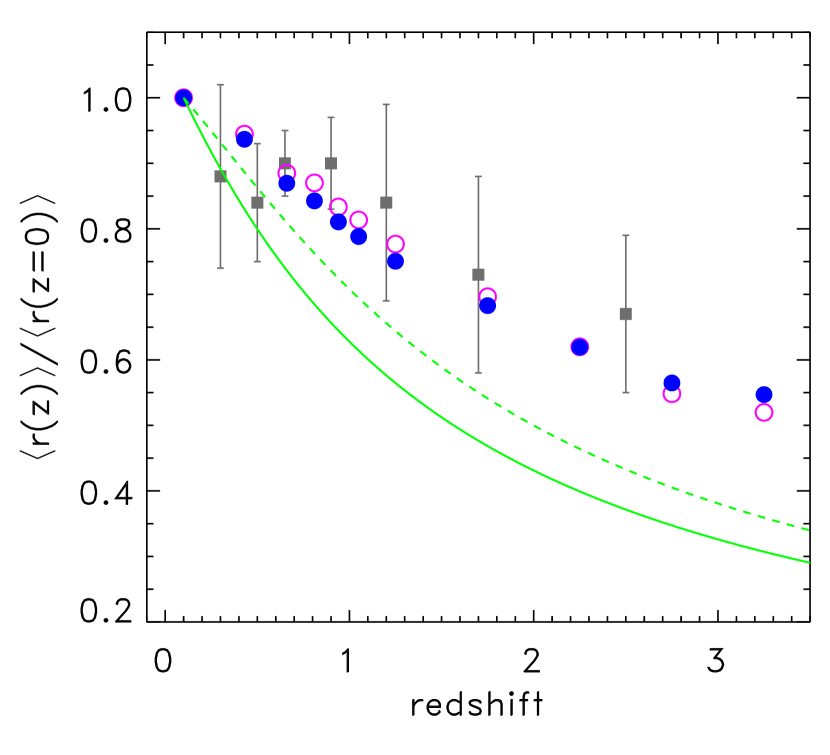
We now briefly explore how the models fare in comparison with the more limited data available at higher redshift. Figure 5 shows the average size of disk galaxies with stellar mass greater than predicted by the model, out to , compared with the combined results from SDSS, GEMS, and FIRES, presented by T06. Each set of points is normalized relative to the average scale length of that sample at . Results are shown for all disks, and for “stable” disks only. Note that the absolute average disk scale lengths for the “stable” disks are always larger than those for the total set of disks, with no stability criterion applied, however, the redshift evolution of the stable disk sample is slightly steeper than that of the overall sample out to . This is why the stable disk sizes, when normalized relative to the average size of stable disks at , are a little bit lower than the total disk sample out to . We again also show the scaling for halo virial radius at fixed halo mass, which would predict much more rapid size evolution than is observed. As we have already seen, the improved model predicts fairly mild evolution in the average disk sizes out to , in quite good agreement with the GEMS data. At higher redshifts –3, our model predicts that disks should be about 60% as large as they are today at a given stellar mass. This represents somewhat more evolution than the observational results of T06 indicate, but is within the quoted error bars.
4.3. Evolution of the Tully-Fisher relation
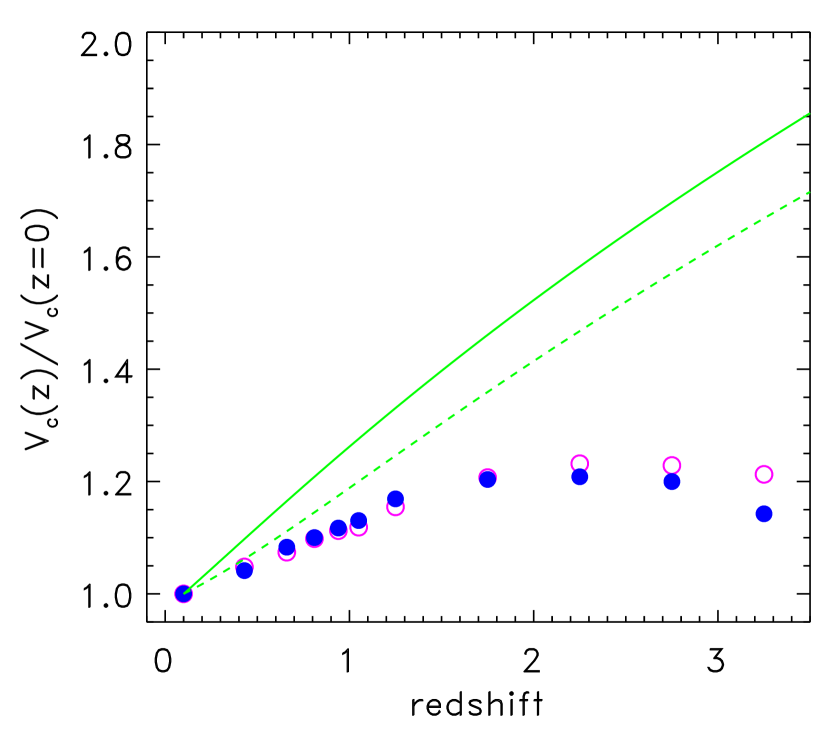
Our models also simultaneously predict the rotation curves of the disks. It has been shown in previous work that models similar to the one presented here can reproduce the detailed rotation curves for the Milky Way and M31 (Klypin et al. 2002), and the Tully-Fisher relation (circular velocity at some fiducial radius vs. luminosity, or vs. stellar or baryonic mass) at redshift zero (Mo et al. 1998; Dutton et al. 2007; Gnedin et al. 2006). A detailed comparison with observations of rotation velocities and the Tully-Fisher relation is beyond the scope of this paper, but we briefly present a prediction for the evolution of the Tully-Fisher zero-point (here expressed as the average rotation velocity at 3 disk scale lengths, for disk galaxies of a fixed stellar mass, ) in Fig. 6. We find that the disk rotation velocity at fixed disk mass evolves much more gradually than the halo virial velocity at fixed halo mass. In fact, our model predicts that should actually remain nearly constant from –3. Observational constraints on the time evolution of the Tully-Fisher relation, particularly in terms of stellar or baryonic mass, remain uncertain, but Conselice et al. (2005) found no evolution in the K-band or stellar mass Tully-Fisher to , and Kassin et al. (2007) also find no evolution to in a redefined version of the stellar mass Tully-Fisher relation555Instead of using the usual rotation velocity, they define a new velocity variable which includes contributions from random motions as well as rotation..
5. Discussion and Conclusions
We have shown that a CDM-based model of disk formation produces good agreement with the observed weak redshift evolution of the disk size-stellar mass relation from GEMS out to . This result is in contrast to the considerably stronger evolution implied by the assumption often used in the literature, that disk sizes simply scale in proportion to the dark matter halo virial radii. Similarly, we find much weaker evolution in the disk rotation velocity at a given disk mass than we would expect if scaled in proportion to the halo virial velocity .
The more gradual evolution in the “improved” model results primarily from the use of realistic NFW halo profiles, and from the incorporation of the redshift evolution of the halo concentration-mass relation predicted by N-body simulations. Recall that in our model, at fixed halo mass, there are two halo properties and two disk parameters that determine the structural properties of the disk: halo concentration , halo spin , the baryon fraction of the disk and the fraction of specific angular momentum captured by the disk materal, . We have assumed that the distribution of spin parameters for the overall population of dark matter halos does not change with time, as demonstrated by N-body simulations. We have also assumed that is a fixed function of halo mass that does not depend on redshift (though in reality this may not be true), and we have assumed a fixed value of . Therefore, there is only one ingredient left that can possibly be responsible for changing the predictions for the redshift dependence of disk sizes at fixed mass: the halo concentration vs. mass relation.
As we have discussed, simulations have shown that the halo concentration vs. mass relation depends on redshift: the halo concentration at fixed mass scales as (Bullock et al. 2001b). Therefore, a halo of a given mass is less concentrated at high redshift. This apparent evolution, however, is really a consequence of the way that halos are assembled in a CDM universe. Studies of the mass accretion history of halos in simulations has shown that they have two basic phases of growth: an early, rapid phase, in which the central density is set, and a second phase of more gradual accretion (Wechsler et al. 2002). The mass within the characteristic scale radius is assembled during the early, rapid accretion phase. Afterwards, stays nearly constant, while increases due to smooth accretion of mass, leading to a formal decrease in .
In Section 2 we demonstrated that less concentrated halos produce larger disks because of the lower mass and weaker gravitational forces in the central parts of the halo, where the disk forms. Thus the collapse of baryons produces less contraction of the dark matter profile, and a more extended disk. The trend towards lower concentrations at earlier times therefore counteracts the decreasing virial radii. Out to about , these competing effects nearly cancel out, leading to the weak evolution in the size-mass relation that we have shown.
Note that we have repeated our calculations using the “WMAP3” cosmological parameters derived by Spergel et al. (2006). Because of the reduced small scale power in this cosmology, halos form somewhat later and therefore have lower concentrations for their mass at the present day. However, once we renormalize our model (by making a minor adjustment to the normalization of the disk fraction relation ) to again reproduce the size-mass relation of present day disks, we find that the redshift evolution of disk sizes and circular velocities is nearly unchanged. This is not surprising, as the redshift evolution of the halo concentration vs. mass relation is nearly identical to the one we originally adopted.
We see a hint that the evolution predicted by these models is still a bit stronger than that indicated by the data. This could be a sign that one of the other assumptions in our simple model is incorrect. For example, if the disk baryon fraction at a given halo mass decreases with increasing redshift, this would lead to shallower evolution and relatively larger disks at high redshift. Because we have measured the disk sizes in the rest- band, evolving color gradients could also mask evolution in the true size of the stellar disk. Alternatively, systematic biases in our stellar mass and size estimates could be impacting the observational estimates.
We also see an increasing level of discrepancy at higher redshifts, . This could be a hint that an entirely different mechanism could be responsible for setting the sizes of disks at very high redshift. Mergers between gas-rich disks could result in a new, more spatially extended disk (Kazantzidis et al. 2005; Springel & Hernquist 2005; Robertson et al. 2006). This same scenario could also help to explain the kinematics of Damped Lyman- systems, which are difficult to reconcile with the standard Fall-Efstathiou picture of disk formation (Maller et al. 2001).
We also presented a prediction for the redshift evolution of the average rotation velocity at (close to the maximum of the rotation curve) for disks of fixed stellar mass (i.e., the zeropoint of the Tully-Fisher relation). We found a similar result as we did for the disk sizes: decreases with time, but much more slowly than we would expect if we assumed that . The physical reason for this is the same as the one we have discussed in relation to the weak size evolution: halos have lower concentrations at high redshift, and thus less mass near the center and so lower rotation speeds at the radii where rotation velocities are measured (near the maximum value of the rotation curve, ).Thus even for pure DM NFW halos, without accounting for baryons, evolves more slowly than (Bullock et al. 2001b). In addition, in our model, lower concentrations lead to less contraction and more extended disks. This leads to flatter, less “peaky” rotation curves, and lower values of relative to a more concentrated halo (Mo et al. 1998; Klypin et al. 2002).
About the same fraction of disks are classified as unstable according to the condition we adopted () over the whole redshift interval , and the exclusion of unstable disks from the sample changes the average size by nearly the same amount over this interval as well. Therefore, as implemented here, disk stability does not play a significant role in determining the relative time evolution of the stellar mass-size relation, although it is important for reproducing the correct distribution of disk stellar surface densities. At very high redshifts, , our model predicts that the number of unstable disks starts to increase. However, we do not even know that thin, rotationally supported disks exist at such high redshifts, so we do not know how seriously to take this prediction.
While the model presented here represents a significant improvement with respect to the overly simplified scaling commonly used in the literature, it still neglects many important aspects of disk formation in a hierarchical universe, in particular the impact of mergers. We have also ignored the possible presence of spheroids and cold gas in our disk galaxies. As well, the fraction of baryons in the disk component as a function of halo mass (), here assumed to be a simple deterministic function, almost certainly has a large scatter and may change systematically with time. We intend to investigate the predictions of more detailed models, set within hierarchical merger trees, and including a full treatment of cooling, star formation, feedback, etc., in a future work, in which we will also explore the redshift evolution of the disk size function (Somerville et al., in prep).
Acknowledgments
Based on observations taken with the NASA/ESA Hubble Space Telescope, which is operated by the Association of Universities for Research in Astronomy, Inc. (AURA) under NASA contract NAS5-26555. Support for the GEMS project was provided by NASA through grant number GO-9500 from the Space Telescope Science Institute, which is operated by the Association of Universities for Research in Astronomy, Inc., for NASA under contract NAS5-26555. Support for this work also came from HST Archival Grant AR-10290. SFS acknowledges financial support provided through the European Community’s Human Potential Program under contract HPRN-CT-2002-00305, Euro3D RTN. EFB is supported by the DFG’s Emmy Noether Program. CW was supported by a PPARC Advanced Fellowship. SJ acknowledges support from the National Aeronautics and Space Administration (NASA) under LTSA Grant NAG5-13063 issued through the Office of Space Science. DHM acknowledges support from the National Aeronautics and Space Administration (NASA) under LTSA Grant NAG5-13102 issued through the Office of Space Science. CH is supported by a CITA National Fellowship. KJ acknowledges support by the German DFG under grant SCHI 536/3-1.
Funding for the Sloan Digital Sky Survey (SDSS) has been provided by the Alfred P. Sloan Foundation, the Participating Institutions, the National Aeronautics and Space Administration, the National Science Foundation, the U.S. Department of Energy, the Japanese Monbukagakusho, and the Max Planck Society. The SDSS Web site is http://www.sdss.org/. The SDSS is managed by the Astrophysical Research Consortium (ARC) for the Participating Institutions. The Participating Institutions are The University of Chicago, Fermilab, the Institute for Advanced Study, the Japan Participation Group, The Johns Hopkins University, Los Alamos National Laboratory, the Max-Planck-Institute for Astronomy (MPIA), the Max-Planck-Institute for Astrophysics (MPA), New Mexico State University, University of Pittsburgh, Princeton University, the United States Naval Observatory, and the University of Washington.
References
- Avila-Reese et al. (1998) Avila-Reese, V., Firmani, C., & Hernández, X. 1998, ApJ, 505, 37
- Barden et al. (2005) Barden, M. et al. 2005, ApJ, 635, 959
- Bell et al. (2003) Bell, E. F., McIntosh, D. H., Katz, N., & Weinberg, M. D. 2003, ApJS, 149, 289
- Binney & Tremaine (1987) Binney, J. & Tremaine, S. 1987, Galactic Dynamics (Princeton, NJ: Princeton Univ. Press)
- Blanton et al. (2005) Blanton, M. R. et al. 2005, AJ, 129, 2562
- Blumenthal et al. (1986) Blumenthal, G., Faber, S., Flores, R., & Primack, J. 1986, ApJ, 301, 27
- Borch et al. (2006) Borch, A. et al. 2006, A&A, 453, 869
- Bullock et al. (2001a) Bullock, J. S., Dekel, A., Kolatt, T. S., Kravtsov, A. V., Klypin, A. A., Porciani, C., & Primack, J. R. 2001a, ApJ, 555, 240
- Bullock et al. (2001b) Bullock, J. S. et al. 2001b, MNRAS, 321, 559
- Burstein et al. (1997) Burstein, D., Bender, R., Faber, S., & Nolthenius, R. 1997, AJ, 114, 1365
- Caldwell et al. (2006) Caldwell, J. A. R. et al. 2006, ApJ, submitted, astro-ph/0510782
- Christodoulou et al. (1995) Christodoulou, D., Shlosman, I., & Tohline, J. 1995, ApJ, 443, 551
- Conselice et al. (2005) Conselice, C. J., Bundy, K., Ellis, R. S., Brichmann, J., Vogt, N. P., & Phillips, A. C. 2005, ApJ, 628, 160
- Croton et al. (2006) Croton, D. J., Springel, V., White, S. D. M., De Lucia, G., Frenk, C. S., Gao, L., Jenkins, A., Kauffmann, G., et al. 2006, MNRAS, 365, 11
- Dalcanton et al. (1997) Dalcanton, J., Spergel, D., & Summers, F. 1997, ApJ, 482, 659
- Dekel & Silk (1986) Dekel, A. & Silk, J. 1986, ApJ, 303, 39
- Dutton et al. (2007) Dutton, A. A., van den Bosch, F. C., Dekel, A., & Courteau, S. 2007, ApJ, 654, 27
- Efstathiou et al. (1982) Efstathiou, G., Lake, G., & Negroponte, J. 1982, MNRAS, 199, 1069
- Eke et al. (2001) Eke, V. R., Navarro, J. F., & Steinmetz, M. 2001, ApJ, 554, 114
- Fall & Efstathiou (1980) Fall, S. & Efstathiou, G. 1980, MNRAS, 193, 189
- Ferguson et al. (2004) Ferguson, H. C. et al. 2004, ApJ, 600, L107
- Flores et al. (1993) Flores, R., Primack, J., Blumenthal, G., & Faber, S. 1993, ApJ, 412, 443
- Giavalisco et al. (1996) Giavalisco, M., Steidel, C., & Macchetto, D. 1996, ApJ, 470, 189
- Gnedin et al. (2004) Gnedin, O. Y., Kravtsov, A. V., Klypin, A. A., & Nagai, D. 2004, ApJ, 616, 16
- Gnedin et al. (2006) Gnedin, O. Y., Weinberg, D. H., Pizagno, J., Prada, F., & Rix, H.-W. 2006, ArXiv Astrophysics e-prints
- Governato et al. (2004) Governato, F. et al. 2004, ApJ, 607, 688
- Häussler et al. (2006) Häussler, B. et al. 2006, ApJ, submitted
- Jesseit et al. (2002) Jesseit, R., Naab, T., & Burkert, A. 2002, ApJ, 571, L89
- Jing (2000) Jing, Y. P. 2000, ApJ, 535, 30
- Kassin et al. (2007) Kassin, S. A., Weiner, B. J., Faber, S. M., Koo, D. C., Lotz, J. M., Diemand, J., Harker, J. J., Bundy, K., et al. 2007, ApJ, 660, L35
- Kauffmann (1996) Kauffmann, G. 1996, MNRAS, 281, 475
- Kauffmann et al. (1999) Kauffmann, G., Colberg, J. M., Diaferio, A., & White, S. D. M. 1999, MNRAS, 303, 188
- Kazantzidis et al. (2005) Kazantzidis, S. et al. 2005, ApJ, 623, L67
- Klypin et al. (2002) Klypin, A., Zhao, H., & Somerville, R. S. 2002, ApJ, 573, 597
- Kroupa (2001) Kroupa, P. 2001, MNRAS, 322, 231
- Lilly et al. (1998) Lilly, S. et al. 1998, ApJ, 500, 75
- Lowenthal et al. (1997) Lowenthal, J. et al. 1997, ApJ, 481, 673
- Macció et al. (2006) Macció, A., Dutton, A., van den Bosch, F., Moore, B., Potter, D., & Stadel, J. 2006, /mnras, in press, astro-ph/0608157
- Maller & Dekel (2002) Maller, A. H. & Dekel, A. 2002, MNRAS, 335, 487
- Maller et al. (2001) Maller, A. H., Prochaska, J. X., Somerville, R. S., & Primack, J. R. 2001, MNRAS, 326, 1475
- Mao et al. (1998) Mao, S., Mo, H. J., & White, S. D. M. 1998, MNRAS, 297, L71
- Mo et al. (1998) Mo, H., Mao, S., & White, S. 1998, MNRAS, 295, 319
- Natarajan (1999) Natarajan, P. 1999, ApJ, 512, L105
- Navarro et al. (1997) Navarro, J. F., Frenk, C. S., & White, S. D. M. 1997, ApJ, 490, 493
- Navarro & Steinmetz (2000) Navarro, J. F. & Steinmetz, M. 2000, ApJ, 538, 477
- Navarro & White (1994) Navarro, J. F. & White, S. D. M. 1994, MNRAS, 267, 401
- Peebles (1969) Peebles, P. J. E. 1969, ApJ, 155, 393
- Pizagno et al. (2006) Pizagno, J. et al. 2006, preprint, astro-ph/0608472
- Ravindranath et al. (2004) Ravindranath, S. et al. 2004, ApJ, 604, L9
- Rix et al. (2004) Rix, H.-W. et al. 2004, ApJS, 152, 163
- Robertson et al. (2006) Robertson, B., Bullock, J. S., Cox, T. J., Di Matteo, T., Hernquist, L., Springel, V., & Yoshida, N. 2006, ApJ, 645, 986
- Robertson et al. (2004) Robertson, B., Yoshida, N., Springel, V., & Hernquist, L. 2004, ApJ, 606, 32
- Sargent et al. (2006) Sargent, M. T., Carollo, C. M., Lilly, S. J., Scarlata, C., Feldmann, R., Kampczyk, P., Koekemoer, A. M., Scoville, N., et al. 2006, ArXiv Astrophysics e-prints
- Shen et al. (2003) Shen, S. et al. 2003, MNRAS, 343, 978
- Sheth & Tormen (1999) Sheth, R. K. & Tormen, G. 1999, MNRAS, 308, 119
- Simard et al. (1999) Simard, L. et al. 1999, ApJ, 519, 563
- Somerville & Primack (1999) Somerville, R. & Primack, J. 1999, MNRAS, 310, 1087
- Sommer-Larsen et al. (1999) Sommer-Larsen, J., Gelato, S., & Vedel, H. 1999, ApJ, 519, 501
- Spergel et al. (2006) Spergel, D. N., Bean, R., Doré, O., Nolta, M. R., Bennett, C. L., Dunkley, J., Hinshaw, G., Jarosik, N., et al. 2006, ArXiv Astrophysics e-prints
- Springel & Hernquist (2005) Springel, V. & Hernquist, L. 2005, ApJ, 622, L9
- Syer et al. (1999) Syer, D., Mao, S., & Mo, H. J. 1999, MNRAS, 305, 357
- Trujillo et al. (2004) Trujillo, I. et al. 2004, ApJ, 604, 521
- Trujillo et al. (2006) —. 2006, ApJ, 650, 18
- van den Bosch (2000) van den Bosch, F. C. 2000, ApJ, 530, 177
- Wechsler et al. (2002) Wechsler, R. H., Bullock, J. S., Primack, J. R., Kravtsov, A. V., & Dekel, A. 2002, ApJ, 568, 52
- Weil et al. (1998) Weil, M. L., Eke, V. R., & Efstathiou, G. 1998, MNRAS, 300, 773
- Wolf et al. (2004) Wolf, C. et al. 2004, A&A, 421, 913