Observation of very high energy -rays from the AGN 1ES 2344+514 in a low emission state with the MAGIC telescope
Abstract
The MAGIC collaboration has observed very high energy gamma ray emission from the AGN 1ES 2344+514. A gamma-ray signal corresponding to an excess and an integral flux of above 200 GeV has been obtained from 23.1 hours of data taking between 2005 August 3 and 2006 January 1. The data confirm the previously detected gamma-ray emission from this object during a flare seen by the Whipple collaboration in 1995 and the evidence (below significance level) from long-term observations conducted by the Whipple and HEGRA groups. The MAGIC observations show a relatively steep differential photon spectrum that can be described by a power law with a photon index of between 140 GeV and 5.4 TeV. The observations reveal a low flux state, about six times below the 1995 flare seen by Whipple and comparable with the previous Whipple and HEGRA long-term measurements. During the MAGIC observations no significant time variability was observed.
Subject headings:
gamma rays: observations, BL Lacertae objects: individual (1ES 2344+514)1. Introduction
All but one of the detected extragalactic very high energy (VHE) gamma () ray sources so far are active galactic nuclei (AGN) of the BL Lac type. These objects are characterized by a highly variable electromagnetic emission ranging from radio to -rays, and by continuum spectra dominated by non-thermal emission that consist of two distinct broad components. While the low energy bump is thought to arise dominantly from synchrotron emission of electrons, the origin of the high-energy bump is still debated. Leptonic models ascribe it to inverse Compton processes that either up-scatter synchrotron photons (synchrotron-self Compton [SSC] models, Marscher & Gear 1985, Maraschi et al. 1992), or to external photons that originate from the accretion disk (Dermer & Schlickeiser, 1993), from nearby massive stars, or are reflected into the jet by surrounding material (Sikora et al., 1994). In hadronic models, interactions of a highly relativistic jet outflow with ambient matter (Dar & Laor, 1997; Bednarek, 1993), proton-induced cascades (Mannheim, 1993), synchrotron radiation off protons (proton synchrotron blazar; Aharonian 2000; Mücke & Protheroe 2001), or curvature radiation, are responsible for the high energy photons. The prime scientific interest in BL Lac objects is twofold: (1) to understand the VHE -ray production mechanisms, assumed to be linked to the massive black hole in the center of the AGN, and (2) to use the VHE -rays as a probe of the extragalactic background light (EBL) spectrum between about to wavelength. In the past, most of the VHE -ray emitting AGN were discovered during phases of high activity, biasing our current observational record towards high emission states. Although these sources also show variability in the X-ray, optical, and radio domain, the VHE variability is observed to often be the most intense and violent one. While fast variability on the timescale of 10 minutes has been observed for Mkn 501 in the X-ray domain (Xue & Cui, 2005), flux doubling times well below 5 minutes were recently also found in the VHE domain (Gaidos et al., 1996; Albert et al., 2007c). Many of the observed AGN are presumably visible only during a state of high activity. It still remains an open question whether these sources are only temporarily active and are completely inactive between times of flaring, or if there also exists a state of low but continuous -ray emission. In addition, the temporal and spectral properties of such a low VHE -ray emission state is mostly elusive as of to date. It is quite conceivable that, compared to a low state, the flare emission state is either due to a different population of accelerated particles or originates from a different region in the AGN, or both.
In the first year of operation of the Major Atmospheric Gamma Imaging Cerenkov (MAGIC) Telescope a program has been started to search for new low and medium redshift blazars emitting at VHE -rays (Albert et al. 2006b; 2006c; 2007a). In addition, known VHE AGNs were monitored in order to study common features of their -ray emission, as well as the properties of the low-emission state (Albert et al. 2006a; 2007b; 2007c).
A good candidate for detailed studies is 1ES 2344+514. This AGN belongs to a type of blazars in which the synchrotron emission peaks at UV/X-ray frequencies (the so-called high-energy peak BL Lacs [HBLs] e.g. Urry & Padovani 1995), as opposed to the blazars with the synchrotron peak located at IR/visible frequencies. Along with Mkn 501 and H 1426+428, it represents extreme BL Lac objects, in which the synchrotron peak energy exceeds 10 keV, in particular during strong flares (Costamante et al., 2001). 1ES 2344+514 was detected during the Einstein Slew Survey (Elvis et al., 1992) in the energy range between 0.2 and 4 keV. It was identified as a BL Lac object by Perlman et al. (1996), who also determined a redshift of . Its black hole mass was estimated to be (Barth et al., 2003). Early BeppoSAX observations (Giommi et al., 2000) revealed a large 0.110 keV flux variability on timescales of a few hours. Follow-up observations in 1998 found the object in a very low state with the synchrotron peak shifted by a factor of 20 towards lower energies and the corresponding integral flux decreased by a factor of 4.5. Giommi et al. (2000) interpreted the observations with one electron population being responsible for the steady low energy synchrotron emission and another electron component producing higher energy X-rays with high time variability. The latter component should be responsible for VHE -ray emission via inverse Compton (IC) scattering. EGRET did not detect any signal from 1ES 2344+514, giving an upper limit of at its peak response energy of 300 MeV (Fichtel et al., 1994). During the winter of 1995/1996, the Whipple collaboration reported a excess signal from 1ES 2344+514 above 350 GeV from 20.5 hours observation time (Catanese et al., 1998). The observed flux was highly variable, with the most significant signal occurring during a flare on 1995 December 20, while all the remaining data combined led to an only marginal () excess, i.e. below the canonical detection limit used in ground-based VHE -ray astronomy. The 0.812.6 TeV differential spectrum measured by the Whipple collaboration during the flare had a power-law index of (Schroedter et al., 2005). One year later another search did not reveal any VHE -ray emission. The HEGRA collaboration also searched for VHE -ray emission above 800 GeV. A deep exposure of 72.5 h indicated a signal at a significance level of (Aharonian et al., 2004).
Here we present MAGIC telescope observations of 1ES 2344+514. We briefly discuss the observational technique used and the implemented data analysis procedure, derive a VHE -ray spectrum of the source, and put the results into perspective with other VHE -ray observations of this AGN. An SSC model is used to describe the wide-range spectral energy distribution (SED).
2. Observations
The observations were performed between 2005 August 3 and 2005 September 29, and between 2005 November 11 and 2006 January 1, using the MAGIC Telescope on the Canary island of La Palma (N, W, 2200 m above sea level), from where 1ES 2344+514 can be observed at zenith distances above . The essential parameters of the currently largest air Cherenkov telescope are a 17 m ø segmented mirror of parabolic shape, an of 1.05 and a hexagonally shaped camera with a field of view (FOV) of mean diameter. The camera comprises 576 pixels composed of hemispherical, six dynode photomultipliers augmented in sensitivity by a diffuse lacquer doped with a wavelength shifter (Paneque et al., 2004) and by so-called light catchers. In separate measurements a total gain of 2 has been determined. 180 pixels of ø surround the inner section of the camera, which consists of 394 pixels of ø ( ø FOV). The trigger is formed by a coincidence of neighboring pixels. The overall Cherenkov photon ( nm) to photoelectron conversion ratio is . The point spread function (PSF) of the main mirror is , while 90% of the light of a source at infinity is focussed onto a disk with ø. Further details of the telescope parameters and performance can be found in Baixeras et al. (2004); Cortina et al. (2005).
1ES 2344+514 was observed for 32 hours in total, distributed over 27 days between 2005 August and the first days of 2006 January at zenith angles ranging from to . The observations were carried out in wobble mode (Fomin et al., 1994), i.e. by alternatingly tracking two positions at offset from the camera center. This observation mode allows a reliable background estimation for point sources.
Simultaneous -band observations of 1ES 2344+514 were conducted in the framework of the Tuorla Observatory blazar monitoring program111See http://users.utu.fi/kani/1m/. with the KVA 35 cm telescope222See http://tur3.tur.iac.es/. on La Palma and the 1.03 m telescope at Tuorla Observatory, Finland.
3. Data Analysis
The data analysis was carried out using the standard MAGIC analysis and reconstruction software (Bretz & Wagner, 2003). After calibration (Gaug et al., 2005), the images were cleaned by requiring a minimum number of seven photoelectrons (core pixels) and five photoelectrons (boundary pixels), see e.g. Fegan (1997). These tail cuts are scaled accordingly for the larger size of the outer pixels of the MAGIC camera. The data were filtered by rejecting trivial background events, such as accidental noise triggers, triggers from nearby muons or data taken during adverse conditions (low atmospheric transmission, car light flashes etc.). Light clusters, either from large angle shower particles or from the night sky light background (stars), well separated from the main image, were removed from the images. For the events included in the analysis, the mean trigger rate was required to be constant within . In order to improve the comparability of the two data sets from summer and winter 2005 we restricted the maximum zenith angle to . From the remaining events, corresponding to 23.1 h observation time, image parameters were calculated (Hillas, 1985) such as WIDTH, LENGTH, SIZE, CONC, and M3LONG, the third moment of the light distribution along the major image axis. For the /hadron separation a multidimensional classification procedure based on the random forest method was employed (Breiman, 2001; Bock et al., 2004). The separation procedure was trained using a sample of Monte Carlo (MC) generated -ray shower images (Heck et al., 1998; Majumdar et al., 2005) on the one hand and about 1% randomly selected events from the measured wobble data representing the hadronic background on the other hand. The MC -ray showers were generated between zenith angles of 24∘ and 34∘ with energies between 10 GeV and 30 TeV. Every event was assigned a parameter called hadronness (), which is a measure for the probability that it is a hadronic (background) event. The final separation was achieved by a cut in . The same cut procedure was applied to the final 1ES 2344+514 sample. The arrival directions of the showers in equatorial coordinates were calculated using the DISP method (Fomin et al., 1994; Lessard et al., 2001; Domingo-Santamaría et al., 2005). The energy of the primary -ray was reconstructed from the image parameters again using the random forest method and taking into account the full instrumental energy resolution.
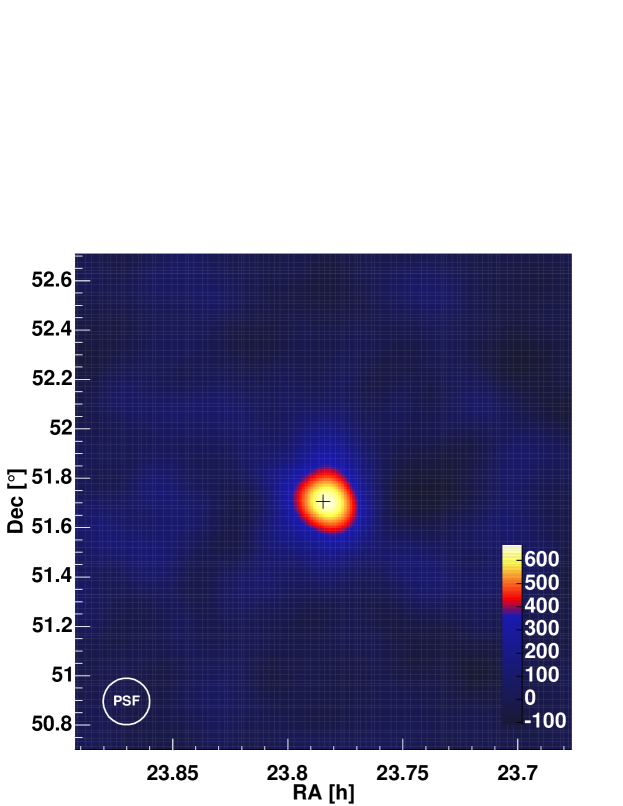
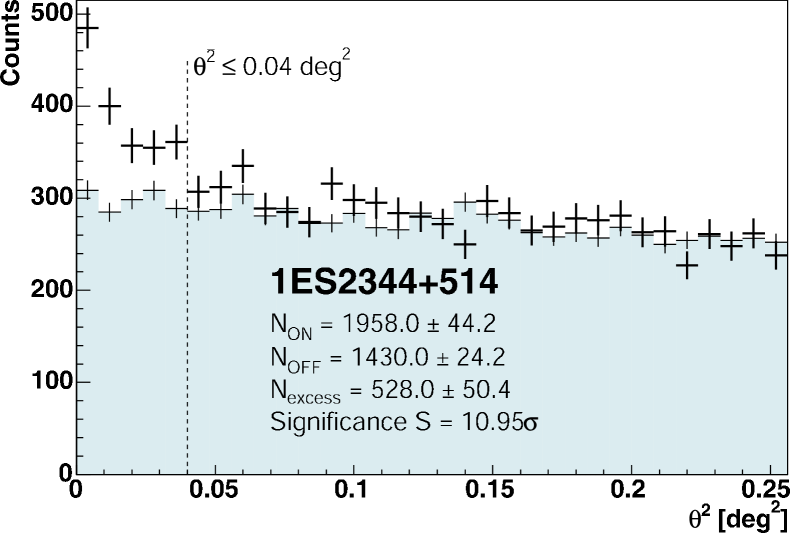
Fig. 1 shows a section of the sky around the 1ES 2344+514 position. The nominal source position is marked by a cross. A clear excess is visible in the data, the maximum of which is located at (RA,Dec)= (the errors only include the determination accuracy of the position). The extension of the excess and the small deviation from the nominal position are consistent with the PSF and the tracking error of of the telescope (Bretz et al., 2003), respectively. To calculate the significance of the observed -ray excess, the squared angular distance between the reconstructed shower direction and the object position () as shown in Fig. 2 is used. In this representation, the background is expected to be flat for the case of a very large diameter camera. In the analysis, three background regions of the same size chosen symmetrically with the source position around the camera center were used for a simultaneous determination of the background. The background control data sample was normalized to the on-source sample between . The reason of the slow but steady drop in the background is the drop in acceptance towards the camera boundary. The observed excess signal of 528 events below corresponds to an excess according to eq. 17 in Li & Ma (1983). An independent analysis using other cuts, a different reconstruction algorithm and a different /hadron optimization procedure, revealed a comparable (within statistics) significance. While for the sky map and the plot a fixed, tight cut was applied, the final separation for the spectral analysis and the light curve was done using a looser, energy-dependent cut in , requiring that about 60% of the MC events survive.
As the analyzed data comprise 21 observation nights, it is possible to check the light curve for possible flux variability. On a diurnal basis, the 200 GeV light curve (Fig. 3) shows small changes and trends beyond those expected from statistical fluctuations. The structure observed during MJD 5358053600 is compatible with a constant-flux ansatz (dof), while from MJD 53726.8253726.90 a flux of above the average flux inferred from the surrounding days MJD 5372053740, (dof=4.9/7), was found. Note that the probability for finding such an excess in the 21 observation nights is around . No significant variability within this observation night, encompassing 1.13 hours of effective observation time, can be claimed.
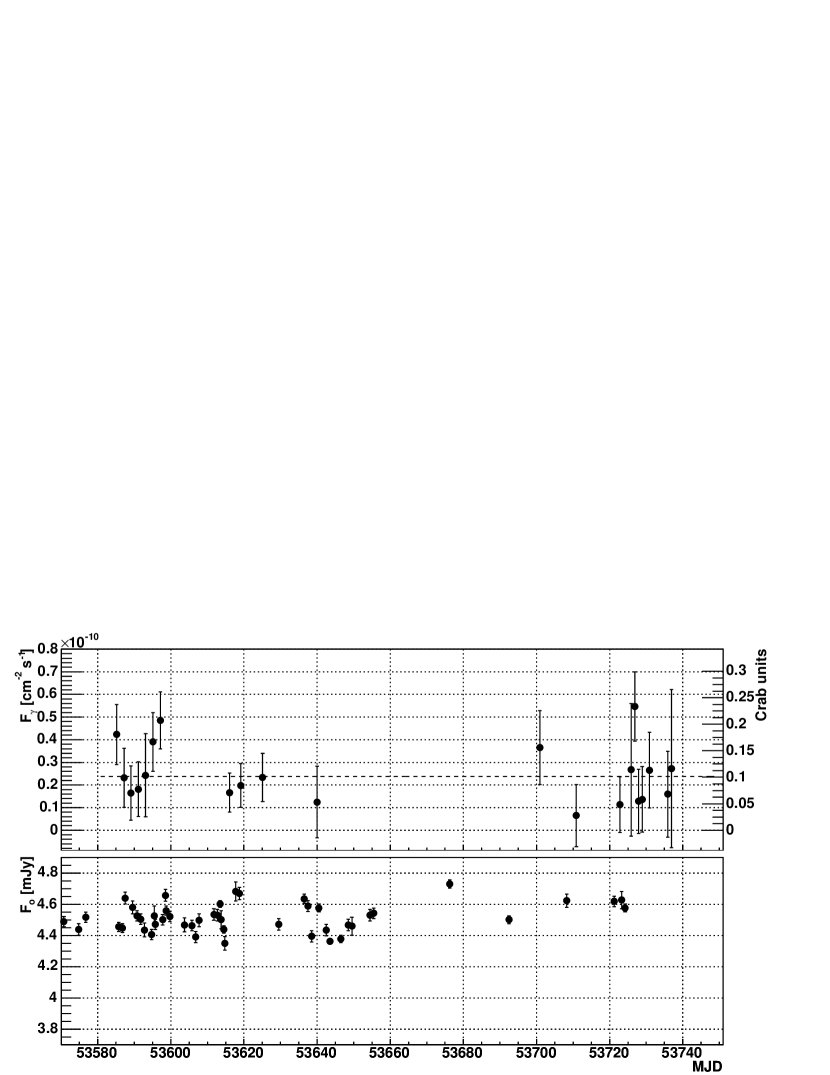
The observation time can be split into three observation periods (Table 1). Together with the VHE -ray light curve, an -band optical light curve is shown. Simultaneous X-ray data are only available from the ASM instrument333Data available at http://xte.mit.edu/. (Levine et al., 1996) on board the Rossi X-ray Timing Explorer, the sensitivity of which, however, would be hardly sufficient to resolve the expected keV flux even during flaring states of 1ES 2344+514, like those observed with BeppoSAX (Giommi et al., 2000).
| Period | Obs. time | ndf | |
|---|---|---|---|
| (MJD) | () | ||
| 6.37 h | |||
| 8.06 h | |||
| 8.66 h | |||
| Combined | 23.09 h |
Summing up all the data we determined an integral flux above 200 GeV of
The relatively large systematic error is a consequence of the steep spectral slope (see below). The main contributions to the systematic error are the uncertainties in the atmospheric transmission, the reflectivity (including stray-light losses) of the main mirror and the light catchers, the photon to photoelectron conversion calibration, and the photoelectron collection efficiency in the photomultiplier front end. Also, MC uncertainties and systematic errors from the analysis methods contribute significantly to the error. The above quoted flux corresponds to of the integral Crab Nebula flux in the same energy range.
During our observations we also checked the optical variability. When correcting for the contribution of the host galaxy of 3.7 mJy (Nilsson et al., 2006), variations in the optical light curve around the average brightness of are seen, which are significant given the small errors () of the data points. Possible VHE -ray variations on a comparable level are below the sensitivity of MAGIC on the given timescale.
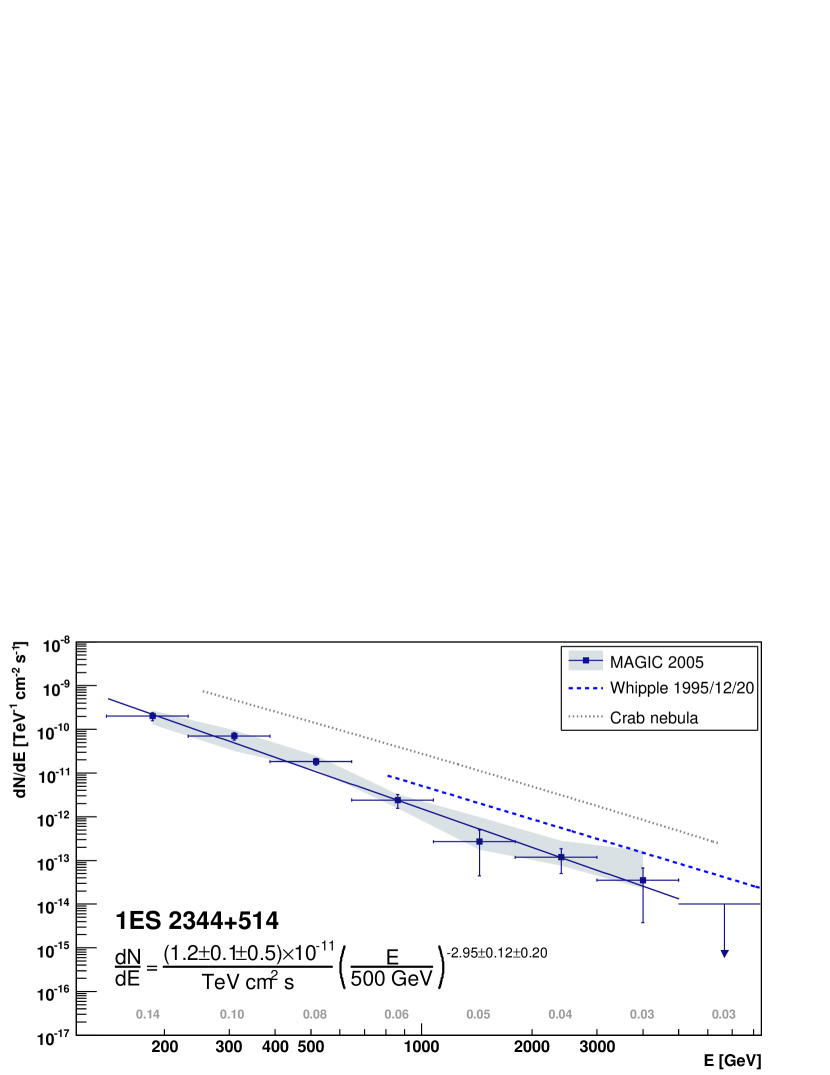
For each of the three observation periods photon spectra were determined. These are well described by simple power laws between 140 GeV and at least 1.0 TeV and are, within errors, compatible with no change in the spectral index. Finally, all data were combined for the calculation of a differential photon spectrum (Table 2). The reconstructed spectrum after unfolding with the instrumental energy resolution (Anykeyev et al., 1991; Mizobuchi et al., 2005) is shown in Figure 4. A simple power law fit to the data between 140 GeV and 5.4 TeV yields
with a reduced /dof of 8.56/5, indicating a reasonable description of the data by the fit. For comparison, the Whipple measurement of the 1ES 2344+514 spectrum during the flare of 1995 December 20 (Schroedter et al., 2005) and the Crab Nebula spectrum (Wagner et al., 2005) as obtained with MAGIC are also shown in Fig. 4. Note that the integral flux is in very good agreement with the HEGRA measurements from 1998 to 2002 (Aharonian et al., 2004).
| Mean energy | Bin Width | Flux | Stat. Error | Syst. Error | |
|---|---|---|---|---|---|
| [GeV] | [GeV] | [TeV-1 cm-2 s-1] | |||
| 186 | 93 | E-10 | 4.2E-11 | +7.0E-11 | -7.0E-11 |
| 310 | 155 | E-11 | 1.4E-11 | +3.8E-11 | -2.4E-11 |
| 516 | 259 | E-11 | 3.2E-12 | +6.4E-12 | -6.4E-12 |
| 861 | 431 | E-12 | 8.6E-13 | +8.4E-13 | -8.4E-13 |
| 1437 | 720 | E-13 | 2.2E-13 | +9.4E-14 | -7.1E-13 |
| 2397 | 1201 | E-13 | 6.8E-14 | +4.1E-14 | -1.6E-13 |
| 3999 | 2003 | E-14 | 3.2E-14 | +1.2E-14 | -1.3E-13 |
| 6670 | 3341 | E-15 | (95% C. L.) | ||
4. Discussion
We observed a highly significant VHE -ray emission from the blazar 1ES 2344+514. The flux exhibited no significant variations on a timescale of days, with one night showing a higher flux level (by a factor of 2) as compared to the surrounding nights; such a variation is statistically expected to occur with a 34.4% probability in 21 observation nights. The observed flux was lower by a factor of than the one observed by the Whipple collaboration during a flare on 1995 December 20. The spectrum is softer than the Crab Nebula spectrum and also softer than the flare spectrum observed by the Whipple collaboration.
4.1. Long-term VHE Light Curve
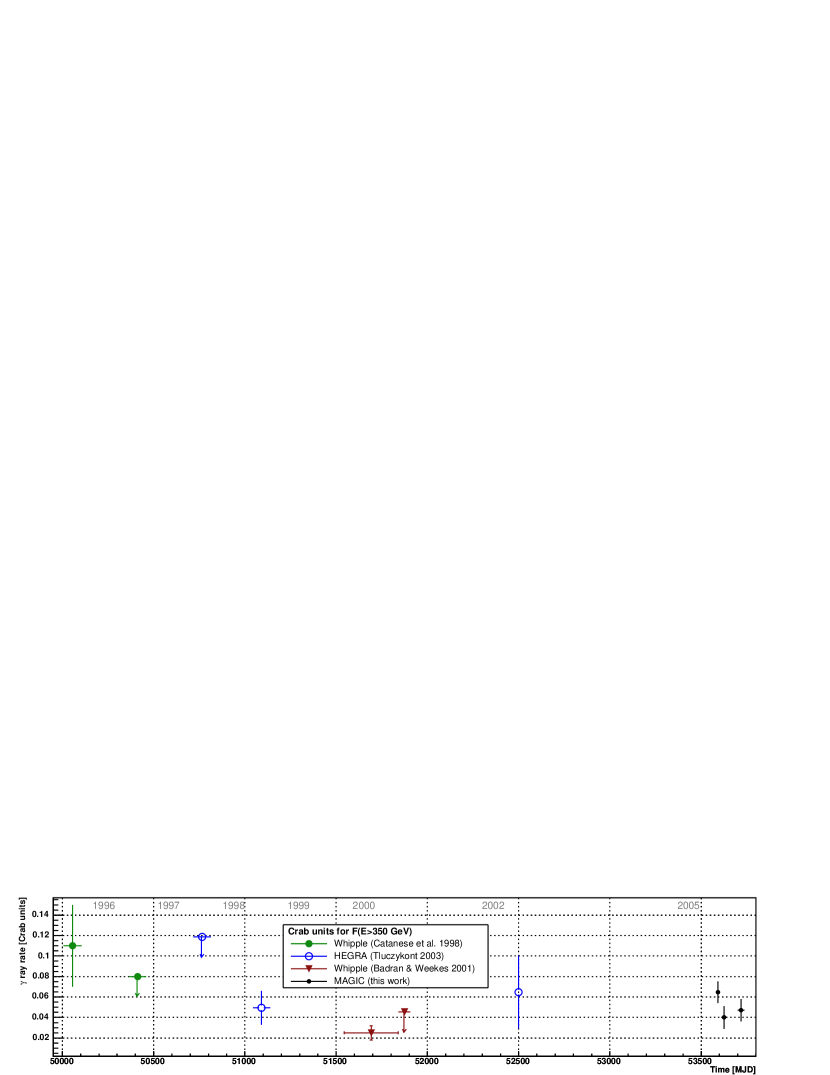
In Fig. 5 we show a light curve including all reported VHE -ray measurements and upper limits for 1ES 2344+514. These data have been normalized to an integral Crab flux ; the fluxes given in the literature were extrapolated, if necessary, using the spectral index found in this paper (in the following, “Crab units” refer to this energy threshold). Except for the 1995 December 20 flare and the MAGIC data, all these measurements are on the sensitivity level of the respective instruments. Therefore, none of the latter data points exceeds a significance of . All reported observations with significances below (95% probability) were converted to upper flux limits.
In 1995/1996, Whipple discovered 1ES 2344+514 at a flux level of Crab units at GeV, except for the 1995 December flare, when Crab units were obtained (Catanese et al., 1998). Follow-up observations by Whipple and HEGRA in 1996-1998 yielded upper limits of and Crab units, respectively. In 1998 and 2002, the object was observed for almost 60 h by HEGRA resulting, when combined, in a flux of Crab units at GeV (Tluczykont, 2003), which translates to Crab units when extrapolating to GeV. From observations of 1ES 2344+514 in 2002, the Whipple group could infer a low flux level of Crab units with a marginal significance of (Badran & Weekes, 2001) at GeV.
While the Whipple and HEGRA measurements allowed to conclude on a emission level of Crab units only after long observation times, the MAGIC observations obtained in this paper are the first time-resolved measurements at this emission level for 1ES 2344+514. We find the flux of 1ES 2344+514 to be Crab units for GeV, which is well in line with the HEGRA 1997-2002 evidence.
In previous observations of 1ES 2344+514 it was not possible to infer temporal characteristics of the found VHE -ray emission level. With MAGIC, this level can be detected with only a few hours of observations, enabling studies of the VHE -ray variability properties of this object over a significant part of its dynamical range. Thus, 1ES 2344+514 adds to the small group of blazars for which such studies are now possible on a diurnal basis—Mkn 421 (Albert et al., 2006c), Mkn 501 (Albert et al., 2007c), and PKS 2155-304 (Aharonian et al., 2005).
4.2. Intrinsic Energy Spectrum
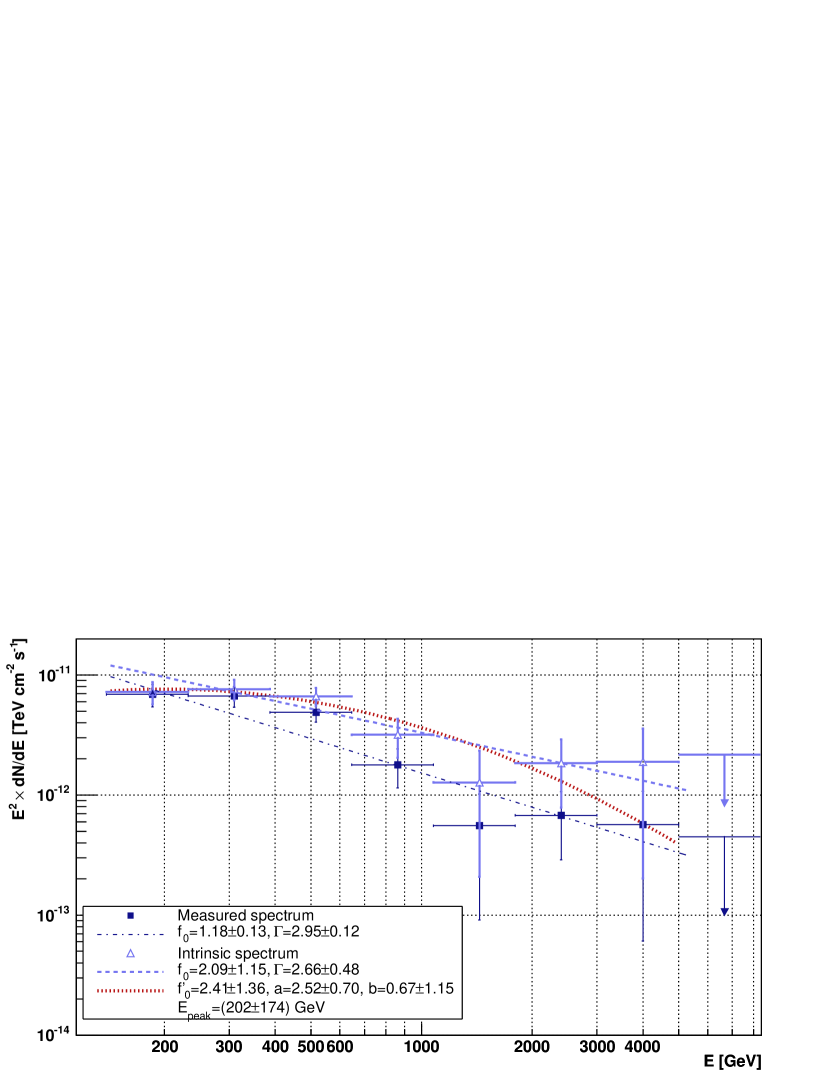
Having to traverse a cosmological distance corresponding to a redshift of , the -rays emitted by 1ES 2344+514 interact with the low energy photons of the EBL (see, e.g., Nikishov 1962; Gould & Schréder 1966; Hauser & Dwek 2001). The predominant reaction leads to an attenuation of the intrinsic spectrum that can be described by
| (1) |
with the observed spectrum , and the energy-dependent optical depth . Here we use the “best-fit” model of Kneiske et al. (2004), which yields an EBL spectrum that agrees with alternative models, e.g. Stecker et al. (2006). Using this EBL spectrum and a state-of-the-art cosmology (flat universe, Hubble constant , matter density , and dark energy density ), we calculate the optical depth for the distance of 1ES 2344+514. Thereby we use the numerical integration given by eq. 2 in Dwek & Krennrich (2005). The reconstructed intrinsic source spectrum is shown along with the measured spectrum in Fig. 6. The intrinsic source spectrum can be described by a simple power law of the form
between 140 GeV and 5.4 TeV (). The spectrum shows a tendency to flatten towards low energies. A fit with a logarithmic curvature term, which corresponds to a parabolic law in a vs. representation (power law index ; Massaro et al. 2004), shows a clear curvature and enables locating the peak at GeV. The peak is obviously badly determined as the turnover of the spectrum, presumably around GeV, is not observed unambiguously.
4.3. Spectral Energy Distribution
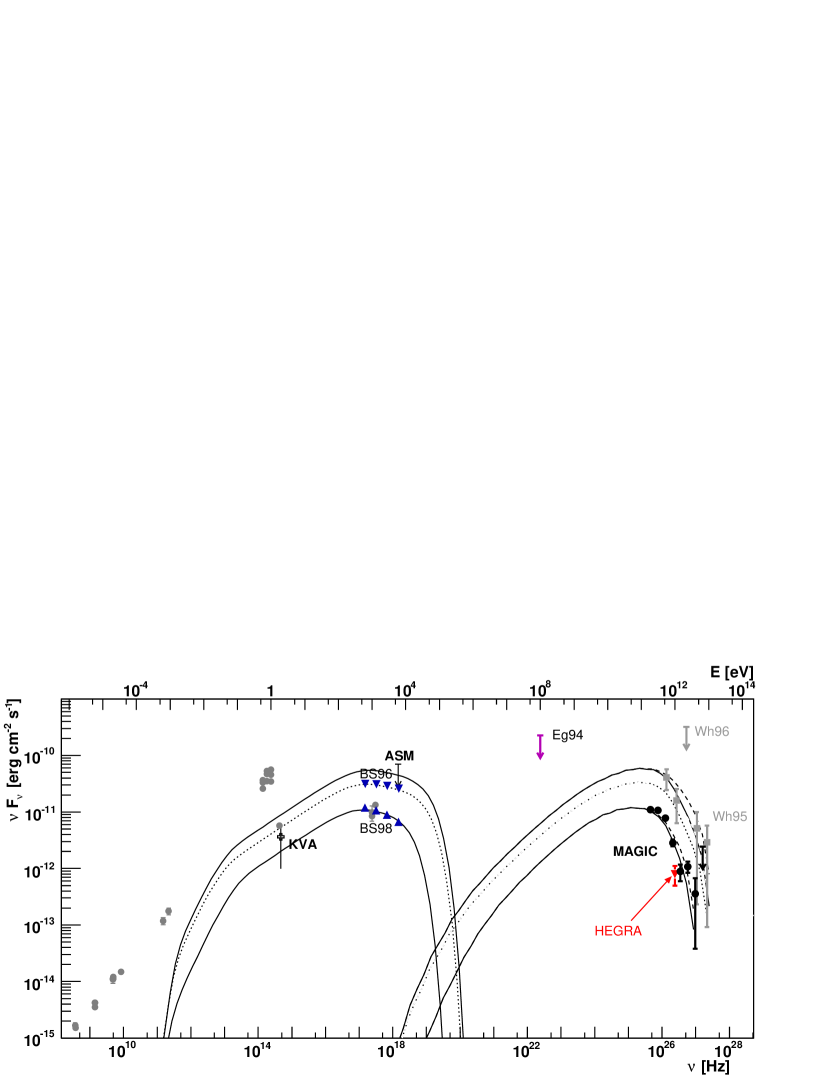
The spectral energy distribution for 1ES 2344+514 is shown in Fig. 7. Apart from the VHE -ray observations by MAGIC, Whipple, and HEGRA, the X-ray measurements performed by Einstein, ROSAT, and BeppoSAX and an upper limit from EGRET are the most relevant measurements for modeling the SED. The figure also includes optical and radio measurements. The latter however cannot be described by the homogeneous one-zone SSC model provided by Krawczynski et al. (2004) that was used here, as the radio emission is thought to arise from a larger volume in the jet than the VHE -ray emission and as self-absorption effects are not accounted for.
Two BeppoSAX data sets are shown: one was obtained simultaneously with Whipple observations on 1996 December 5. The second set was taken during a quiescent period of 1ES 2344+514, and represents a rather low X-ray emission state of the object, although it might not necessarily correspond to its state during the MAGIC measurements. It should be emphasized that most of the data points shown in the SED were not measured simultaneously, which makes the SED modeling very difficult. The input parameters of the homogeneous SSC model are the radius of the spherically assumed emission region , the Doppler factor , the magnetic field strength in the acceleration region, the density of the electrons responsible for the -ray emission as well as two spectral slopes and a spectral cutoff of the electron spectrum. The size of the emission region was chosen such that it can account for day-scale variability along with the Doppler factor chosen, with and in units of days. The parameters used here are specified in Table 3.
| SSC model input | Low state | Flare SED |
|---|---|---|
| parameter | SED (MAGIC) | |
| Doppler factor | 8.4 | 15.2 |
| Magnetic field strength | 0.095 G | 0.075 G |
| Emission region radius | cm | cm |
| Electron density | 0.025 erg cm-3 | 0.025 erg cm-3 |
| 9.1 | 8.9 | |
| 11.6 | 11.9 | |
| 10.9 | 10.9 | |
| -2.2 | -2.2 | |
| -3.2 | -3.2 |
The two models shown are to represent both the flare state of 1995 and the MAGIC observations in 2005. They differ in the following model input parameters: (1) in the Doppler factor, (2) in the magnetic field strength, and (3) the minimum and maximum electron energy. In addition, the form of the electron spectrum differs for the two flux states. The radius of the emission region was kept constant at m. While most of the model parameters are compatible with the parameter space spanned by other models for blazars (e.g. Kino et al. 2002; Giommi et al. 2002), the magnetic field strength found here is rather low.
In conclusion, we note that the presented SED models are rather speculative, given the non-simultaneity of the currently available data. Future multiwavelength campaigns on 1ES 2344+514, exploiting the enhanced sensitivity of the new imaging air Cherenkov telescope installations, will hopefully improve this situation.
References
- Aharonian (2000) Aharonian, F. A., 2000, NewA, 5, 377
- Aharonian et al. (2004) Aharonian, F. A., et al. (HEGRA Collab.), 2004, A&A, 421, 529
- Aharonian et al. (2005) Aharonian, F. A., et al. (H.E.S.S. Collab.), 2005, A&A, 442, 895
- Albert et al. (2006a) Albert, J., et al. (MAGIC Collab.), 2006a, ApJ, 639, 761
- Albert et al. (2006b) Albert, J., et al. (MAGIC Collab.), 2006b, ApJL, 642, 119
- Albert et al. (2006c) Albert, J., et al. (MAGIC Collab.), 2006c, ApJL, 648, 105
- Albert et al. (2007a) Albert, J., et al. (MAGIC Collab.), 2007a, ApJL, 654, 119
- Albert et al. (2007b) Albert, J., et al. (MAGIC Collab.), 2007b, ApJ, in press, astro-ph/0603478
- Albert et al. (2007c) Albert, J., et al. (MAGIC Collab.), 2007c, ApJ, submitted, astro-ph/0702008
- Anykeyev et al. (1991) Anykeyev, V. B., Spiridonov, A. A. & Zhigunov, V.B., 1991, Nucl. Instrum. Meth., A303, 350
- Badran & Weekes (2001) Badran, H. M. & Weekes, T. C., 2001, Proc. 27th ICRC, Hamburg, 2653
- Baixeras et al. (2004) Baixeras, C., et al. (MAGIC Collab.), 2004, Nucl. Instrum. Meth., A518, 188
- Barth et al. (2003) Barth, A. J., et al., 2003, ApJ, 583, 134
- Bednarek (1993) Bednarek, W., 1993, ApJ, 402, L29
- Bock et al. (2004) Bock, R. K., et al., 2004, Nucl. Instrum. Meth., A516, 511
- Breiman (2001) Breiman, L., 2001, Machine Learning, 45, 5
- Bretz et al. (2003) Bretz, T., Dorner, D. & Wagner, R. M., 2003, Proc. 28th ICRC, Tsukuba, Japan, 2943
- Bretz & Wagner (2003) Bretz, T. & Wagner, R. M., 2003, Proc. 28th ICRC, Tsukuba, Japan, 2947
- Catanese et al. (1998) Catanese, M., et al. (Whipple Collab.), 1998, ApJ, 501, 616
- Cortina et al. (2005) Cortina, J., et al. (MAGIC Collab.), 2005, Proc. 29th ICRC, Pune, India, 5, 359, astro-ph/0508274
- Costamante et al. (2001) Costamante, L., et al., 2001, A&A, 371, 512
- Domingo-Santamaría et al. (2005) Domingo-Santamaría, E., et al. (MAGIC Collab.), 2005, Proc. 29th ICRC, Pune, India, 4, 51, astro-ph/0508274
- Dar & Laor (1997) Dar, A. & Laor, A., 1997, ApJ, 478, L5
- Dermer & Schlickeiser (1993) Dermer, C. D. & Schlickeiser, R., 1993, ApJ, 416, 458
- Dwek & Krennrich (2005) Dwek, E. Krennrich, F., 2005, ApJ, 618, 657
- Elvis et al. (1992) Elvis, M., et al., 1992, ApJS, 80, 257
- Fegan (1997) Fegan, D. J., 1997, J. Phys. G, 23, 1013
- Fichtel et al. (1994) Fichtel, C. E., et al., 1994, ApJS, 94, 551
- Fomin et al. (1994) Fomin, V. P., et al., 1994, APh, 2, 137
- Gaug et al. (2005) Gaug, M., et al. (MAGIC Collab.), 2005, Proc. 29th ICRC, Pune, India, 5, 375, astro-ph/0508274
- Gaidos et al. (1996) Gaidos, J. A., et al. (Whipple Collab.), 1996, Nature, 383, 319
- Giommi et al. (2000) Giommi, P., et al., 2000, MNRAS, 317, 743
- Giommi et al. (2002) Giommi, P., et al., 2002, in Proc. Blazar Astrophysics with BeppoSAX and Other Observatories, Rome, 63, astro-ph/0209596
- Gould & Schréder (1966) Gould, R. J. Schréder, 1966, Phys. Rev. Lett., 16, 252
- Hartman et al. (1999) Hartman, R. C., et al., 1999, ApJS, 123, 79
- Hauser & Dwek (2001) Hauser, M. G. Dwek, E., 2001, ARA&A, 39, 249
- Heck et al. (1998) Heck, D., et al., 1998, FZK Report FZKA 6019
- Hillas (1985) Hillas, A. M., 1985, Proc. 19th ICRC, La Jolla, 3, 445
- Kino et al. (2002) Kino, M., Takahara, F. & Kusunose, M., 2002, ApJ, 564, 97
- Kneiske et al. (2004) Kneiske, T. M., et al., 2004, A&A, 413, 807
- Krawczynski et al. (2004) Krawczynski, H., et al., 2004, ApJ, 601, 151
- Lessard et al. (2001) Lessard, R. W., et al., 2001, APh, 15, 1
- Levine et al. (1996) Levine, A. M., et al., 1996, ApJL, 469, L33
- Li & Ma (1983) Li, T.-P. & Ma, Y.-Q., 1983, ApJ, 272, 317
- Majumdar et al. (2005) Majumdar, P., et al. (MAGIC Collab.), 2005, Proc. 29th ICRC, Pune, India, 5, 203, astro-ph/0508274
- Mannheim (1993) Mannheim, K., 1993, A&A, 269, 76
- Maraschi et al. (1992) Maraschi, L., Ghisellini, G., & Celotti, A., 1992, ApJ, 397, L5
- Marscher & Gear (1985) Marscher, A. P. & Gear, W. K., 1985, ApJ, 298, 11
- Massaro et al. (2004) Massaro, E., et al., 2004, A&A, 413, 489
- Mizobuchi et al. (2005) Mizobuchi, S., et al. (MAGIC Collab.), 2005, Proc. 29th ICRC, Pune, India, 5, 323, astro-ph/0508274
- Mücke & Protheroe (2001) Mücke, A. & Protheroe, R. J., 2001, APh, 15, 121
- Nilsson et al. (2006) Nilsson, K., et al., 2006, in preparation
- Nikishov (1962) Nikishov, A. I., 1962, Sov. Phys. JETP, 14, 393
- Paneque et al. (2004) Paneque, D., et al., 2004, NIM, A518, 619
- Perlman et al. (1996) Perlman, E. S., et al., 1996, ApJS, 104, 251
- Rowell (2003) Rowell, G. P., 2003, A&A, 410, 398
- Schroedter et al. (2005) Schroedter, M., et al. (Whipple Collab.), 2005, ApJ, 634, 947
- Sikora et al. (1994) Sikora, M., Begelman, M. C, & Rees, M. J., 1994, ApJ, 421, 153
- Stecker et al. (2006) Stecker, F. W., Malkan, M. A. & Scully, S. T., 2006, ApJ, 648, 774
- Tluczykont (2003) Tluczykont, M. 2003, Ph.D. Thesis, University of Hamburg
- Urry & Padovani (1995) Urry, C. M. & Padovani, P. 1995, PASP, 107, 803
- Wagner et al. (2005) Wagner, R. M., et al. (MAGIC Collab.), 2005, Proc. 29th ICRC, Pune, India, 4, 163, astro-ph/0508244
- Xue & Cui (2005) Xue, Y. & Cui, W., 2005, ApJ, 622, 160