The results of ATIC-2 experiment for elemental spectra of cosmic rays
A.D. Panov111Skobeltsyn Inst. of Nuclear Physics, Moscow State University, Moscow, Russia,
J.H. Adams, Jr.222Marshall Space Flight Center, Huntsville, AL, USA,
H.S. Ahn333University of Maryland, Institute for Physical Science & Technology, College Park, MD, USA,
G.L. Bashindzhagyan11footnotemark: 1,
K.E. Batkov11footnotemark: 1,
J. Chang444Purple Mountain Observatory, Chinese Academy of Sciences, China,555Max-Planck Institut for Solar System Research, Katlenburg-Lindau, Germany,
M. Christl22footnotemark: 2,
A.R. Fazely666Southern University, Department of Physics, Baton Rouge, LA, USA,
O. Ganel33footnotemark: 3,
R.M. Gunashingha66footnotemark: 6,
T.G. Guzik777Louisiana State University, Department of Physics and Astronomy, Baton Rouge, LA, USA,
J. Isbert77footnotemark: 7,
K.C. Kim33footnotemark: 3,
E.N. Kouznetsov11footnotemark: 1,
M.I. Panasyuk11footnotemark: 1,
W.K.H. Schmidt55footnotemark: 5,
E.S. Seo33footnotemark: 3,
N.V. Sokolskaya11footnotemark: 1,
John W. Watts22footnotemark: 2,
J.P. Wefel77footnotemark: 7,
J. Wu33footnotemark: 3, and
V.I. Zatsepin11footnotemark: 1,
Abstract
The results of ATIC-2 baloon experiment (2002–2003) for energy spectra of protons, He, C, O, Ne, Mg, Si, Fe, some groups of nuclei, and all-particle spectrum in primary cosmic rays are presented in energy region 50 GeV–200 TeV. The conclusion is that the spectra of protons and helium nuclei are essentially different (the spectrum of protons is steeper) and the spectra of protons and heavy nuclei have no-power form.
1 Introduction
ATIC (Advanced Thin Ionization Calorimeter) is a balloon borne experiment designed to measure energy spectra of cosmic rays with individual charge resolution from protons to iron in the energy interval approximately from 50 GeV to 200 TeV. ATIC is comprised of a silicon matrix, a carbon target, scintillator hodoscopes, and a fully active BGO calorimeter. The detailed description of the spectrometer is given in [1], the method of measurement of primary particle charge and the charge resolution achieved in the spectrometer is described in [2]. A matrix of silicon detectors that permits to solve the problem of albedo current by the method of high segmentation of charge detector was used in the high energy cosmic ray physics for the first time [3]. ATIC had two successful balloon flights in Antarctica: from 28 Dec 2000 to 13 Jan 2001 (test flight ATIC-1) and from 29 Dec 2002 to 18 Jan 2003 (science flight ATIC-2). The preliminary results of the processing of the ATIC-2 flight data were published in papers [4, 5].
The calorimeter of the ATIC spectrometer is thin, that is only a part of the energy of primary particle is detected by the calorimeter. Therefore there exist a problem to reconstruct the spectrum of primary particles from the spectrum of energy deposit. The spectrum of energy deposit for the particles of some definite sort is connected with the primary spectrum by the Fredholm equation of the first kind:
| (1) |
where is the apparatus function which produces for each primary energy the distribution of the energies deposited in the calorimeter. To obtain the spectrum of primary energies one must solve the equation (1) for with known function . This problem belongs to the sort of ill-defined reverse problems. Different approximate methods are used to solve such problems. The scaling approximation that is used in emulsion calorimeters [6] was used in papers [4, 5] for transition from the spectra of energy deposit to the primary spectra. It is supposed in such approximation that the fraction of the energy deposited in the calorimeter (the ratio ) and the effectiveness of registration do not depend from the primary energy . Therefore the primary spectrum could be obtained from the energy deposit spectrum simply by energy shift and normalization by the effectiveness of registration.
A simulation of cascades propagation in the spectrometer show that scaling approximation describes the operation of the device very roughly. The method of papers [4, 5] should be improved. Two more precise methods to solve the problem of reconstruction the primary spectra (1) are used in the present work: direct solution of the Fredholm equation with Tikhonov’s regularization and the method of differential shifts which is a generalization of the known method [6]. Besides, a new more precise calibration of the calorimeter and an improved correction of the thermal sensitivity of calorimeter measurement tract were used in present work. Instead of using of mean flight temperature of the device in temperature correction method as in papers [4, 5], instantaneous values of temperature were accounted and used in new improved method of correction of thermal sensitivity.
2 Reconstruction of primary spectra
The experimental differential spectra of energy deposited in the calorimeter are recorded as a number of counts in logarithmic-equidistant bins that divide the whole region of the investigated energies onto parts. If the primary spectra is written in the same form then the integral equation (1) in discrete form may be written as a system of equation
| (2) |
where the notations are obvious. The search of the primary spectrum based on the direct solution of discrete Fredholm equation (2) with using of regularization leads to minimization of some functional and using the Monte Carlo method for calculation of statistical errors. The realization of the method for processing of the ATIC data was described in details in [7].
It was shown that the method of solution of the reverse problem with regularization for protons and helium nuclei leads to stable result. This means that if one processes a spectrum of energy by parts then one obtains the respective parts of the primary spectrum that are in the accordance with each other. But it turned out that it was not the case for nuclei . So the method of differential shifts that generalizes the known method [6] based on exact scaling was developed to process the spectra for nuclei . The energy scaling factor is calculated separately for each value of in the differential shifts method. For the deposited energy value that is exactly equal to the logarithmic mean of -th bin of the spectrum () the primary energy is reconstructed by the formula
| (3) |
where is an initial approximation for the primary spectrum. For intermediate values of the primary energy is estimated by interpolation of the equation (3). As an initial approximation a power-form spectra with the integral index for momentum were used.
It was checked that the method of reconstruction of primary spectra by solution of reverse problem with regularization and the method of differential shifts produce the same (up to statistics) result in the common for both methods energy region of the primary spectra. But for all, the method of differential shifts is stable for all species, though the lower threshold for reconstructed spectra is approximately 200 GeV instead 50 GeV in the method of regularization. Another advantage of the method of differential shifts upon direct solution of reverse problem is that the first is usable in the region of data with low statistics where the direct method is already unusable. But it is needed for the differential shifts method that the spectrum was not different from the power one too much. It is the case for nuclei .
The absolute fluxes of primary particles are determined by normalization of the reconstructed primary spectra by geometrical factor of the device, live time of the exposition, correction on the residual atmosphere, and correction of effectiveness of algorithm of trajectory reconstruction.
3 Results
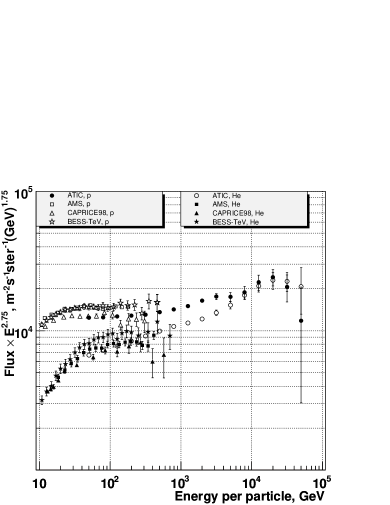
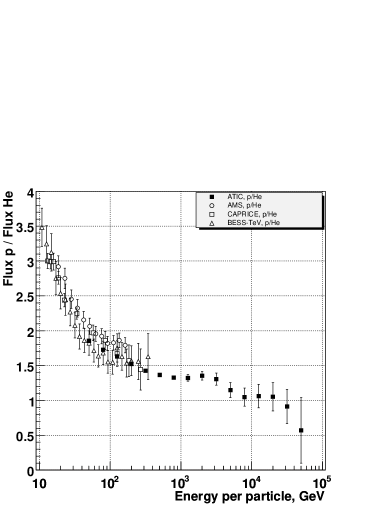
The obtained primary spectra of protons and helium nuclei (here and everywhere in this paper in the terms of energy per particle) and the ratio of the fluxes of protons and helium nuclei against the primary energy are shown in fig. 1. The ATIC-2 results are compared with the results of experiments AMS [8, 9], CAPRICE-98 [10], BESS-TeV [11]. The spectra of protons and helium nuclei have definitely different slopes and are in the accordance with the data of magnetic spectrometers [8]–[11] in the region of low energies (where the data of magnetic spectrometers are defined).
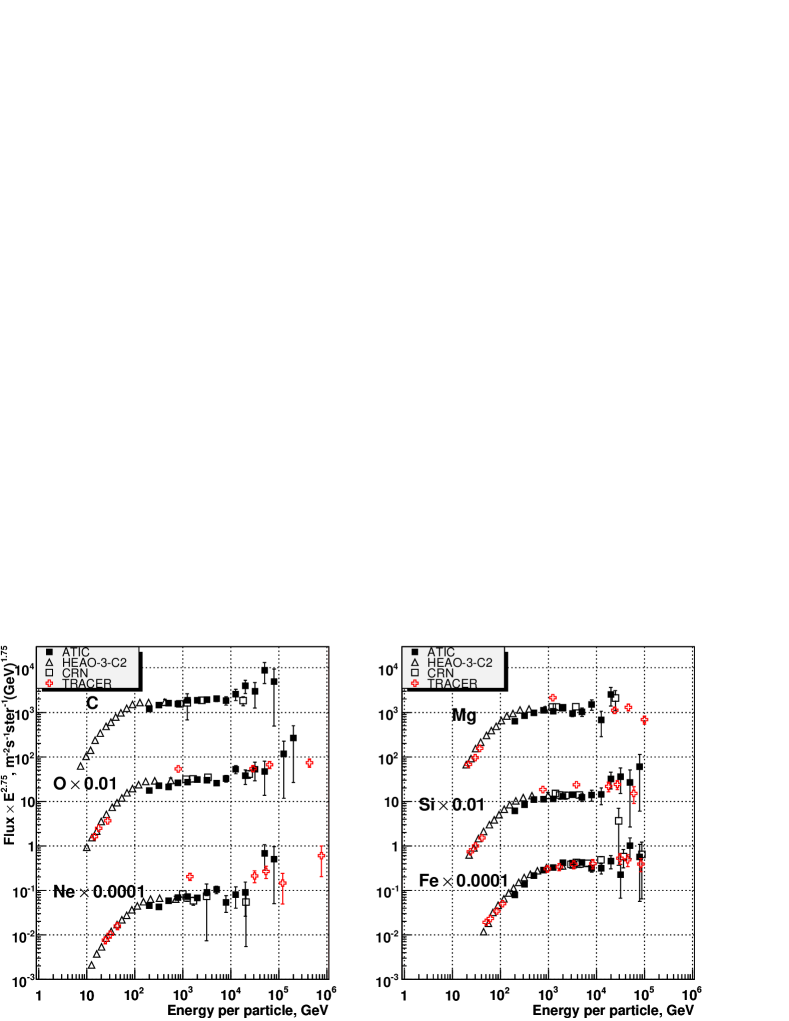
The primary spectra of some even nuclei are shown in fig. 2. The data of ATIC-2 are compared with the results of HEAO-3-C2 [12], CRN [13], TRACER (preliminary results) [14]. One can note a good agreement except a little systematic exceeding of HEAO data over ATIC-2 data in the energy region 200–700 GeV.
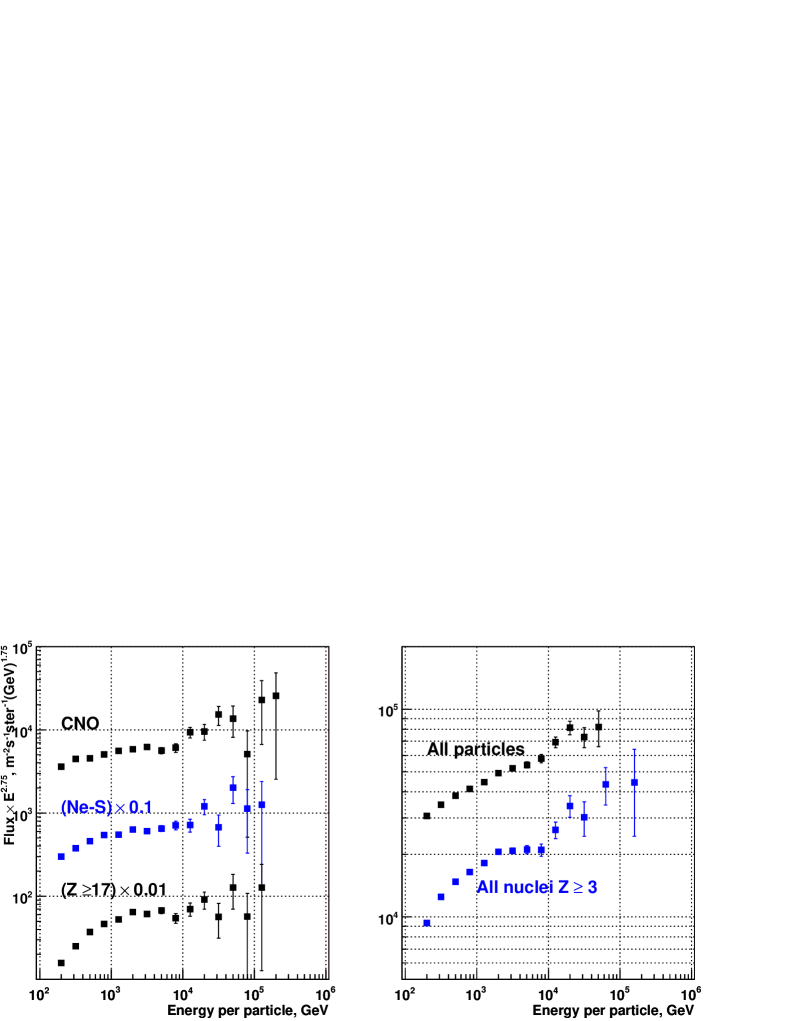
The spectra of different nuclei groups and the spectrum of all particles from ATIC-2 data are shown in fig. 3. One can notes a definite flating of spectra for nuclei heavier than helium in the region of primary energies TeV. It especially clear in the summary spectrum of nuclei (fig. 3) The shape of the spectra of all particles is close to the power low, but in the light of the results of ATIC-2 experiment this is seen as a random event since the spectra of different nuclei groups (including the spectra of protons and helium, fig. 1) are rather far from a power law.
The analysis of ATIC-2 data have been continuing.
This work was supported in Russia by RFBR grats 02-02-16545, 05-02-16222; in USA by NASA grants NNG04WC12G, NNG04WC10G, NNG04WC06G; J. Chang is grateful to Ministry of Science and Technology of China for supporting by grant 2002CB713905.
References
- [1] Guzik, T. G. et al. // Adv. Sp. Res. 2004. V. 33. P. 1763.
- [2] Zatsepin, V. I. et al. // Nucl. Instr. Meth. A. 2004. V. 524. P. 195.
- [3] Sokolskaya N. V. et al. // Yad. Fis. 2005. . 68. P. 1225.
- [4] Zatsepin V. I. et. al. // Izv. RAN. Ser. Fiz. 2004. V. 68. P. 1593.
- [5] Panov, A. D. et al. // Adv. Sp. Res. 2006. V. 37. P. 1944.
- [6] Burnett, T. H. et al. // Nucl. Instrum. Methods A. V. 251, P. 583 (1986).
- [7] Batkov, K. E. et al. // 29th ICRC. Pune. 2005. V. 3. P. 353.
- [8] Alcaraz, J. et al. // Phys. Lett. B. 2000. V. 490. P. 27.
- [9] Alcaraz, J. et al. // Phys. Lett. B. 2000. V. 494. P. 193.
- [10] Boezio, M. et al. // Astroparticle Physics. 2003. V. 19. P. 583.
- [11] Haino, S. et all. // Phys. Lett. B. 2004. V. 594. P. 35.
- [12] Engelmann, J. J. et al. // Astron. Astrophys. 1990. V. 233. P. 96.
- [13] Müller, D. et al. // Astroph. Journal. 1991. V. 374. P. 356.
- [14] Müller, D. et al. // 29th ICRC. Pune. 2005. V. 3. P. 89.