On determining the mass-loss rates of red giants and red supergiants based on infrared data
Abstract
I review existing methods for determining mass-loss rates of red giants and red supergiants based on infrared data. The simplest method is based on models for the absorption and emission by dust which forms in the dense outflows from these cool stars. I discuss the parameters and assumptions upon which the method relies, review relationships between the mass-loss rate and infrared colours or far-infrared flux density, and propose a new formula for the mass-loss rate as a function of the visual extinction. I also briefly discuss the use of atomic and molecular transitions at infrared wavelengths.
School of Physical & Geographical Sciences, Lennard Jones Laboratories, Keele University, Staffordshire ST5 5BG, UK (jacco@astro.keele.ac.uk)
1. Introduction
Early spectroscopic observations of cool giant stars revealed violet-displaced absorption in the optical line profiles of strong electronic transitions of singly-ionized and neutral atoms, and mass-loss rates of to M⊙ yr-1 were inferred (Deutsch 1956; Reimers 1975). More evidence of such winds came in the form of radio emission lines from abundant molecules, in particular the amplified stimulated emission from hydroxyl at cm (Elitzur, Goldreich, & Scoville 1976). Thermal line emission from carbon monoxide at mm wavelengths enabled measurements of the wind speed and mass-loss rate for carbon stars as well as stars with oxygen-rich envelopes (Knapp & Morris 1985). Methods for determining the mass-loss rate using radio techniques are described by Fredrik Schöier elsewhere in these proceedings.
Infrared surveys revealed stars which are heavily reddened by circumstellar dust. The association between these dust-enshrouded stars and masers was quickly made, and the accompanying dust emission became a very useful tracer of mass loss (Gehrz & Woolf 1971). It also explained the pumping of the masers through infrared emission, but most importantly it provided a mechanism for driving the wind. Strong pulsation of the cool photospheres of these stars acts as a piston to increase the scaleheight of the molecular atmosphere, facilitating the condensation of grains (Jura 1986). The continuum opacity of the grains allows for efficient transfer of momentum from the stellar radiation field onto the dust grains. If the density is high enough then the dust and gas are coupled, mostly via grain-H2 collisions. High mass-loss rates were estimated for these stars, to M⊙ yr-1 (Olnon et al. 1984).
The Spitzer Space Telescope has made it possible to detect the infrared emission from circumstellar dust around red giants and red supergiants (RSGs) in many Local Group galaxies for the first time. This enables the study of mass loss and dust production in a rich variety of environments inaccessible before, for example in the Wolf-Lundmark-Melotte dwarf galaxy (Jackson et al. 2007) but also galactic globular clusters such as the extremely metal-poor Messier 15 (Boyer et al. 2006), whilst more thorough and detailed studies are possible in the Magellanic Clouds. As technological progress inflates the observable Universe, much of the groundbraking work is done in uncharted territory and at the limit of sensitivity, running into many of the types of problems that were faced in the 1970s in studies of nearby stars. It is thus essential to understand the methods that are applied to measure mass-loss rates from these infrared data, and in particular to be aware of their assumptions and limitations.
2. Dust-driven wind model as the basis for measuring mass-loss rates
Circumstellar dust grains absorb stellar light mainly at optical (and ultraviolet) wavelengths, and re-emit it mainly at infrared wavelengths. The shape of the observed spectral energy distribution (SED) depends on the optical properties of the grains and on the optical depth of the envelope. For a spherically symmetric geometry the integral under the SED yields the bolometric luminosity, provided that the distance is known. The SED does not allow a direct measurement to be made of the mass-loss rate. Under the assumption of radiative equilibrium between the capture of photons and isotropic emission by the heated grain, and applying the continuity equation, one obtains a crude relationship that summarises the problem quite well (Ivezić & Elitzur 1995):
| (1) |
where we notice that although the optical depth, , is proportional to the (gas+dust) mass-loss rate, , it also depends on the dust:gas mass ratio, , the expansion velocity of the wind, , as well as the luminosity, .
Simple radiation-driven dust wind theory predicts how the wind speed should depend on the luminosity and dust:gas ratio. This can be used to compute the expected wind speed for stars for which we have no direct measurement of it. The momentum equation relates the motion of the matter and photon fluids:
| (2) |
where the optical depth properly accounts for the scattering of photons off the circumstellar grains. Hence, combination with Eq. (1) yields:
| (3) |
It seems deceptively reasonable that the dust:gas ratio depends on metallicity. Unfortunately, this is a difficult parameter to measure directly.
First evidence for the metallicity dependence of the wind speed of red giants was presented by Wood et al. (1992) who detected six OH/IR stars in the LMC. Marshall et al. (2004) enlarged this sample, and from a comparison with the wind speeds and luminosities of OH/IR stars in the galactic centre they could confirm Eq. (3) and indicate that the dust:gas ratio is linearly proportional to metallicity:
| (4) |
In the absence of direct measurements of wind speed and dust:gas ratio, it is therefore recommended to abide by the following scaling relation:
| (5) |
The metallicity dependence of dust-driven winds is reviewed in van Loon (2006).
3. Model computations of the infrared spectral energy distribution
The optical depth of the dust envelope can be derived from the observed SED by comparison with synthetic SEDs. The latter are produced by computing simultaneously the radiation transfer through the dust envelope, and the thermal balance between the grain heating through irradiation and cooling through reradiation. The principles underlying these computations were first outlined for the non-grey case by Leung (1975), Rowan-Robinson (1980) and Yorke (1980). Three commonly used codes that solve the equations of radiation transfer and thermal equilibrium were developed independently in the 1990s: the code of Groenewegen (1993), the dusty code (Ivezić, Elitzur, & Nenkova 1999), and the modust code (Bouwman 2001). Of these, only dusty is publicly available — fortunately it is also well documented and relatively easy to use. The latest generation of codes are based on Monte Carlo techniques for tracing the energy packets on their journey through the dust envelope (Bjorkman & Wood 2001), culminating in the publicly available photo-ionization/dust radiation transfer code mocassin (Ercolano, Barlow, & Storey 2005).
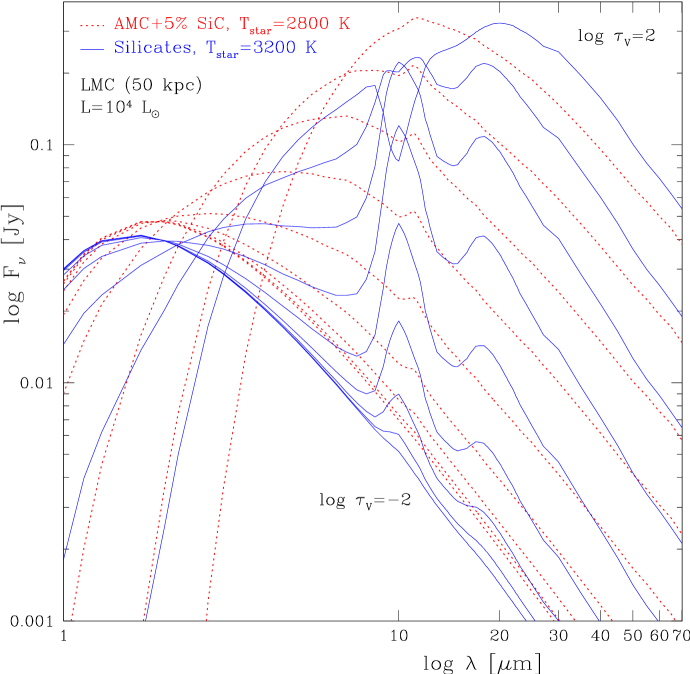
As an illustration, the dusty code is used to generate a series of model SEDs with a visual optical depth between and 100, for an oxygen-rich red giant and a carbon star (Fig. 1). Corresponding mass-loss rates are to M⊙ yr-1 for a typical Asymptotic Giant Branch (AGB) star at solar metallicity, but note that the difference in luminosity between massive RSGs and the tip of the Red Giant Branch corresponds to a two orders of magnitude difference in the mass-loss rate inferred from the shape of the SED alone.
Differences in optical depth manifest themselves most through extinction of stellar light at m, the strength of discrete features associated with certain minerals mainly in the to 30 m region, and a general elevation of the spectrum over that of a naked star at m. The extinction only becomes noticeable when approaches unity, as it is difficult to isolate its effect from the depression of the stellar continuum due to blanketing by molecular bands in cool giants, and from the interstellar contribution to the extinction. Because the absorbed photons are more energetic than the reradiated photons, small optical depths readily give rise to detectable amounts of excess emission at longer wavelengths. In particular, silicates shine efficiently around m, and the resulting emission feature can be used to detect mass-loss rates as low as a few M⊙ yr-1 in low-luminosity or metal-rich red giants — but here, too, the sensitivity is limited by molecular absorption bands and uncertainty in the stellar continuum (stars are not blackbodies) as well as the detailed mineralogy.
4. A formula for the mass-loss rate as a function of optical extinction
For the examples shown in Fig. 1, the mass-loss rate turns out to be related to the visual extinction, (), as . Incidentally, replacing by in Eq. (5) and calibrating against the computed models yields a practically identical constant of proportionality for both silicates and amorphous carbon grains. Hence:
| (6) |
This provides a new, simple and versatile recipe for estimating mass-loss rates.
5. Relationships between mass-loss rate and infrared flux or colour
As a shortcut to comprehensive modeling of the SED, various relationships have been suggested between the optical depth and a monochromatic infrared flux or a single infrared colour. The main reason why this is interesting, is because it may not be possible or economic to sample all of the SED.
The InfraRed Astronomical Satellite (IRAS) made it possible to measure the long-wavelength tail of the dust emission from galactic red giants. This was first quantified by Jura (1987), who proposed a formula for the mass-loss rate as a function of the flux density at 60 m — it depends also on the wind speed, distance, luminosity, dust:gas ratio, and the “mean wavelength of the light emerging from the star and its circumstellar dust shell” (which requires measurement of a significant portion of the SED). The formula was adapted to be used at 25 m by Whitelock, Feast, & Catchpole (1991) and Whitelock et al. (1994). Both formulae compare favourably with measurements of the mass-loss rate from the CO(J=10) rotational transition at mm.
Relationships between mass-loss rate and colours are appealing as they are distance invariant, but in the light of the previous discussion this seems a rather deceptive advantage as they must depend on the star’s luminosity. Such (and other unaccounted for) dependencies are not fully appreciated when they are derived for relatively uniform samples of stars, for instance carbon stars or nearby low-mass red giants in a narrow range of metallicity. Formulae are considered successful if they yield mass-loss rates to an intrinsic accuracy of a factor two or so, but the same accuracy cannot be guaranteed if applied outside its validity domain (not limited by just colour range).
I nonetheless summarise in Table 1 several formulae for the mass-loss rate as a function of infrared colour. Where a second reference is given the data presented by the former were first parameterised by the latter. Linear, square-root or asymptotic functions have been suggested. They share many of the basic assumptions, and notably they are all evaluated for stars of a (near) solar metallicity — even the mass-loss rates for the presumably metal-poor magellanic stars were derived adopting values for the dust:gas ratio and wind speed typical for red giants encountered in the solar neighbourhood.
The approaches of Le Sidaner & Le Bertre (1996), Le Bertre (1997), Le Bertre & Winters (1998), and of Schutte & Tielens (1989) (parameterised by Zijlstra et al. 1996) and Groenewegen et al. (2007) (parameterised in this review) are based on modeling of the SEDs to derive mass-loss rates and then correlating with the near-infrared colours of the same stars. The approach of Whitelock et al. (1994) (parameterised by Zijlstra et al. 1996) is similar as they use the Jura (1987) formalism to derive the mass-loss rate, which is a crude way of modeling the SED. They found that the correlation between the mass-loss rate and 25:60 m flux ratio is rather poor. The mass-loss rates from the infrared data in Le Sidaner & Le Bertre (1996), Le Bertre (1997), Le Bertre & Winters (1998) and Whitelock et al. (1994) were all found to be in good agreement with the mass-loss rates from the CO(J=10) line emission for the same stars. The approach of Guandalini et al. (2006) (parameterised in this review) differs in that the mass-loss rates that were correlated with the infrared colours were not in themselves derived from infrared data but from the CO line emission.
| # | [M⊙ yr-1] | validity domain | chemistry | remarks | ref | ||||||
|---|---|---|---|---|---|---|---|---|---|---|---|
| [km s-1] | |||||||||||
| 1 | – | carbon | 0.01 | data,15 | local Miras | 3 | |||||
| 2 | – | oxygen | 0.01 | data | local Miras | 4 | |||||
| 3 | – | carbon | model | model | synthetic | 6 | |||||
| 4 | – | carbon | model | model | synthetic | 6 | |||||
| 5 | – | carbon | 0.01 | data,15 | local Miras | 3 | |||||
| 6 | – | oxygen | 0.01 | data | local Miras | 4 | |||||
| 7 | – | carbon | model | model | synthetic | 6 | |||||
| 8 | – | carbon | model | model | synthetic | 6 | |||||
| 9 | – | oxygen | 0.01 | data | AGB+RSGs | 5 | |||||
| 10 | – | carbon | 0.01 | data | local Miras | 4 | |||||
| 11 | – | oxygen | 0.01 | data | local Miras | 4 | |||||
| 12 | – | carbon | model | model | synthetic | 6 | |||||
| 13 | – | carbon | model | model | synthetic | 6 | |||||
| 14 | – | oxygen | 0.005 | 10 | local Miras | 8,9 | |||||
| 15 | – | oxygen | 0.004 | 10 | 7,9 | ||||||
| 16 | – | carbon | 0.005 | 10 | magellanic | 1,10 | |||||
| 17 | – | carbon | (CO) | data | galactic | 2,10 | |||||
| 18 | – | carbon | (CO) | data | galactic | 2,10 | |||||
Schröder, Wachter, & Winters (2003) compute hydrodynamical models in order to generate synthetic mass-loss rates and infrared colours as the model stars evolve. The models are computed for initial stellar masses limited to 0.63–1.2 M⊙, and are only valid for the superwind regime of the highest mass-loss rates. They also predict H–K and L–M colours but these are less sensitive measures of the mass-loss rate. Essentially the same models were computed by Winters et al. (2000), who showed that although the evolution of mass-loss rate with infrared colour is qualitatively comparable to that observed by Le Bertre (1997), the results are offset and display a different slope.
Groenewegen (2006) computes the SEDs for a grid of carbon- and oxygen-rich AGB stars covering a range in mass-loss rate (similar to what was done for Fig. 1), and convolves these SEDs with a suite of filter curves to generate the expected optical and infrared photometry. If applying the appropriate scaling relations as discussed before, these magnitudes can be compared with actual measurements to estimate the mass-loss rate of a star.
6. Complications with deriving mass-loss rates from the dust
The description of the dust-driven wind in §2 is a highly idealized one, but often the observational constrains are lacking that would justify a more detailed one. It is thus important to be aware of the caveats, of which I list a few here.
The dust:gas ratio is difficult to measure except for nearby objects from which CO line emission can be detected (realising that CO is also a minor constituent). In well-developed dust-driven winds, the dust condensation seems to be complete in the sense that all condensable material is locked up in the grains. This yields a dust:gas mass ratio for stars of an overall solar metallicity, with the expected scaling of Eq. (4). The validity of this notion is confirmed by agreement between the mass-loss rates predicted from a formula that was derived for a magellanic sample of oxygen-rich AGB stars and RSGs, and the mass-loss rates measured from the far-infrared brightness, for a sample of dust-enshrouded galactic AGB stars and RSGs (van Loon et al. 2005).
These authors also show (in their Fig. 11) that the paradigm breaks down in the case of giants with warm photospheres or that pulsate less vigorously. In the case of Betelgeuse this is known to be associated with a low dust:gas ratio suggesting that the dust condensation process has not reached its full potential. Although this regime holds vital clues to the dust formation process, it makes it an extremely hazardous affair to predict the dust:gas ratio and hence the total mass in the wind. This might gain in relative importance at low overall metallicity, when the carbon:oxygen ratio approaches unity, or when Hot Bottom Burning in massive oxygen-rich AGB stars depletes both carbon and oxygen by burning it into the non-refractive element nitrogen. The exact composition of the dust and the grain size distribution then also become more uncertain and with it, the optical constants that determine the opacity.
In dust-poor winds one can expect a large drift velocity between grains and gas, and Eq. (3) would need to be modified to reflect this (Habing, Tignon, & Tielens 1994). The SED shortward of its peak also depends on the acceleration of the wind, as well as the radial profile of the dust condensation process. This can be addressed in detailed non-LTE models for the line profiles of rotational transitions at radio wavelengths (Decin et al. 2006). The dusty code offers the option to use a hydrodynamic model for the wind, but not a radial stratification of the dust properties or dust:gas ratio. Stellar radial pulsations drive shocks through the inner parts of the envelope which cause density enhancements and variations in the outflow speed, further modifying the SED. Where the mass-loss rate is derived from the far-infrared emission from the cold dust, this can be affected by temporal variations in the wind speed and mass-loss rate on timescales of centuries to as much as yr — comparable to the duration of the superwind phase or the interval between thermal pulses that occur in the nuclear burning layers of AGB stars. Modeling the full SED can, in principle, recover some of the mass-loss history (Groenewegen 1995), but complications with the interpretation arise if the wind has swept up a significant amount of interstellar matter (Villaver, García-Segura, & Manchado 2004).
The dust envelope is usually assumed to be spherically symmetric. This may be a good approximation for most AGB stars, but RSGs are often found to display deviations from this. Worse still, RSGs are encountered near their birth sites, and their envelopes may be emerged in an anisotropic external irradiation field (Schuster, Humphreys, & Marengo 2006). Binarity is sometimes invoked to explain axi-symmetric outflows from post-AGB objects (e.g., the Red Rectangle: Waters et al. 1998), but less is known about the effects whilst still on the AGB. Although the geometry of axi-symmetric envelopes can be determined from the SED (e.g., Whitney et al. 2003), the problem becomes degenerate if the geometry is more complex but no spatial information is available — which is the norm in extragalactic objects (e.g., van Loon et al. 1999). This may be especially important for low-mass red giants, which have a large peculiar velocity with respect to the ambient interstellar medium and are thus expected to develop bowshocks (Villaver, García-Segura, & Manchado 2004).
7. Mass-loss rates from atomic and molecular infrared transitions
Molecular hydrogen has transitions at infrared wavelengths, notably at m (J=20) with an excitation temperature of K and at m (J=31) with K (Burton, Hollenbach, & Tielens 1992). Unfortunately, the decay times of these quadrupole transitions are in excess of a century and hence the expected line emission from circumstellar envelopes is extremely feeble. Higher-level transitions around m have been used to study the pulsating atmospheres of cool giants (Hinkle et al. 2000), but until the pulsation and its connection with the mass loss are better understood it is not possible to reliably measure the mass-loss rate from these lines.
Absorption in the Q-branch of the acetylene (C2H2) band at m has been used to estimate the mass-loss rates from magellanic carbon stars (Matsuura et al. 2006), in agreement with the mass-loss rates derived from modeling of the SEDs (van Loon et al. 2006). In its current form it is simply a measurement of the equivalent width and hence it suffers from dependencies on luminosity, velocity (structure) and chemistry similar to the optical depth of the dust envelope. But more sophisticated modeling of the absorption band shapes and line shifts in high-resolution spectra of the acetylene bands at –14 m holds great promise of improvement of the method.
Interesting in particular for dust-poor environments, fine-structure lines of atomic oxygen at m and atomic and singly-ionized iron, silicon and sulphur at –36 m can be used to estimate the gas mass in the line-forming region (Haas, Glassgold, & Tielens 1995; Aoki, Tsuji, & Ohnaka 1998). But, as with the high-excitation H2 lines, a theory for the mass loss resulting from such an atmosphere is required in order to infer the mass-loss rate.
An electronic transition, the triplet of atomic helium at m can be used to trace the bulk flow in the chromosphere that exists around warm giants ( K), much more effectively than the more commonly used optical lines of H and Ca ii H+K (Smith, Dupree, & Strader 2004). Unfortunately, the analysis depends sensitively on the ill-defined structure of the chromosphere.
8. Concluding remarks
Several methods are available to determine the mass-loss rate of cool giants from infrared data. These can be divided in methods based on the dust extinction and emission, and methods based on the absorption and emission by molecules and atoms. The “dust” methods are ultimately linked to the shape of the spectral energy distribution, be it through modeling or the use of derived relationships between the mass-loss rate and far-infrared flux density, infrared colour or optical extinction. The accuracies obtained are almost never better than a factor two even in nearby objects with exquisite data, and can easily be worse than an order of magnitude in distant objects. More importantly, systematic uncertainties of similar magnitudes arise from lack of theory, in particular with regard to the structure of the molecular atmosphere and the dust condensation process.
Acknowledgments.
I would like to warmly thank the organisers and all participants for a very interesting and pleasant conference in the heart of Europe.
References
- Aoki et al. (1998) Aoki, W., Tsuji, T., & Ohnaka, K. 1998, A&A, 333, L19
- Bjorkman & Wood (2001) Bjorkman, J. E., & Wood, K. 2001, ApJ, 554, 615
- Bouwman (2001) Bouwman, J. 2001, PhD thesis, University of Amsterdam
- Boyer et al. (2006) Boyer, M. L., Woodward, C. E., van Loon, J. Th., Gordon, K. D., Evans, A., Gehrz, R. D., Helton, L. A., & Polomski, E. F. 2006, AJ, 132, 1415
- Burton et al. (1992) Burton, M. G., Hollenbach, D. J., & Tielens, A. G. G. M. 1992, ApJ, 399, 563
- Decin et al. (2006) Decin, L., Hony, S., de Koter, A., Justtanont, K., Tielens, A. G. G. M., & Waters, L. B. F. M. 2006, A&A, 456, 549
- Deutsch (1956) Deutsch, A. J. 1956, ApJ, 123, 210
- Elitzur et al. (1976) Elitzur, M., Goldreich, P., & Scoville, N. 1976, ApJ, 205, 384
- Ercolano et al. (2005) Ercolano, B., Barlow, M. J., & Storey, P. J. 2005, MNRAS, 362, 1038
- Gehrz & Woolf (1971) Gehrz, R. D., & Woolf, N. J. 1971, ApJ, 165, 285
- Groenewegen (1993) Groenewegen, M. A. T. 1993, PhD thesis, University of Amsterdam
- Groenewegen (1995) Groenewegen, M. A. T. 1995, A&A, 293, 463
- Groenewegen (2006) Groenewegen, M. A. T. 2006, A&A, 448, 181
- Groenewegen et al. (2007) Groenewegen, M. A. T., Wood, P. R., Sloan, G. C., Blommaert, J. A. D. L., Cioni, M.-R. L., Feast, M. W., Hony, S., Matsuura, M., Menzies, J. W., Olivier, E. A., Vanhollebeke, E., van Loon, J. Th., Whitelock, P. A., Zijlstra, A. A., Habing, H. J., Lagadec, E. 2007, submitted to MNRAS
- Guandalini et al. (2006) Guandalini, R., Busso, M., Ciprini, S., Silvestro, G., & Persi, P. 2006, A&A, 445, 1069
- Haas et al. (1995) Haas, M. R., Glassgold, A. E., & Tielens, A. G. G. M. 1995, in Airborne Astronomy Symposium on the Galactic Ecosystem: From Gas to Stars to Dust. ASP Conference Series, Vol. 73, p. 397
- Habing et al. (1994) Habing, H. J., Tignon, J., & Tielens, A. G. G. M. 1994, A&A, 286, 523
- Hinkle et al. (2000) Hinkle, K. H., Aringer, B., Lebzelter, T., Martin, C. L., & Ridgway, S. T. 2000, A&A, 363, 1065
- Ivezić & Elitzur (1995) Ivezić, Ž., & Elitzur, M. 1995, ApJ, 445, 415
- Ivezić et al. (1999) Ivezić, Ž, Nenkova, M., & Elitzur, M. 1999, User manual for dusty. University of Kentucky Internal Report
- Jackson et al. (2007) Jackson, D. C., Skillman, E. D., Gehrz, R. D., Polomski, E., & Woodward, C. E. 2007, ApJ, in press
- Jura (1986) Jura, M. 1986, IrAJ, 17, 322
- Jura (1987) Jura, M. 1987, ApJ, 313, 743
- Knapp & Morris (1985) Knapp, G. R., & Morris, M. 1985, ApJ, 292, 640
- Le Bertre (1997) Le Bertre, T. 1997, A&A, 324, 1059
- Le Bertre & Winters (1998) Le Bertre, T., & Winters, J. M. 1998, A&A, 334, 173
- Le Sidaner & Le Bertre (1996) Le Sidaner, P., & Le Bertre, T. 1996, A&A, 314, 896
- Leung (1975) Leung, C. M. 1975, ApJ, 199, 340
- Marshall et al. (2004) Marshall, J. R., van Loon, J. Th., Matsuura, M., Wood, P. R., Zijlstra, A. A., & Whitelock, P. A. 2004, MNRAS, 355, 1348
- Matsuura et al. (2006) Matsuura, M., Wood, P. R., Sloan, G. C., Zijlstra, A. A., van Loon, J. Th., Groenewegen, M. A. T., Blommaert, J. A. D. L., Cioni, M.-R. L., Feast, M. W., Habing, H. J., Hony, S., Lagadec, E., Loup, C., Menzies, J. W., Waters, L. B. F. M., & Whitelock, P. A. 2006, MNRAS, 371, 415
- Olnon et al. (1984) Olnon, F. M., Habing, H. J., Baud, B., Pottasch, S. R., de Jong, T., & Harris, S. 1984, ApJ, 278, L41
- Reimers (1975) Reimers, D. 1975, in International Astrophysics Colloquium. Societé Royale des Sciences de Liège, Memoires Vol. 8, p. 369
- Rowan-Robinson (1980) Rowan-Robinson, M. 1980, ApJS, 44, 403
- Schröder et al. (2003) Schröder, K.-P., Wachter, A., & Winters, J. M. 2003, A&A, 398, 229
- Schuster et al. (2006) Schuster, M. T., Humphreys, R. M., & Marengo, M. 2006, AJ, 131, 603
- Schutte & Tielens (1989) Schutte, W. A., & Tielens, A. G. G. M. 1989, ApJ, 343, 369
- Smith et al. (2004) Smith, G. H., Dupree, A. K., & Strader, J. 2004, PASP, 116, 819
- van Loon (2006) van Loon, J. Th. 2006, in Stellar Evolution at Low Metallicity: Mass Loss, Explosions, Cosmology. ASP Conference Series, Vol. 353, p. 211
- van Loon et al. (1999) van Loon, J. Th., Groenewegen, M. A. T., de Koter, A., Trams, N. R., Waters, L. B. F. M., Zijlstra, A. A., Whitelock, P. A., & Loup, C. 1999, A&A, 351, 559
- van Loon et al. (2005) van Loon, J. Th., Cioni, M.-R. L., Zijlstra, A. A., & Loup, C. 2005, A&A, 438, 273
- van Loon et al. (2006) van Loon, J. Th., Marshall, J. R., Cohen, M., Matsuura, M., Wood, P. R., Yamamura, I., & Zijlstra, A. A. 2006, A&A, 447, 971
- Villaver et al. (2004) Villaver, E., García-Segura, G., & Manchado, A. 2004, RevMexA&A, 22, 140
- Waters et al. (1998) Waters, L. B. F. M., Waelkens, C., Van Winckel, H., Molster, F. J., Tielens, A. G. G. M., van Loon, J. Th., Morris, P. W., Cami, J., Bouwman, J., de Koter, A., de Jong, T., & de Graauw, Th. 1998, Nature, 391, 868
- Whitelock et al. (1991) Whitelock, P., Feast, M., & Catchpole, R. 1991, MNRAS, 248, 276
- Whitelock et al. (1994) Whitelock, P. A., Menzies, J., Feast, M., Marang, F., Carter, B., Roberts, G., Catchpole, R., & Chapman, J. 1994, MNRAS, 267, 711
- Whitney et al. (2003) Whitney, B. A., Wood, K., Bjorkman, J. E., & Wolff, M. J. 2003, ApJ, 591, 1049
- Winters et al. (2000) Winters, J. M., Le Bertre, T., Jeong, K. S., Helling, Ch., & Sedlmayr, E. 2000, A&A, 361, 641
- Wood et al. (1992) Wood, P. R., Whiteoak, J. B., Hughes, S. M. G., Bessell, M. S., Gardner, F. F., & Hyland, A. R. 1992, ApJ, 397, 552
- Yorke (1980) Yorke, H. W. 1980, A&A, 86, 286
- Zijlstra et al. (1996) Zijlstra, A. A., Loup, C., Waters, L. B. F. M., Whitelock, P. A., van Loon, J. Th., & Guglielmo, F. 1996, MNRAS, 279, 32