Star formation rates and stellar masses in 1 gamma ray burst hosts11affiliation: This work is based in part on observations made with the Spitzer Space Telescope, which is operated by the Jet Propulsion Laboratory, California Institute of Technology, under a contract with NASA.
Abstract
We analyse 4.5, 8 and 24 m band images of six gamma ray burst host galaxies at redshifts close to 1. We constrain their star formation rates (SFR) based on the entire available spectral energy distribution rather than the 24 m band only. Further, we estimate their stellar masses () based on rest frame band luminosities. Our sample spans a wide range of galaxy properties: derived SFRs range from less than 10 to a few hundred solar masses per year; values of range from 109 to 1010 with a median of 5.6 109 . Comparing the specific star formation rate ( SFR/) of our sample as a function of to other representative types of galaxies (distant red galaxies, Ly emitters, Lyman break galaxies, submillimeter galaxies and 2 galaxies from the Great Observatories Origins Deep Survey-North field), we find that gamma ray burst hosts are among those with the highest .
Subject headings:
cosmology: observations — dust, extinction — galaxies: high redshift — galaxies: ISM — gamma rays: bursts — infrared: galaxies1. Introduction
A canonical model is well established for long duration gamma ray bursts (GRB): association with stellar core collapse events and hence with high mass star formation (e.g. Hjorth et al., 2003; Stanek et al., 2003; Zeh, Klose & Hartmann, 2004; Campana et al., 2006). The emerging picture, however, is complex. Most GRB host galaxies are faint and blue (Fruchter et al., 1999; Le Floc’h et al., 2003). A few hosts show tentative evidence of very high star formation rates (SFRs; Chary, Becklin & Armus, 2002; Berger et al., 2003), but their optical properties do not appear typical of the galaxies found in blind submillimeter galaxy surveys (Tanvir et al., 2004; Christensen, Hjorth & Gorosabel, 2004; Fruchter et al., 2006).
The Spitzer (Werner et al., 2004) IRAC (Infrared Array Camera; Fazio et al., 2004) and MIPS (Multiband Imager Photometer for Spitzer; Rieke et al., 2004) photometry, together with optical, near IR, submillimeter and radio observations, can help establish how GRB hosts relate to other high redshift galaxy populations. This is essential if we are to understand the full range of properties of star forming galaxies at high redshifts and exploit the potential of GRBs as more general probes of cosmic star formation.
In this Letter we study a subsample of the 16 GRB hosts observed with Spitzer by Le Floc’h et al. (2006). We compute SFRs, dust masses () and stellar masses () for hosts at redshifts close to 1. This redshift is particularly relevant because it has been argued that the global SFR peaks there (Madau et al., 1998). To determine SFRs we fit full (optical to radio) spectral energy distributions (SED), which allows us to calculate the most accurate and robust values for the SFR in a sample of GRB host galaxies to date. At 1 is constrained by 850 m SCUBA observations. To determine we fit observed 4.5 m fluxes. The estimator is well calibrated for 1 (Labbé et al., 2005) since the 4.5 m observed wavelength corresponds to the rest frame band. This gives us, for the first time, an accurate value of the stellar mass in those hosts. We assume an = 0.3, = 0.7 cosmology with = 70 km s-1 Mpc-1.
| Redshift | SFRbbWe have corrected all the SFRs quoted to account for differences in their IMF scales with respect to our choice of a Salpeter IMF (0.1–100 ; Salpeter, 1955). ( yr-1) | |||||||||
|---|---|---|---|---|---|---|---|---|---|---|
| aaUpper limits are quoted at the 3 level, while errors are 1. | aaUpper limits are quoted at the 3 level, while errors are 1. | aaUpper limits are quoted at the 3 level, while errors are 1. | ||||||||
| GRB Host | Ref. | (Jy) | (Jy) | (Jy) | UVcont | Ref. | (10) | (10) | ||
| 970508 (catalog GRB970508) …… | 0.83 | 1 | 3.1 | 17 | 82 | 2.5ccCorrected using the slope technique (Chary et al., 2002, and references therein), typically larger than the Balmer lines decrement correction. | 7 | 0.4–26 | 0.3–1.1 | 1.5 |
| 970828 (catalog GRB970828) …… | 0.96 | 2 | 3.9 1.1 | 18 | 94 17 | 1.1ddUncorrected for internal extinction; Christensen et al. 2005 argue for no extinction in the host of GRB 981226 (catalog GRB981226). | 2 | 30 8 | 1.3 | 2.5 |
| 980613 (catalog GRB980613) …… | 1.10 | 3 | 37 1 | 33 8 | 169 36 | 70ccCorrected using the slope technique (Chary et al., 2002, and references therein), typically larger than the Balmer lines decrement correction. | 7 | 428 51 | 19 | 31 |
| 980703 (catalog GRB980703) …… | 0.97 | 4 | 11 2 | 24 | 85 | 30ccCorrected using the slope technique (Chary et al., 2002, and references therein), typically larger than the Balmer lines decrement correction. | 7 | 3.8–226 | 2.7–10 | 7.2 |
| 981226 (catalog GRB981226) …… | 1.11 | 5 | 4.5 1.4 | 31 | 87 | 1.2ddUncorrected for internal extinction; Christensen et al. 2005 argue for no extinction in the host of GRB 981226 (catalog GRB981226). | 5 | 1.0–84 | 0.7–3.7 | 3.9 |
| 990705 (catalog GRB990705) …… | 0.84 | 6 | 19 1 | 18 | 159 31 | 5ddUncorrected for internal extinction; Christensen et al. 2005 argue for no extinction in the host of GRB 981226 (catalog GRB981226). | 6 | 4.5–173 | 3.2–7.7 | 9.2 |
2. Data
From the sample of 16 GRB hosts (GTO programme 76) we selected six that have 1 (1). The reader is referred to Le Floc’h et al. (2006) for a detailed description of the full data set. Each host has been imaged with IRAC and MIPS. IRAC observations were 4.5 m (300 s per host; scale = 1.220″ pixel-1; FoV = 5.21 5.21 arcmin2; instrumental PSF FWHM = 1.98″) and 8.0 m (300 s per host; scale = 1.213″ pixel-1; FoV = 5.18 5.18 arcmin2; instrumental PSF FWHM = 1.72″). MIPS observations were 24 m (420 s per host; scale = 2.45″ pixel-1; FoV = 5.23 5.23 arcmin2; instrumental PSF FWHM 6″).
We used official Spitzer Post Basic Calibrated Data products (carefully verified with our own reductions). Host extraction was based on archival imagery world coordinate system calibration and visually confirmed with optical comparison images from the literature. The median separation between the host centroid in each image and the best set of coordinates published was about 1″. We measured the flux densities over a circled area of radius 2 pixels in IRAC and 3 pixels in MIPS. Aperture corrections were then applied to account for the extended size of the PSF. Our photometry, presented in Table 1, is consistent with Le Floc’h et al. (2006).
3. Spectral Energy Distribution Fits
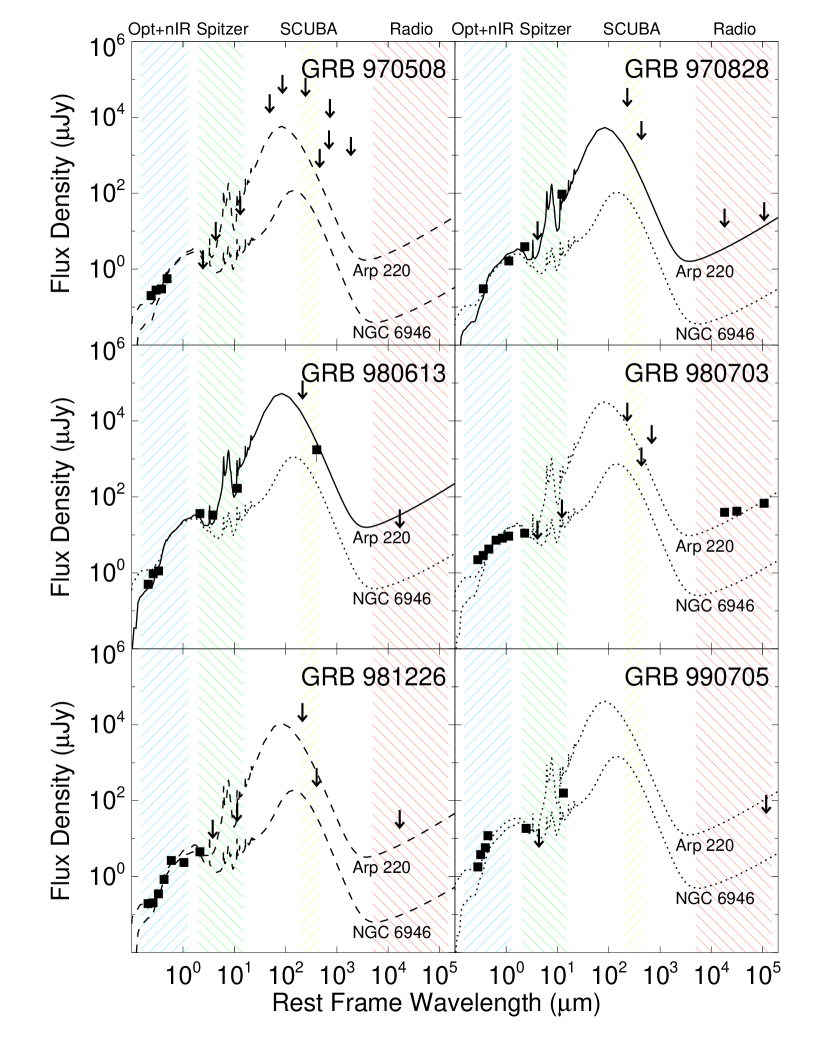
Photometry available for our sample includes our Spitzer flux densities and data points from the literature, spanning from optical to radio wavelengths. We scaled a set of SED templates to fit these data: Arp 220 (catalog ), an archetypal ultraluminous IR galaxy (ULIRG); NGC 6946 (catalog ), a well characterised, blue, star forming galaxy (both Silva et al., 1998); and 64 SED templates ranging from starbursts to quiescent ones (Dale et al., 2001; Dale & Helou, 2002). The spectral width of the different bandpass filters was taken into account. Fitting was evaluated by means of a weighted least squares method.
Figure 1 shows our models. The Arp 220 (catalog ) template best fits the hosts of GRBs 970828 (catalog GRB970828) and 980613 (catalog GRB980613). For these two hosts the data rule out the other SED templates; we have plotted the NGC 6946 (catalog ) template for comparison. For the hosts of GRBs 970508 (catalog GRB970508) and 981226 (catalog GRB981226) we could not unambiguously discriminate a best fitting SED template, so we plotted those models yielding the highest and lowest values for the SFR (see 3.1 and Table 1). Model degeneracy was expected in these two cases because we only have optical–IR data. For the remaining two hosts we also plotted those models yielding the highest and lowest values for the SFR. For GRB 980703 (catalog GRB980703), the Arp 220 (catalog ) template approximately reproduced the radio flux densities but was inconsistent with the 24 m upper limit, while the NGC 6946 (catalog ) template was consistent with the 24 m upper limit but underestimated the radio flux densities. For GRB 990705 (catalog GRB990705), the Arp 220 (catalog ) template overestimated the 24 m flux density and was marginally inconsistent with the 8 m upper limit, while the NGC 6946 (catalog ) template underestimated the 24 m flux density. Reproducing the SEDs of these two galaxies is problematic and may require dust with properties different from those in our templates. The Dale et al. (2001) and Dale & Helou (2002) templates yielded SFR values between those of the Arp 220 (catalog ) and NGC 6946 (catalog ) models for all the hosts in our sample.
For each host we may be fitting subcomponents that differ in their properties (Charmandaris et al., 2004). For instance, for GRB 980613 (catalog GRB980613) some components detected in the optical/near IR bands (Hjorth et al., 2002; Djorgovski, Bloom & Kulkarni, 2003) are offset by 2.5″ from the centroid (Le Floc’h et al., 2006). While such effects might induce some scatter in the SEDs we can still utilise the SED templates as powerful diagnostic tools for the SFRs of the sample.
3.1. Star Formation Rates
Using our SED fitting models, we calculated the SFR for each host using IR luminosities. We converted flux densities into luminosity densities using (Hogg et al., 2002), where is the luminosity distance, and scaled the SED templates to match the data points. IR luminosities () were obtained integrating under the scaled SED templates from 8 to 1000 m (rest frame). This wavelength range was chosen so the SFRs could be computed using SFR erg s-1 (Kennicutt, 1998). The results are summarised in Table 1. Errors quoted are statistical and assume the template is a good representation of the data. In addition there may be significant systematic errors related, for example, to how well the template represents the actual SED (Michałowski, 2006), the to SFR conversion (Kennicutt, 1998) (both of the same order, 30%), or a factor of two from the choice of initial mass function (IMF; Erb et al., 2006a).
For the hosts of GRBs 970508 (catalog GRB970508), 980703 (catalog GRB980703), 981226 (catalog GRB981226) and 990705 (catalog GRB990705), the lower end of their SFR ranges indicates low star formation, consistent with the estimates from the UV continuum and, in GRB 981226 (catalog GRB981226), with no internal extinction (Christensen, Hjorth & Gorosabel, 2005). The host of GRB 970828 (catalog GRB970828) is a moderately star forming galaxy, in good agreement with Le Floc’h et al. (2006). The host of GRB 980613 (catalog GRB980613) is characterised by high star formation activity. Our SFR value for this host is 5 times higher than the one obtained by Le Floc’h et al. (2006) with a lower uncertainty, because we have fitted the entire SED, as opposed to only the flux density at 24 m. We verified that if we base our calculations exclusively on the 24 m flux densities we reproduce the results in Le Floc’h et al. (2006) for all hosts.
3.2. Dust Masses
Dust emission dominates submillimeter wavelengths. The total in a galaxy can be estimated from its rest frame 450 m flux density: ; where is the flux density at an observed wavelength corresponding to the rest frame wavelength of 450 m at = 1, interpolated from the fitted SED templates; is the frequency (666.21 GHz) corresponding to a wavelength of 450 m; is the mass absorption coefficient with being the dust emissivity index; and B() is the Planck function (Taylor et al., 2005). We assumed optically thin dust emitting a grey spectrum. This method yields statistical errors of 25% (Taylor et al., 2005). The ranges in are estimates of the systematic, model dependent error. Our results are listed in Table 1. The derived median, = 8 106 (calculated from the lowest value for each host), is consistent with the distribution for starburst galaxies (4 105 to 7 108 ) found by Taylor et al. (2005).
4. Stellar Masses
We estimated from rest frame band fluxes (e.g. Glazebrook et al., 2004). depends to some extent on the composition of the stellar population (Portinari, Sommer-Larsen & Tantalo, 2004) or, according to Labbé et al. (2005) who used Bruzual & Charlot (2003) with a Salpeter IMF, on the rest frame colour, age and . GRB hosts are blue, young and faint (e.g. Le Floc’h et al., 2003; Berger et al., 2003; Christensen et al., 2004); thus, we assume 0.1 (lowest detection in Labbé et al. 2005 is 0.16), obtaining a robust lower limit. Table 1 summarises our estimates. Van der Wel et al. (2006) examined redshift dependent systematics in determining from broad band SEDs. They found no significant bias for Bruzual & Charlot (2003) models with a Salpeter IMF (Salpeter, 1955).
5. Discussion
We have found the hosts in our sample to span a wide range of properties. Their SEDs are fitted with templates that vary from a blue, star forming galaxy to a ULIRG. Their SFRs and are quite different, ranging from the host of GRB 980613 (catalog GRB980613), which is forming a few hundred solar masses a year with = 3 1010 , to the host of GRB 970508 (catalog GRB970508), which is forming of the order of 10 a year with = 1.5 109 .
We find that our SFR values are significantly higher (up to a factor of 30) than the lower limits from the rest frame UV continuum emission (; see Table 1) and higher (by a factor of 6) than those corrected with the slope technique (Chary et al., 2002). GRBs 970828 (catalog GRB970828), 980613 (catalog GRB980613) and 980703 (catalog GRB980703) illustrate how even the best estimates of dust extinction in a galaxy from the UV slope may fall short, not only for ULIRGs (Chary & Elbaz, 2001), but also for LIRGs (i.e. 1012 1011 ). Our SFR value for GRB 981226 (catalog GRB981226) is consistent with no internal extinction (Christensen et al., 2005).
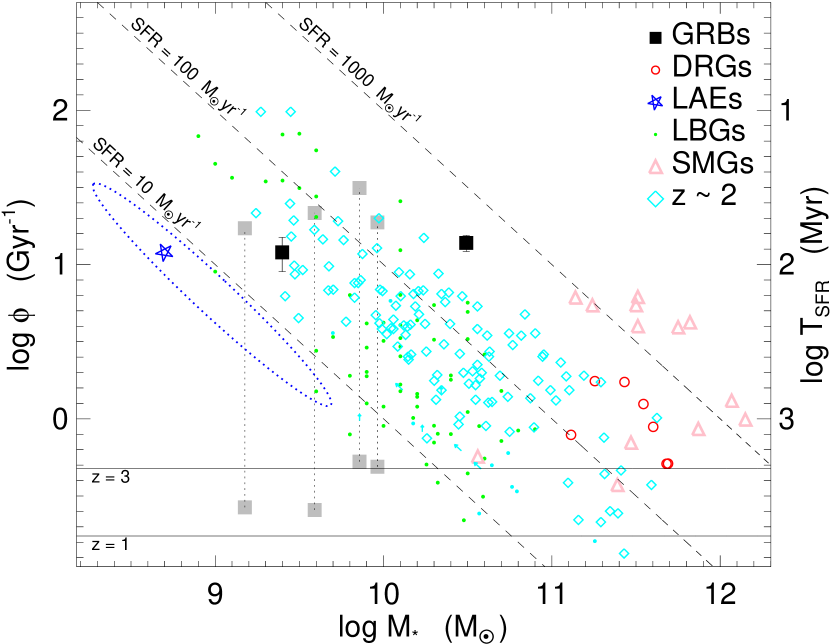
The specific star formation rate ( SFR/) gives an indication of how intensely star forming a galaxy is. In Figure 2 we have plotted versus for ours and five other representative galaxy samples: distant red galaxies (DRG), Ly emitters (LAE), Lyman break galaxies (LBG), submillimitre galaxies (SMG) and an ensemble of optically selected, 2 galaxies from the Great Observatories Origins Deep survey-North field. GRB hosts have some of the highest values, as previously suggested by Christensen et al. (2004). represents the SFR timescale, so high values are indicative of GRBs tracing young, starbursting galaxies.
The different methods that have been used to derive the SFRs of the various samples plotted in Figure 2 likely introduce systematic offsets. Likewise, to determine , model fitting to the full SED could better account for variations in . For high SFR galaxies, ongoing star formation contributes to the near IR emission, especially as they lack an old stellar population. High galaxies are particularly vulnerable to this effect. Nevertheless, Figure 2 illustrates where, within the larger picture, our hosts fall.
We have shown the capabilities of IR observations to characterise GRB host galaxies and have compared values of for different types of galaxies irrespective of their redshift. Unfortunately, the selection effects are difficult to quantify for the present small sample, which therefore does not allow a robust statistical analysis. The next step to increase our understanding of GRB hosts will be to extend our mid and far IR observed sample, as a larger, well selected one will tell us more about the span of host properties (i.e. SFR, and ). Future work should include full population synthesis modelling and address the redshift dependence of .
References
- Barmby et al. (2004) Barmby, P. et al. 2004, ApJS, 154, 97
- Berger et al. (2003) Berger, E., Cowie, L.L., Kulkarni, S.R., Frail, D.A., Aussel, H. & Barger, A.J. 2003, ApJ, 588, 99
- Berger et al. (2001) Berger, E., Kulkarni, S.R. & Frail, D.A. 2001, ApJ, 560, 652
- Bloom et al. (1998) Bloom, J.S., Djorgovski, S.G., Kulkarni, S.R. & Frail, D.A. 1998, ApJ, 507, L25
- Borys et al. (2005) Borys, C., Smail, I., Chapman, S.C., Blain, A.W., Alexander, D.M. & Ivison, R.J. 2005, ApJ, 635, 853
- Bremer et al. (1998) Bremer, M., Krichbaum, T.P., Galama, T.J., Castro-Tirado, A.J., Frontera, F., van Paradijs, J., Mirabel, I.F. & Costa, E. 1998, A&A, 332, L13
- Bruzual & Charlot (2003) Bruzual, G. & Charlot, S. 2003, MNRAS, 344, 1000
- Campana et al. (2006) Campana, S. et al. 2006, Nature, 442, 1008
- Chapman et al. (2005) Chapman, S.C., Blain, A.W., Smail, I. & Ivison, R.J. 2005, ApJ, 622, 772
- Charmandaris et al. (2004) Charmandaris, V., Le Floc’h, E. & Mirabel, I.F. 2004, ApJ, 600, L15
- Chary et al. (2002) Chary, R., Becklin, E.E. & Armus, L. 2002, ApJ, 566, 229
- Chary & Elbaz (2001) Chary, R. & Elbaz, D. 2001, ApJ, 556, 562
- Christensen et al. (2004) Christensen, L., Hjorth, J. & Gorosabel, J. 2004, A&A, 425, 913
- Christensen et al. (2005) . 2005, ApJ, 631, L29
- Dale & Helou (2002) Dale, D.A. & Helou, G. 2002, ApJ, 576, 159
- Dale et al. (2001) Dale, D.A., Helou, G., Contursi, A., Silbermann, N.A. & Kolhatkar S. 2001, ApJ, 549, 215
- Djorgovski et al. (2003) Djorgovski, S.G., Bloom, J.S. & Kulkarni, S.R. 2003, ApJ, 591, L13
- Djorgovski et al. (2001) Djorgovski, S.G., Frail, D.A., Kulkarni, S.R., Bloom, J.S., Odewahn, S.C. & Diercks, A. 2001, ApJ, 562, 654
- Djorgovski et al. (1998) Djorgovski, S.G., Kulkarni, S.R., Bloom, J.S., Goodrich, R., Frail, D.A., Piro, L. & Palazzi, P. 1998, ApJ, 508, L17
- Erb et al. (2003) Erb, D.K., Shapley, A.E., Steidel, C.C., Pettini, M., Adelberger, K.L., Hunt, M.P., Moorwood, A.F.M. & Cuby, J.G. 2003, ApJ, 591, 101
- Erb et al. (2006a) Erb, D.K., Steidel, C.C., Shapley, A.E., Pettini, M., Reddy, N.A. & Adelberger, K.L. 2006a, ApJ, 646, 107
- Erb et al. (2006b) . 2006b, ApJ, 647, 128
- Fazio et al. (2004) Fazio, G. et al. 2004, ApJS, 154, 10
- Fruchter et al. (1999) Fruchter, A.S. et al. 1999, ApJ, 519, L13
- Fruchter et al. (2006) . 2006, Nature, 441, 463
- Gawiser et al. (2006) Gawiser, E. et al. 2006, ApJ, 642, L13
- Glazebrook et al. (2004) Glazebrook, K. et al. 2004, Nature, 430, 181
- Hanlon et al. (2000) Hanlon, L. et al. 2000, A&A, 359, 941
- Hjorth et al. (2002) Hjorth, J. et al. 2002, ApJ, 576, 113
- Hjorth et al. (2003) . 2003, Nature, 423, 847
- Hogg et al. (2002) Hogg, D.W., Baldry, I.K., Blanton, M.R. & Eisenstein D.J. 2002, preprint (astro-ph/0210394)
- Kennicutt (1998) Kennicutt, Jr., R.C. 1998, ARA&A, 36, 189
- Labbé et al. (2005) Labbé, I. et al. 2005, ApJ, 624, L81
- Le Floc’h et al. (2006) Le Floc’h, E., Charmandaris, V., Forrest, W.J., Mirabel, I.F., Armus, L. & Devost, D. 2006, ApJ, 642, 636
- Le Floc’h et al. (2002) Le Floc’h, E. et al. 2002, ApJ, 581, L81
- Le Floc’h et al. (2003) . 2003, A&A, 400, 499
- Madau et al. (1998) Madau, P., Pozzetti, L. & Dickinson, M. 1998, ApJ, 498, 106
- Michałowski (2006) Michałowski, M.J. 2006, Master’s thesis, Dark Cosmology Centre, Niels Bohr Instituttet, Københavns Universitet, Denmark
- Portinari et al. (2004) Portinari, L., Sommer-Larsen, J. & Tantalo, R. 2004, MNRAS, 347, 691
- Reddy et al. (2006) Reddy, N.A., Steidel, C.C., Fadda, D., Yan, L., Pettini, M., Shapley, A.E., Erb, D.K. & Adelberger, K.L. 2006, ApJ, 644, 792
- Rieke et al. (2004) Rieke, G. et al. 2004, ApJS, 154, 25
- Salpeter (1955) Salpeter, E.E. 1955, ApJ, 121, 161
- Shapley et al. (2001) Shapley, A.E., Steidel, C.C., Adelberger, K.L., Dickinson, M., Giavalisco, M. & Pettini, M. 2001, ApJ, 562, 95
- Shepherd et al. (1998) Shepherd, D.S., Frail, D.A., Kulkarni, S.R. & Metzger, M.R. 1998, ApJ, 497, 859
- Silva et al. (1998) Silva, L., Granato, G.L., Bressan, A. & Danese, L. 1998, ApJ, 509, 103
- Smith et al. (1999) Smith, I.A. et al. 1999, A&A, 347, 92
- Sokolov et al. (2001) Sokolov, V.V. et al. 2001, A&A, 372, 438
- Stanek et al. (2003) Stanek, K.Z. et al. 2003, ApJ, 591, L17
- Tanvir et al. (2004) Tanvir, N.R. et al. 2004, MNRAS, 352, 1073
- Taylor et al. (2005) Taylor, E.L. et al. 2005, MNRAS, 361, 1352
- Van der Wel et al. (2006) van der Wel, A., Franx, M., Wuyts, S., van Dokkum, P.G., Huang, J., Rix, H.W. & Illingworth, G.D. 2006, ApJ, 652, 97
- van Dokkum et al. (2004) van Dokkum, P.G. et al. 2004, ApJ, 611, 703
- Vreeswijk et al. (1999) Vreeswijk, P.M. et al. 1999, ApJ, 523, 171
- Werner et al. (2004) Werner, M. et al. 2004, ApJS, 154, 1
- Zeh et al. (2004) Zeh, A., Klose, S. & Hartmann, D.H. 2004, ApJ, 609, 952