AGN heating in the centres of galaxy groups: a statistical study
Abstract
We present gas temperature, density, entropy and cooling time profiles for the cores of a sample of 15 galaxy groups observed with Chandra. We find that the entropy profiles follow a power-law profile down to very small fractions of . Differences between the gas profiles of groups with radio loud and radio quiet BGGs are only marginally significant, and there is only a small difference in the relations, for the central regions we study with Chandra, between the radio-loud and radio-quiet objects in our sample, in contrast to the much larger difference found on scales of the whole group in earlier work. However, there is evidence, from splitting the sample based on the mass of the central black holes, that repeated outbursts of AGN activity may have a long term cumulative effect on the entropy profiles. We argue that, to first-order, energy injection from radio sources does not change the global structure of the gas in the cores of groups, although it can displace gas on a local level. In most systems, it appears that AGN energy injection serves primarily to counter the effects of radiative cooling, rather than being responsible for the similarity breaking between groups and clusters.
keywords:
galaxies: active - X-rays: galaxies: clusters1 Introduction
Over the past decade cosmological simulations have become increasingly sophisticated to the point where we can now follow the formation and evolution of individual galaxy groups and clusters (e.g. Thomas et al., 2001). Our knowledge about the evolution of groups and clusters has also increased, due to a combination of detailed X-ray studies using ROSAT , Chandra and XMM-Newton and deep, low frequency radio studies using the VLA radio telescope (for example Nulsen et al. 2005, Heinz et al. 2002, Fabian et al. 2000).
However, our understanding of galaxy groups and clusters is currently impeded by two ‘heating problems’. Whilst recent work has shown that the dark matter distribution of galaxy clusters scales self-similarly (e.g. Pointecouteau et al. 2005 and Vikhlinin et al. 2006), the baryonic component (the hot gas) does not follow self-similar scaling models (see for example, Sanderson et al. 2003 and Popesso et al. 2005). This appears to result from excess entropy in low mass clusters (Ponman et al. 1999 and Ponman et al. 2003), which might be a consequence of feedback from supernova explosions or active galactic nuclei (AGN). Secondly, the hot gas in cluster cores is not cooling at the rates expected from the short cooling times inferred (e.g. Peterson et al., 2001), suggesting that some heating process must act to offset cooling. Since massive early-type galaxies are found in the cores of almost all X-ray bright groups and clusters, and are believed to host massive black holes, AGN heating provides an attractive source for the required feedback (e.g. Binney & Tabor 1995, Brüggen & Kaiser 2001, Begelman 2001, Fabian et al. 2001).
These models predict that a radio source could heat the IGM by doing work on the hot gas both whilst the radio source is active, and once the central AGN has switched off. Models such as those described in Heinz et al. (1998) show that if a powerful radio source erupts in a galaxy cluster, it will expand supersonically, heating the IGM via shock heating. A less powerful source in the early stages of its evolution may show similar behaviour (see for example Reynolds et al. 2001 for simulations and Kraft et al. 2003 for observations of this phenomenon in Centaurus A). Further, once the radio bubbles are no longer being ‘fed’ by a central source, and begin to come into pressure equilibrium with the IGM, additional work can be done (see for example Nusser et al. 2006). Finally, the inflated bubble will rise due to buoyancy, displacing gas further. It is thought that if repeated cycles of radio outbursts occur, and the effects are integrated over time, then radio source heating may counteract catastrophic cooling, even when no active source is present (Begelman, 2001).
It has also been suggested that the energy input into the IGM by a radio-loud AGN may also be responsible for similarity breaking in groups and clusters (for example Kaiser 1991, Valageas & Silk 1999, and Nath & Roychowdhury 2002). Occam’s razor suggests that both similarity breaking and the prevention of catastrophic cooling may be related, since both occur in the same systems, and a similar source of energy injection is thought to cause both. The best place to look for evidence of such a connection is probably not in rich clusters, but galaxy groups, since the gas in the shallower potential wells of groups should be more strongly affected by any embedded heat source, and it is in groups that excess entropy is most clearly apparent.
The recent study of Croston et al. (2005) found that the bulk X-ray properties of galaxy groups are related to the presence of radio galaxies within them; groups with radio-loud AGN tend to fall below the relation, establishing a prima facie case for a connection between AGN heating and group scaling properties. However, since AGN radio outbursts are thought to be periodic, and the way in which the intergalactic gas responds to the outbursts is poorly understood, it is impossible to say whether there are long-lasting and cumulative effects on the baryonic components of groups (such as would be required to account for similarity breaking) or whether AGN activity simply induces short-lived excursions in the plane with no lasting effects on the temperature and entropy of the systems. Further, the inference that it is the radio source that has an effect on the IGM, rather than the conditions in the IGM being responsible for triggering a radio source, may be incorrect; it could be that the state of the IGM and the conditions required to trigger a radio source form a feedback loop, such that the IGM attains a specific state, which triggers a radio outburst, which in turn affects the IGM, and eventually quenches the outburst, allowing the IGM to return back to the initial state which triggered the outburst.
There appear to be three possible interpretations:
-
1.
The radio source could modify the observed X-ray properties, through heating or displacing gas.
-
2.
Alternatively, the observed X-ray properties could be causing the radio source by providing conditions that favour the triggering of a radio outburst. For example, the hot gas could provide a suitable reservoir of gas for Bondi accretion (e.g. Allen et al., 2006), or the hot gas may have a steep pressure gradient required to collimate large scale jets such as those found in 3C31, in the group NGC 383 (Laing & Bridle, 2002).
-
3.
There is a third property of the system, such as BGG mass (see Section 3.5), or overall mass of the group, which correlates with both the radio and X-ray properties, and is responsible for both.
In this paper, we use a sample of 15 galaxy groups to search for evidence of radio source and hot gas interaction at the centres of galaxy groups and to try to distinguish between the interpretations discussed above. The groups were taken from the GEMS sample of Osmond & Ponman (2004), and those groups in their G and H samples that had good quality archival Chandra data available were used for this study (and correspond to a subset of the Croston et al. (2005) sample). It should be noted that the parent GEMS sample is not, in itself, unbiased, favouring systems with higher X-ray luminosities. In this study, we have used a subset of the GEMS sample which had available archival Chandra data with observations longer than 30 ks; thus we do not expect to explicitly bias our sample further. However, from Fig. 1, it can be seen that compared to the sample of Croston et al. (2005) our selection procedure does tend to favour higher luminosity systems. Since the X-ray luminosity range in which the ROSAT sample shows effects of heating is nevertheless adequately sampled by our Chandra sample, this slight bias should not affect our conclusions.
We present our sample and outline our data analysis in Section 2; we discuss our results in Section 3, and present our conclusions in Section 5. We assume that throughout.

2 Data Analysis
2.1 Details of the sample and data reduction
Details of the groups used in this study are given in Table 1. Each Chandra dataset was cleaned following the procedure outlined in the ciao threads on-line; the data were reprocessed to apply the latest calibration products, and a new events file was created. Periods of high background were then removed from the data by creating a light-curve of the background, and using a 3- clipping algorithm to identify and remove times of high background. These datasets were then used in the subsequent spectral and imaging analysis.
| source name | g roup centre co-ordinates | Chandra obs | date observed | cleaned exposure | |||
|---|---|---|---|---|---|---|---|
| (kpc) | number | time (ks) | |||||
| NGC 383 | 0.017 | 01 07 25 | 32 24 46 | 510 | 2147 | 2000-11-06 | 42.8 |
| NGC 533 | 0.019 | 01 25 31 | 01 45 34 | 410 | 2880 | 2002-07-28 | 37.6 |
| NGC 720 | 0.0058 | 01 53 01 | -13 44 20 | 260 | 492 | 2000-10-12 | 39.6 |
| NGC 741 | 0.019 | 01 56 21 | 05 37 45 | 440 | 2223 | 2001-01-28 | 30.3 |
| NGC 1407 | 0.0059 | 03 40 12 | -18 34 49 | 400 | 791 | 2000-08-16 | 48.6 |
| NGC 3607 | 0.0032 | 11 16 55 | 18 03 04 | 200 | 2073 | 2001-06-12 | 38.5 |
| NGC 4073 | 0.020 | 12 04 27 | 01 53 35 | 510 | 3234 | 2002-11-24 | 30.0 |
| NGC 4261 | 0.0075 | 12 19 23 | 05 49 29 | 460 | 834 | 2000-05-06 | 34.4 |
| NGC 4325 | 0.026 | 12 23 07 | 10 37 15 | 350 | 3232 | 2003-02-04 | 30.1 |
| NGC 4636 | 0.0031 | 12 42 50 | 02 41 15 | 350 | 4415 | 2003-02-15 | 74.3 |
| HCG 62 | 0.014 | 12 53 06 | -09 12 14 | 490 | 921 | 2000-01-25 | 47.4 |
| NGC 5044 | 0.0090 | 13 15 24 | -16 23 09 | 440 | 3225 | 2002-06-07 | 83.1 |
| NGC 5171 | 0.023 | 13 29 22 | 11 44 06 | 410 | 3216 | 2002-12-10 | 34.7 |
| NGC 5846 | 0.0057 | 15 06 29 | 01 36 21 | 320 | 788 | 2000-05-24 | 29.9 |
| NGC 6338 | 0.027 | 17 15 23 | 57 24 41 | 620 | 4194 | 2003-09-17 | 47.3 |
NOTES: is calculated using the ROSAT temperatures of Osmond and Ponman (2004), and the scaling relation of (Willis et al., 2005).
| Source | 1.4 GHz radio power | radio flux | size of radio source | |||
|---|---|---|---|---|---|---|
| reference | at 1.4 GHz(kpc) | reference | mag. | |||
| NGC 383 | 1 | 360 | 288.0 | 3 | -23.57 | |
| NGC 533 | 1 | 20 | 224.0 | 4 | -25.84 | |
| NGC 720 | 2 | - | 273.0 | 3 | -24.57 | |
| NGC 741 | 1 | 150 | 270.0 | 5 | -26.13 | |
| NGC 1407 | 1 | 10 | 259.7 | 6 | -25.15 | |
| NGC 3607 | 1 | 4 | 240.0 | 7 | -23.49 | |
| NGC 4073 | 2 | - | 276.0 | 8 | -26.04 | |
| NGC 4261 | 1 | 80 | 316.0 | 9 | -25.10 | |
| NGC 4325 | 2 | - | - | -24.77 | ||
| NGC 4636 | 1 | 3 | 208.0 | 9 | -23.97 | |
| HCG 62 | 2 | 15 | 251.0 | 10 | -25.09 | |
| NGC 5044 | 1 | 15 | 240.0 | 11 | -25.08 | |
| NGC 5171 | 2 | - | - | -24.73 | ||
| NGC 5846 | 2 | 1 | 261.0 | 9 | -24.93 | |
| NGC 6338 | 2 | 6 | 347.0 | 12 | -25.84 |
NOTES: Column 3 gives the reference for the radio flux density:
1 Radio flux from NED.
2 Radio flux from NVSS (Condon et al., 1998).
Column 6 gives the reference for galactic velocity dispersion:
3 Smith et al. (2000)
4 Müller et al. (1999)
5 Bonfanti et al. (1995)
6 Beuing et al. (2002)
7 Proctor & Sansom (2002)
8 Fisher et al. (1995)
9 Bernardi et al. (2002)
10 Rampazzo et al. (1998)
11 Carollo et al. (1993)
12 Wegner et al. (1999)
K-band magnitudes collated from 2MASS
2.2 Imaging
For each group, the cleaned data were smoothed using the adaptive smoothing algorithm csmooth which scales the size of the smoothing Gaussian function until a pre-defined number of counts, which corresponds to a user specified significance, is met. This implies that only structure which is ‘real’ in a statistical sense is smoothed.
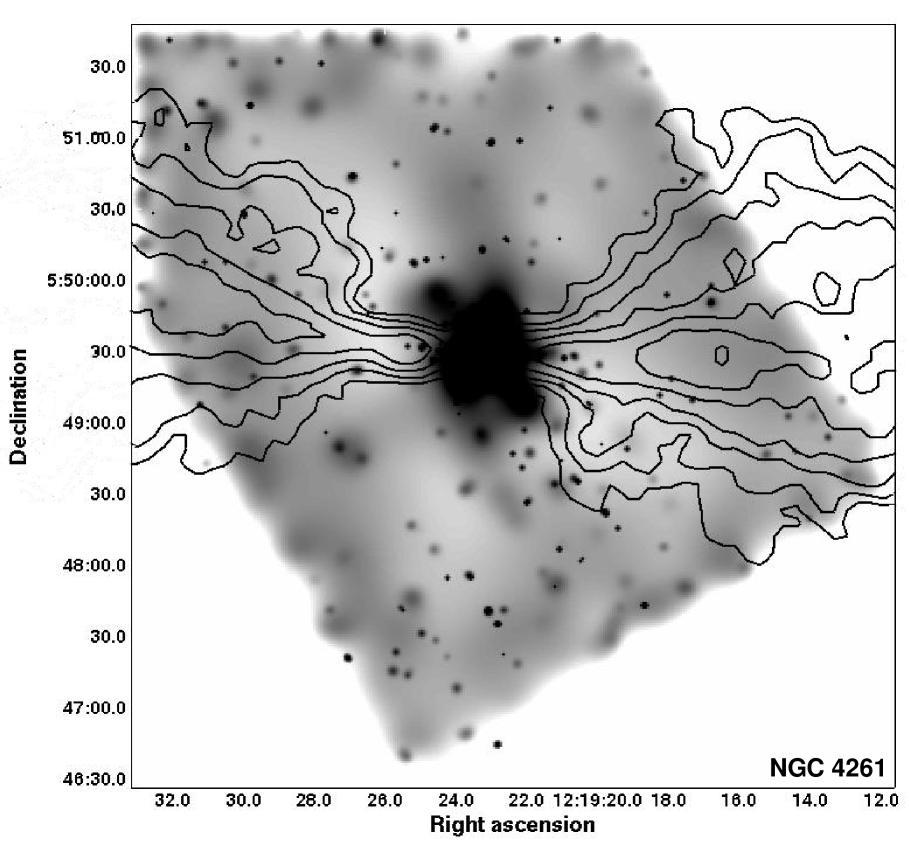
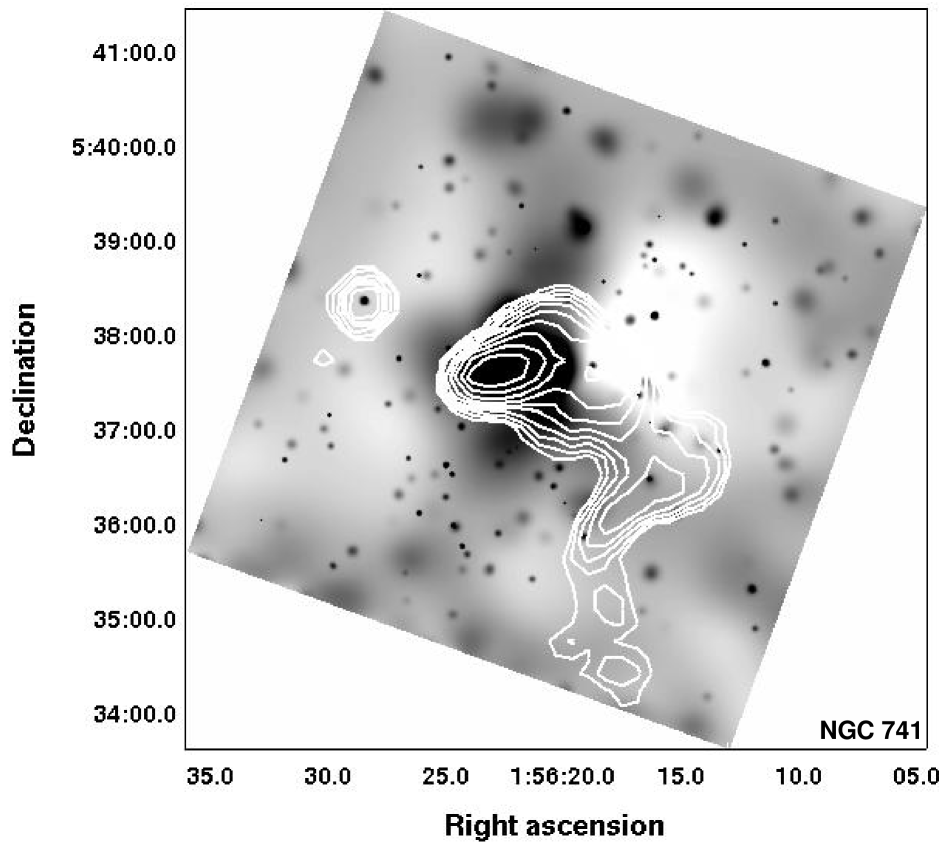
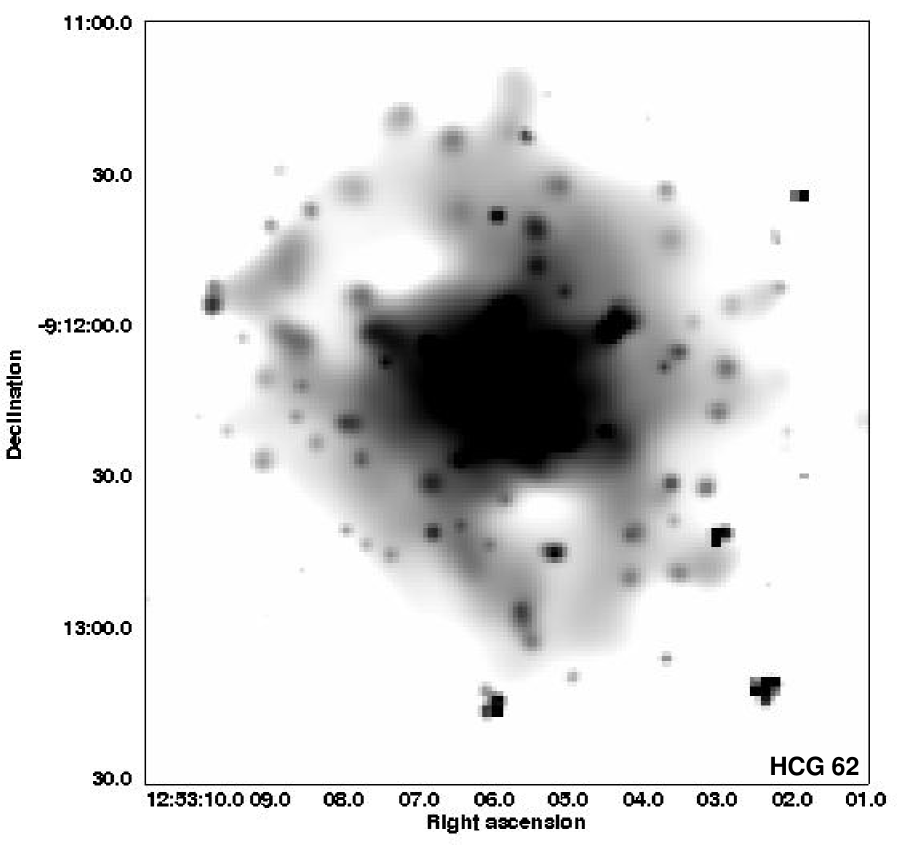
From the images, there does appear to be evidence of disturbed hot gas in some group cores; groups such as NGC 741 (Fig. 2) and HCG 62 (Bîrzan et al., 2004) show ‘ghost’ X-ray cavities, and NGC 4261 shows ‘filaments’ of hot gas outlining the radio lobes (shown in Fig. 2), which also extend to larger scales (see Croston et al., 2005). If the hot gas shows evidence of spatial interaction with the radio plasma injected into the group by the AGN, then it may be the case that a change in radial temperature, density, or entropy distributions could be seen if the AGN is injecting extra energy into the group.
2.3 Spectral analysis
2.3.1 Obtaining temperatures and luminosities
In order to investigate the effect of radio outbursts on the : relation for the inner regions of galaxy groups, spectra were extracted for the systems in the sample out to a fiducial radius of . This radius was used as we had data for all groups in our sample, apart from NGC 4261 which was excluded from the : analysis since the original X-ray observation did not have data out to . Our measurement of was obtained using the relation of Willis et al. (2005), who use the XMM-LSS for a sample of galaxy groups and clusters. In addition to the groups shown in Table 1, we also obtained temperatures and luminosities for a further 4 groups (NGC 1587, NGC 3665, NGC 3923, and IC 1459) that were not included in the original sample due to the quality of the data (and hence did not have a deprojection analysis done, see Section 2.3.2). Spectra were extracted using the CIAO acisspec script, excluding point sources but not the central AGN where one was present, and using a local background immediately outside the region from where the spectrum was extracted. The spectra were fitted in xspec with an absorbed MeKaL model, and a power law for the AGN component (if present) which was left free to fit the data, and a power law with a fixed index of 1.72 to account for any contribution from X-ray binaries. A temperature and unabsorbed luminosity within was measured for each group. The results are shown in Fig 3.


2.3.2 Deprojection
If the radio source in a specific group is having an effect on the bulk properties of the hot gas, rather than simply displacing gas and causing local perturbations, then it might be expected that an effect would be seen in the overall radial properties of the group. If radio source heating is occurring, then elevated temperatures and excess entropy may be present in those groups with current activity, compared to those which are currently radio quiet. By examining the radial profiles of the gas properties, and comparing the profiles of radio-loud groups with those of radio quiet groups, differences in temperature and entropy may be observed.
For these reasons, we analysed the galaxy groups using an onion skin deprojection method to obtain radially deprojected temperature profiles. In doing the onion-skin deprojection, we assumed that the group was spherically symmetric, and that the gas had a filling factor of unity. Spectra were extracted in concentric annuli centred on the brightest group galaxy (BGG), with the outermost annulus being used as a local background. The width of each annulus was determined by the number of counts in each annulus; to do our spectral analysis, a minimum of 1000 counts was required in each annulus. We then followed the deprojection method described in Jetha et al. (2005), fitting each spectrum with a MeKaL model to obtain temperatures and normalizations for each shell.
The normalization of the MeKaL model () is related to the density of the gas in the spherical shell by
| (1) |
where and are the electron and proton densities of the gas and is the angular size distance to the source. Further assuming that , and that the gas to be fitted occupies a volume , then the density of the gas is
| (2) |
The density and temperature profiles obtained from the deprojection were then used to calculate entropy, pressure and cooling time profiles for the sources. We calculate the entropy index, for a radial bin using:
| (3) |
where is the temperature (in K) obtained for the bin, and is the corresponding total density (electron density plus proton density) for the bin. Here is not a measure of the true entropy, but is rather the adiabatic constant – the ratio of the heat capacity for heating at constant pressure to the heat capacity for heating at constant volume (), and is linked to the entropy of the gas () by
| (4) |
where is the Hubble constant scaled to , is the reduced mass of hydrogen, is the mass of a hydrogen atom, and is the specific heat capacity for expansion at constant volume (see Balogh et al., 1999, and references therein). Thus, provides the most direct observational indicator of gas entropy.
Pressure profiles are generated similarly using
| (5) |
In calculating the cooling time, , we note that as most of the groups have temperatures 2, the thermal bremsstrahlung approximation is not valid. Instead, an estimate of the cooling time can be made by dividing the total internal energy of the gas in a given radial bin
| (6) |
by the bolometric luminosity, , obtained from xspec when fitting the data.
However, since the groups are all of different masses, a meaningful comparison of the derived quantities cannot be made without scaling to take the mass differences into account. Here, we use modified self-similar scaling (Voit & Ponman, 2003) such that radial distances are scaled by (the radius at which the density of the system is 500 times the critical density of the universe), temperatures are scaled by , the average temperature of the system (as obtained from the ROSAT data of (Osmond & Ponman, 2004) with cool cores excluded from the spectral analysis), density by , entropy by , pressure by . We do not scale the cooling time profiles since in the regime where 2 keV X-ray emission is dominated by line emission which is a function of temperature, which makes scaling by a single temperature unrealistic. The scaled profiles are shown in Figs 4-8.
The scaled temperature, density and entropy profiles are then fitted with power laws using an orthogonal regression algorithm as implemented in the slopes package (Akritas & Bershady, 1996). The results of the fitting are shown in Table 3.


| Quantity | Index | Normalisation |
|---|---|---|
| Temperature (keV) | 0.260.05 | 0.360.05 |
| Density () | -1.230.06 | -4.10.1 |
| Entropy () | 1.080.05 | 3.050.10 |
NOTES: The sub-samples were fitted in logarithmic space using an orthogonal regression method. Errors are 1 for two interesting parameters.
3 Results
3.1 General observations
Examining the scaled profiles, it appears that groups follow modified self-similar scaling, as discussed by Voit & Ponman (2003). Looking closely at the entropy profiles, it is apparent that there is no isentropic core, even down to small fractions of the virial radius; the entropy profiles follow predictions from models of cooling of gas without any significant heating to raise the central entropy. This is in contrast to work probing hotter galaxy clusters, e.g. that of Voit & Donahue (2005) who find isentropic cores within 10 () in 2.2-5.5 clusters. The profiles presented in this paper probe the hot gas in groups to similar fractions of , but no evidence of isentropic cores is seen. Sanderson et al (in prep) also find a similar result to that presented here for galaxy clusters observed with Chandra .
3.2 Radio loud versus radio quiet sources
The observed profiles are of a mixture of groups with and without current radio activity in the BGG. If radio outbursts are injecting energy into the IGM, then we might expect these outbursts to have an effect on the gas properties of the IGM. In order to investigate this, we divide our sample into two, based on the 1.4 GHz radio luminosity () of the central AGN (given in Table 2). We split our sample at three different radio luminosities, 21, 21.5, and 22, in order to establish if there are any differences as radio power increases. The scaled density, temperature, and entropy profiles for each sample are then fitted with power laws as described in Section 2.3.
| Sub-sample | Temperature | Density | Entropy | |||
|---|---|---|---|---|---|---|
| gradient | intercept | gradient | intercept | gradient | intercept | |
| 0.220.07 | 0.30.1 | -1.20.1 | -4.10.1 | 1.10.1 | 3.00.2 | |
| 0.280.03 | 0.380.05 | -1.230.07 | -4.10.1 | 1.090.07 | 3.10.1 | |
| 0.240.04 | 0.380.06 | -1.160.07 | -3.90.1 | 1.000.08 | 2.90.2 | |
| 0.300.01 | 0.420.02 | -1.080.09 | -3.70.2 | 1.040.05 | 3.020.09 | |
| 0.230.04 | 0.330.07 | -1.170.07 | -3.90.1 | 1.010.08 | 2.90.1 | |
| 0.340.04 | 0.450.06 | -1.30.1 | -4.20.2 | 1.210.09 | 3.20.1 | |
NOTES: The sub-samples were fitted in logarithmic space using an orthogonal regression method. Errors are 1 for two interesting parameters.
Fitting the subsamples, we find that whilst there are some differences between the gradients of the scaled temperature and entropy profiles, the differences are slight, approximately 1-2. Whilst this could indicate a possible difference between the temperature and entropy profiles of radio loud and radio quiet groups, we cannot rule out that it is due to statistical scatter. To test this further, the profiles were co-added and overplotted to see if the averaged profiles showed any significant differences. The averaged profiles are shown in Fig 9 for the 21.5 cut, and the results of the fits for all three cuts are shown in Table 4. It can be seen that our data show that there is approximately a difference between the temperature gradients of the radio loud sample compared to the radio quiet sample (a gradient of 0.310.01 for the co-added radio loud sample compared to 0.240.04 for the co-added radio quiet sample). The apparent jump in temperature seen at 0.004 in the radio quiet sample does not seem to be a feature associated with all radio-quiet groups, but rather primarily the result of one anomalous system, namely NGC 3607. No significant difference in gradients is seen between the co-added scaled radio loud and radio quiet entropy profiles (gradients of 1.040.05 for the radio loud sample compared to 1.000.08 for the radio quiet sample). Further, the radio quiet and radio loud density profiles show little difference in gradient ( for the radio quiet compared to for the radio loud samples).


3.3 Black hole mass and heating
As only a small difference is seen between radio quiet and radio loud systems, it could be that the effect of an AGN is cumulative, building up over repeated duty cycles. If this is so, then comparing profiles of groups with more massive central black holes with those groups with smaller black holes could provide some insight, since a larger black hole should theoretically have had more accretion cycles than a smaller one, and thus, more cycles of radio activity that should have injected more energy into the group.
The relationship between black hole mass and galactic bulge mass has been investigated by many authors (for example Marconi & Hunt 2003), and whilst such a relationship does exist, it contains significant amounts of scatter, thus we must exercise caution in interpreting correlations that make use of it.
We obtain K-band luminosities () for the BGGs in our sample from 2MASS (see also Table 2), and using as a proxy for black hole mass, we divide our sample into two based on the of the BGG, and create subsamples for and . We co-add the scaled temperature, density, and entropy profiles for the subsamples, and fit them as in Section 3.2. The results of fitting the scaled profiles of the two subsamples are shown in Table 5, and the co-added profiles are presented in Fig 10.
From the plots it can be seen that there is a difference in the scaled temperature profiles in that groups which host larger BGGs (hence those BGGs which should have more massive black holes and have undergone more cycles of accretion) have a lower scaled temperature within 0.04 than groups with smaller BGGs. This could arise from both subsamples having the same central temperature but with the bright subsample having an higher overall group temperature. Fitting the binned profiles, we find that the temperature gradient for the sample containing groups with larger BGGs is steeper than the sample of those groups with smaller BGGS (0.280.03 compared with 0.220.02). From Table 5 it can be seem that there is a small (approximately 1.5) difference between the entropy profiles of the two subsamples; the fits to the binned entropy profiles show approximately a 1 difference between the slopes of the entropy profiles (1.040.07 for the sample with and 0.960.08 for the sample with ). This could be a result of a simple correlation between the X-ray scaled gradients of the hot gas and the BGG mass, since larger BGGs would have steeper underlying potential wells which would lead to steeper temperature gradients if the X-ray gas is a tracer of the dark matter. Further, we cannot rule out that any correlation between our scaled temperature, density and entropy profiles may be a result of the size of the host galaxy rather than black hole mass.
| Sub-sample | Temperature | Density | Entropy | |||
|---|---|---|---|---|---|---|
| gradient | intercept | gradient | intercept | gradient | intercept | |
| 0.280.03 | 0.430.07 | -1.300.07 | -4.10.1 | 1.040.07 | 3.10.1 | |
| 0.220.02 | 0.360.06 | -1.300.08 | -4.10.1 | 0.960.08 | 3.10.1 | |
NOTES: The sub-samples were fitted in logarithmic space using an orthogonal regression method. Errors are 1 for two interesting parameters.


3.4 Using an alternative scaling
In Sections 3.2 and 3.3, the gas profiles have been scaled by an average temperature obtained from the ROSAT data. As we expect the Chandra temperature profiles to agree with the ROSAT profiles at large distances from the centre of the group, scaling the Chandra profiles using the ROSAT temperature almost guarantees convergence of scaled profiles outside the cores of groups. An independent temperature scaling would be desirable, to allow an absolute normalisation of profiles and avoid introducing an artificial convergence. To this end, we investigate the use of the velocity dispersion of the galaxy group, as a proxy of the virial temperature . Since , scaling the entropy profiles by should be equivalent to scaling by .
We can also improve on the use of as a proxy for the mass of the central black hole. The -black hole mass () relation shows substantial scatter, whilst the relation, where is the velocity dispersion of the BGG, is tighter (Ferrarese & Merritt 2000 and Gebhardt et al. 2000). However, recent work (Lauer et al., 2006) suggests that for BGGs, the relation may not be as well constrained compared to the relation, where is the V-band magnitude of the BGG. This is however a much debated issue, and it has been suggested that the discrepancy between as predicted by the two different methods arises due to being overestimated in BGGs (Batcheldor et al., 2006). They argue that in fact when black hole masses obtained using a relation are compared to those using a relation, i.e. a near-infra-red rather than blue magnitude relation, (e.g. Marconi & Hunt, 2003), there is no discrepancy, and that the discrepancy arises due to the unusual colour profiles of BGGs compared to E and S0 galaxies. With this in mind, and with no apparant resolution, we opt to use the tighter relation, and scale the entropy profiles by radially, and by vertically, and split the sample into two in two different ways; in Fig 11a, as in Section 3.2 at and in Fig 11b at . Values for are collated from Hyperleda111http://leda.univ-lyonl.fr, and shown in Table 2. The subsamples for both the and splits are fitted as before. We find that the entropy profiles in the split show no significant differences between the profiles, whilst the split shows that systems with higher values of have steeper entropy profiles than those with lower values (gradients of 1.220.01 compared to 0.780.05), suggesting that the effect seen in Section 3.3 is real.


3.5 Effects of AGN activity on individual systems
As has been discussed in Sections 3.2 and 3.3, when comparing the sample as a whole, there appears to be some marginal difference between the gas properties of the groups with radio loud BGGs and those with radio quiet BGGs. The fact that the difference is marginal could indicate that a real effect is being diluted by averaging together groups with different radio properties. To test this we correlate the logarithmic gradients of scaled temperature, entropy and density profiles of individual groups with of the BGG. The Pearson correlation coefficients are shown in Table 6, and plots of the various quantities that have been correlated are shown in Fig. 12. We find significant correlations between and both the temperature and entropy gradients.
Since our sample contains three systems with extensive jet-fed radio lobes, it is interesting to examine whether these systems might be entirely responsible for the rather weak correlations we see. These three systems (NGC 383, NGC 741, NGC 4261) have jets which transport the AGN energy out to large radii where the gas density may be too low to allow the energy to be radiated in less than a Hubble time. This could lead to steepening of temperature and entropy profiles in these systems. We find that if the three groups with large radio galaxies are excluded from the sample the correlations are no longer significant. Hence our data do not require any effect on the gas from AGN beyond that arising in the three large jet systems.
We further correlate of the BGG, with the global X-ray temperature, , as measured by ROSAT , and with , the K-band magnitude of the BGG (Table 7 and Fig. 13). We also find that correlates with . This correlation suggests that either the radio source does heat the IGM, or alternatively, that a hotter group, with a strong temperature and entropy gradient is more conducive to triggering an AGN outflow of the scale of the largest radio galaxies, than a cooler group. There appears to be no significant correlation between and or and , indicating that the effect is not due to larger galaxies hosting larger radio outbursts and being found in hotter groups. This suggests that the difference in temperature profiles found in Section 3.3 may arise from steeper potential wells in the systems with larger BGGs.
| Quantity | R | Significant? |
|---|---|---|
| 0.50 | Y1 | |
| 0.56 | Y1 | |
| -0.23 | N |
NOTES: 1The correlation disappears when the sources with powerful radio jets are removed from the sample (see text).


| Quantity | |||
|---|---|---|---|
| - | 0.511 | -0.14 | |
| - | - | 0.46 |


3.6 The relation
Croston et al. (2005) find that groups which host radio galaxies appear to fall below the relation for groups (c.f. Osmond & Ponman (2004)), which they interpret as evidence for AGN heating of galaxy groups. We use the temperatures and luminosities extracted in Section 2.3.1 to produce an relation for the inner regions of groups as sampled by the Chandra data; the corresponding relation is shown in Fig. 3a.
From Fig. 3, there does appear to be some difference in the distribution of radio loud and radio quiet points around the mean relation, and to test this, we measure the perpendicular distance for each group from the mean fit, and as above, compare the distribution of distances for the radio loud and radio quiet systems. A K-S test indicates that there is a 20% chance that the observed scatter around the mean relation would arise by chance if the radio loud and radio quiet sub-samples came from the same population (=0.46, =0.20), implying that the effect is marginally significant. However, we are dealing with only 19 systems, and so both effects need to be explored with a larger sample.
If the difference in distributions around the mean relation is real, then fixing the gradient of the relation to that obtained from the fit to the entire sample allows an estimate of the temperature offset between the radio loud sample and the radio quiet sample to be determined. We find that the temperature offset keV. If this temperature offset is entirely due to the impact of AGN heating within , then an estimate of the energy required to produce this offset can be obtained.
The energy input required to produce a temperature change of is given by:
| (7) |
where is the total number of particles within and is the Boltzmann constant. Assuming that the average radio quiet profile is roughly equivalent to an unheated group, we use the density profile shown in Fig 9b, and a keV to estimate for a 1 keV system. We find that erg. Assuming an AGN lifetime of yrs, this gives an energy injection rate of . We comment below on the plausibility of this injection rate.
We further compare the marginal effect found in the Chandra data with the result of Croston et al. (2005), to ascertain whether any AGN heating is taking place within the core, compared to outside the core. To do this, we examine the mean residuals () of the radio loud and radio quiet subsamples compared to the fit to the radio quiet sample. For the ROSAT sample of Croston et al. (2005), we use the best fitting least squares fit to their c2 radio quiet sample in order to have a reasonable comparison of radio power with our cut. We find that in the ROSAT data, the mean residual for the radio quiet group is =0.060.1 keV, compared to the value for the radio loud sample, =1.60.5 keV. The corresponding quantities () for the Chandra data are =0.070.1 keV and =0.20.1 keV. The mean residual is much larger for the radio loud sample in the ROSAT data than in the Chandra data, implying that more significant AGN heating may be taking place outside the region being probed here ().
4 Discussion
To summarise the key results above, we find modest differences between the gas properties of the cores of radio loud groups compared to radio quiet groups; radio loud groups appear to have slightly steeper temperature profiles, and there are marginally significant correlations between the temperature and entropy gradient of groups and the radio power of their BGGs, though this may arise from the three strong jet sources in our sample. We also find that when the sample is split according by a proxy of the black hole mass (either or ), steeper temperature and entropy gradients are found for those groups whose central galaxies have large values of or , compared to those groups where or are lower. Considering the effect of active radio galaxies on the scaling relations, we find evidence for a small offset in the relation between radio loud and radio quiet groups, but this is much smaller than the offset seen on larger spatial scales by Croston et al. (2005).
In light of these results, we now discuss the three possible explanations for any observed correlations that were highlighted in Section 1.
-
•
The radio source modifies the X-ray properties through heating or displacement of the gas. From the images presented in Section 2.2 and the work of other authors, it is apparent that the radio source can displace gas, creating cavities in the X-ray emission. The entropy profiles when split on radio power imply that no extra energy is being injected into the core by current radio source heating, although systems which exhibit powerful jets may be transporting extra energy to regions outside the core, and causing a steepening of the entropy gradient outside the core. However, splitting the sample using proxies of black hole mass suggests that there may be a cumulative effect of repeated AGN outbursts. It is not clear whether the cumulative effect is from repeated AGN outbursts, or due to energy injection from the stellar content of the galaxy.
-
•
The observed X-ray properties provide suitable conditions for radio source triggering. If this were the case, then it would be expected that the immediate gaseous environments of currently radio active sources would be different from the environments of currently radio quiet sources. It can be seen from Fig 9 that the profiles of radio loud and radio quiet groups are rather similar, and from Figs 4-8 the scatter between individual profiles is larger than any systematic differences seen in the averaged profiles. As any structural differences conducive to the production of a radio source would have to be most significant in the core of the group, since that is where the black hole resides, the similar profiles for the radio loud and radio quiet groups argue against this hypothesis.
-
•
There exists some third parameter that correlates with both radio source activity and position on the relation. From Fig 13b, it could be the case that may play some role, as the mean magnitude for the radio loud sample does seem to be larger than the mean magnitude for the radio quiet sample. This could be a result of a cuspier potential caused by a larger central galaxy.
The evidence suggests that our first and third hypotheses could, together, help explain the correlations found here, whilst the second hypothesis seems unlikely, since any systematic differences between radio loud and radio quiet groups found are small, and can be attributed to either statistical scatter, or to a small number of sources with physically large sizes that transport energy out to larger radii. The fact that there are no strong differences between radio-loud and radio-quiet groups implies that in general radio sources do not inject enough energy into the central regions of their host groups to cause observable heating effects. If there is any heating going on on these scales, it must just be enough to balance cooling.
To investigate whether AGN output is indeed sufficient to balance cooling, we consider the case of NGC 383 (3C 31). This source has been well studied and is one of the few in our sample that has an estimated total jet power. We define the cooling radius as the radius at which the cooling time is equal to the Hubble time, which for NGC 383 is . Within this radius, . The total jet energy flux at 12 is (Laing & Bridle, 2002). Further, in Section 3.6, we calculated that the average temperature offset between the radio loud sample and the radio quiet sample is 0.2 keV. Over years, an energy injection rate of is required to produce the offset in the NGC 383 group. This is about an order of magnitude less than the maximum AGN energy input rate, so that even a less luminous AGN, where the AGN energy flux would not be as high, could provide sufficient energy to both counteract radiative cooling, and raise the temperature of the group. This agrees well with the conclusions of Hardcastle et al. (2002).
Further, the large scale radio morphology of NGC 383 and the fact that the bolometric luminosity of the cool core is much less than the radio source power implies that an outburst such as that in NGC 383 could transport much of the energy contained in the radio source out to larger radii, where it could also affect the hot gas, explaining the Croston et al. (2005) results. However, the radio morphology of NGC 383 is very different to most of the other radio outbursts in this sample, and its long jets and plumes may be transporting energy to regions outside the core of the group without affecting the innermost regions. Radio outbursts on smaller scales may affect the IGM closer to the BGG.
5 Conclusions
We have presented azimuthally averaged profiles of the properties of the central hot gas, and an relation within for 15 galaxy groups with varying degrees of AGN activity.
The slightly steeper temperature profiles seen in radio loud groups could be related to the size of the BGG – a larger BGG would have a steeper potential well associated with it, and hence a steeper gradient – or it could be that systems with radio-loud AGN have cooled more than those without radio-loud AGN, and it is this cooling gas that fuels the radio source. However, our sample size is small, and the properties of the gas and how they correlate with the AGN activity need to be investigated on a wider scale using a larger sample which probes a wider range of temperatures and scales of AGN activity. Alternatively, the effect could arise from the contribution of a few radio sources with large physical sizes. These sources may have little effect on the gas close to the core of the group, depositing their energy at larger radii, at the outside edge of the regions probed here, causing the gas profiles of their host groups to appear to be marginally steeper over our radial range.
The steepening of the entropy gradients in systems with larger values of and (indicating larger black holes) compared to those with smaller values of and could be evidence for repeated cycles of AGN activity having an impact on the hot gas in groups. However, it is unclear whether the effect has to have occurred via AGN heating, rather than via other forms of energy injection from the galaxy. As both AGN and galaxy growth are linked, disentangling one effect from the other may be difficult, particularly as AGN life-cycles are also poorly understood. Work needs to be done here in both comparing the gas properties of groups at different stages of their evolution, and on the life-cycles of AGN hosted by BGGs.
The relations show that any effect that AGN are having on the gas primarily occurs at larger radii; it could be that within the region probed by Chandra , AGN only act to counteract radiative cooling. The difference between the radio loud and radio quiet subsamples is smaller than the difference found by Croston et al. (2005), suggesting that ongoing large scale outbursts such as those in NGC 383 and NGC 4261 could be transferring energy out to large radii, and may have a stronger effect outside the core, whilst the effects of repeated outbursts are more likely to show up in the core. However, more X-ray work is needed here to further probe and constrain the gas properties at larger radii.
We conclude that it appears that radio loud AGN do not irreversibly raise the entropy in the core of their host galaxy groups. Rather, it seems that the feedback mechanisms at work result in typical central AGN generating just sufficient energy to balance cooling in the core of the group. Repeated outbursts may have some longer lasting effect on the gas, which may contribute to similarity breaking, although detailed studies extending to larger radii are required to investigate this. This cumulative effect may take place primarily via rather rare large outbursts, which dump energy outside the cooling radius via radio jets.
Acknowledgements
The authors would like to thank Irini Sakelliou for her invaluable help during the early stages of this study. MJH thanks the Royal Society for a research fellowship. We thank the anonymous referee for their useful comments in the preparation of this paper. This research has made use of the NASA/IPAC Extragalactic Database (NED) which is operated by the Jet Propulsion Laboratory, California Institute of Technology, under contract with the National Aeronautics and Space Administration.
References
- Akritas & Bershady (1996) Akritas M. G., Bershady M. A., 1996, ApJ, 470, 706
- Allen et al. (2006) Allen S. W., Dunn R. J. H., Fabian A. C., Taylor G. B., Reynolds C. S., 2006, ArXiv Astrophysics e-prints
- Balogh et al. (1999) Balogh M. L., Babul A., Patton D. R., 1999, MNRAS, 307, 463
- Batcheldor et al. (2006) Batcheldor D., Marconi A., Merritt D., Axon D. J., 2006, ArXiv Astrophysics e-prints
- Begelman (2001) Begelman M. C., 2001, in Hibbard J. E., Rupen M., van Gorkom J. H., eds, ASP Conf. Ser. 240: Gas and Galaxy Evolution Impact of Active Galactic Nuclei on the Surrounding Medium. pp 363–+
- Bernardi et al. (2002) Bernardi M., Alonso M. V., da Costa L. N., Willmer C. N. A., Wegner G., Pellegrini P. S., Rité C., Maia M. A. G., 2002, AJ, 123, 2990
- Beuing et al. (2002) Beuing J., Bender R., Mendes de Oliveira C., Thomas D., Maraston C., 2002, A&A, 395, 431
- Binney & Tabor (1995) Binney J., Tabor G., 1995, MNRAS, 276, 663
- Bîrzan et al. (2004) Bîrzan L., Rafferty D. A., McNamara B. R., Wise M. W., Nulsen P. E. J., 2004, ApJ, 607, 800
- Bonfanti et al. (1995) Bonfanti P., Rampazzo R., Combes F., Prugniel P., Sulentic J. W., 1995, A&A, 297, 28
- Brüggen & Kaiser (2001) Brüggen M., Kaiser C. R., 2001, MNRAS, 325, 676
- Carollo et al. (1993) Carollo C. M., Danziger I. J., Buson L., 1993, MNRAS, 265, 553
- Condon et al. (1998) Condon J. J., Cotton W. D., Greisen E. W., Yin Q. F., Perley R. A., Taylor G. B., Broderick J. J., 1998, AJ, 115, 1693
- Croston et al. (2005) Croston J. H., Hardcastle M. J., Birkinshaw M., 2005, MNRAS, 357, 279
- Fabian et al. (2001) Fabian A. C., Mushotzky R. F., Nulsen P. E. J., Peterson J. R., 2001, MNRAS, 321, L20
- Fabian et al. (2000) Fabian A. C., Sanders J. S., Ettori S., Taylor G. B., Allen S. W., Crawford C. S., Iwasawa K., Johnstone R. M., Ogle P. M., 2000, MNRAS, 318, L65
- Ferrarese & Merritt (2000) Ferrarese L., Merritt D., 2000, ApJL, 539, L9
- Fisher et al. (1995) Fisher D., Illingworth G., Franx M., 1995, ApJ, 438, 539
- Gebhardt et al. (2000) Gebhardt K., Bender R., Bower G., Dressler A., Faber S. M., Filippenko A. V., Green R., Grillmair C., Ho L. C., Kormendy J., Lauer T. R., Magorrian J., Pinkney J., Richstone D., Tremaine S., 2000, ApJL, 539, L13
- Hardcastle et al. (2002) Hardcastle M. J., Worrall D. M., Birkinshaw M., Laing R. A., Bridle A. H., 2002, MNRAS, 334, 182
- Heinz et al. (2002) Heinz S., Choi Y., Reynolds C. S., Begelman M. C., 2002, ApJL, 569, L79
- Heinz et al. (1998) Heinz S., Reynolds C. S., Begelman M. C., 1998, ApJ, 501, 126
- Jetha et al. (2005) Jetha N. N., Sakelliou I., Hardcastle M. J., Ponman T. J., Stevens I. R., 2005, MNRAS, 358, 1394
- Kaiser (1991) Kaiser N., 1991, ApJ, 383, 104
- Kraft et al. (2003) Kraft R. P., Vázquez S. E., Forman W. R., Jones C., Murray S. S., Hardcastle M. J., Worrall D. M., Churazov E., 2003, ApJ, 592, 129
- Laing & Bridle (2002) Laing R. A., Bridle A. H., 2002, MNRAS, 336, 1161
- Lauer et al. (2006) Lauer T. R., Faber S. M., Richstone D., Gebhardt K., Tremaine S., Postman M., Dressler A., Aller M. C., Filippenko A. V., Green R., Ho L. C., Kormendy J., Magorrian J., Pinkney J., 2006, ArXiv Astrophysics e-prints
- Marconi & Hunt (2003) Marconi A., Hunt L. K., 2003, ApJL, 589, L21
- Müller et al. (1999) Müller K. R., Wegner G., Raychaudhury S., Freudling W., 1999, A&AS, 140, 327
- Nath & Roychowdhury (2002) Nath B. B., Roychowdhury S., 2002, MNRAS, 333, 145
- Nulsen et al. (2005) Nulsen P. E. J., McNamara B. R., Wise M. W., David L. P., 2005, ApJ, 628, 629
- Nusser et al. (2006) Nusser A., Silk J., Babul A., 2006, ArXiv Astrophysics e-prints
- Osmond & Ponman (2004) Osmond J. F., Ponman T. J., 2004, MNRAS
- Peterson et al. (2001) Peterson J. R., Paerels F. B. S., Kaastra J. S., Arnaud M., Reiprich T. H., Fabian A. C., Mushotzky R. F., Jernigan J. G., Sakelliou I., 2001, A&A, 365, L104
- Pointecouteau et al. (2005) Pointecouteau E., Arnaud M., Pratt G. W., 2005, Advances in Space Research, 36, 659
- Ponman et al. (1999) Ponman T. J., Cannon D. B., Navarro J. F., 1999, Nature, 397, 135
- Ponman et al. (2003) Ponman T. J., Sanderson A. J. R., Finoguenov A., 2003, MNRAS, 343, 331
- Popesso et al. (2005) Popesso P., Biviano A., Böhringer H., Romaniello M., Voges W., 2005, A&A, 433, 431
- Proctor & Sansom (2002) Proctor R. N., Sansom A. E., 2002, MNRAS, 333, 517
- Rampazzo et al. (1998) Rampazzo R., Covino S., Trinchieri G., Reduzzi L., 1998, VizieR Online Data Catalog, 333, 423
- Reynolds et al. (2001) Reynolds C. S., Heinz S., Begelman M. C., 2001, ApJL, 549, L179
- Sanderson et al. (2003) Sanderson A. J. R., Ponman T. J., Finoguenov A., Lloyd-Davies E. J., Markevitch M., 2003, MNRAS, 340, 989
- Smith et al. (2000) Smith R. J., Lucey J. R., Hudson M. J., Schlegel D. J., Davies R. L., 2000, MNRAS, 313, 469
- Thomas et al. (2001) Thomas P. A., Muanwong O., Pearce F. R., Couchman H. M. P., Edge A. C., Jenkins A., Onuora L., 2001, MNRAS, 324, 450
- Valageas & Silk (1999) Valageas P., Silk J., 1999, A&A, 347, 1
- Vikhlinin et al. (2006) Vikhlinin A., Kravtsov A., Forman W., Jones C., Markevitch M., Murray S. S., Van Speybroeck L., 2006, ApJ, 640, 691
- Voit & Donahue (2005) Voit G. M., Donahue M., 2005, ApJ, 634, 955
- Voit & Ponman (2003) Voit G. M., Ponman T. J., 2003, ApJL, 594, L75
- Wegner et al. (1999) Wegner G., Colless M., Saglia R. P., McMahan R. K., Davies R. L., Burstein D., Baggley G., 1999, MNRAS, 305, 259
- Willis et al. (2005) Willis J. P., Pacaud F., Valtchanov I., Pierre M., Ponman T., Read A., Andreon S., Altieri B., Quintana H., Dos Santos S., Birkinshaw M., Bremer M., Duc P.-A., Galaz G., Gosset E., Jones L., Surdej J., 2005, MNRAS, 363, 675