The XMM–Newton wide–field survey in the COSMOS field: I. Survey description
Abstract
We present the first set of XMM–Newton EPIC observations in the 2 square degree COSMOS field. The strength of the COSMOS project is the unprecedented combination of a large solid angle and sensitivity over the whole multiwavelength spectrum. The XMM–Newton observations are very efficient in localizing and identifying active galactic nuclei (AGN) and clusters as well as groups of galaxies. One of the primary goals of the XMM–Newton Cosmos survey is to study the co–evolution of active galactic nuclei as a function of their environment in the Cosmic web. Here we present the log of observations, images and a summary of first research highlights for the first pass of 25 XMM–Newton pointings across the field. In the existing dataset we have detected 1416 new X–ray sources in the 0.5–2, 2–4.5 and 4.5–10 keV bands to an equivalent 0.5–2 keV flux limit of erg cm-2 s-1. The number of sources is expected to grow to almost 2000 in the final coverage of the survey. From an X–ray color color analysis we identify a population of heavily obscured, partially leaky or reflecting absorbers, most of which are likely to be nearby, Compton-thick AGN.
Subject headings:
cosmology: observations — large-scale structure of universe — dark matter — galaxies: formation — galaxies: evolution — X-rays: galaxies1. Introduction
COSMOS is a global multiwavelength collaboration built around an HST Treasury Program providing deep images with the Advanced Camera for Surveys (ACS) that cover an unprecedentedly large contiguous 2 deg2 field [Scoville et al., 2007]. One of the primary goals of COSMOS is to study the co–evolution of galaxies and their central black holes out to high redshifts, placing them in the context of the large scale structure in which they reside and with high resolution morphological information. The XMM–Newton observations are a crucial element of the COSMOS survey, because of the superb efficiency of X–ray observations in localizing and identifying active galactic nuclei (AGN) and distant clusters of galaxies.
It has recently become clear that X–ray selected AGN are highly biased tracers of the dark matter distribution, as shown by the significant degree of angular auto–correlation and field to field variance in the source counts [Cappi et al., 2001, Cowie et al., 2002, Yang et al., 2003, Almaini et al., 2003, D’Elia, Fiore & Elvis, 2004, Cappelluti et al., 2005] as well as by the presence of spikes in the AGN redshift distribution, mapping onto the large–scale structure from optical data [Gilli et al., 2003, Barger et al., 2003]. The evolution of the clustering with redshift and the comparison of the AGN clustering signal with that of other galaxy populations gives important information on the biasing of AGN and thus on the environment and type of dark matter halos in which activity is triggered. La Franca, Andreani & Cristiani [1998] reported the tentative detection of an increase of clustering of optically selected AGN with redshift. The 2dF AGN survey found a factor of 2.7 increase of the clustering amplitude from to [Croom et al., 2005], based on a sample of more than 20000 objects. The spatial clustering of X–ray selected AGN has recently been measured in different fields [Mullis et al., 2004b, Gilli et al., 2005, Yang et al., 2006], but the data so far do not allow to obtain information on clustering evolution with redshift.
For a given survey area, the signal–to–noise ratio of the clustering signal scales with the surface density (for 2D correlation) or the volume density (for 3D correlation) of the objects in the sample. AGN are very rare objects, however, deep X–ray surveys are known to yield the largest surface density of AGN in any waveband (e.g. 1000 deg-2 at the faintest limiting flux aimed for in the XMM–Newton COSMOS survey). Moreover, because X–rays can both penetrate obscuring dust and are not sensitive to dilution by starlight in the host galaxy, the X–ray selection of AGN is not affected by some of the biases of the optical selection [see e.g. Brandt & Hasinger, 2005]. The above mentioned optical QSO correlation functions have been determined from surface densities of less than 30 AGN deg-2. The most recent deep optical surveys reach surface densities of 250 deg-2 in the case of COMBO–17 (Classifying Objects by Medium-Band Observations – a spectrophotometric 17–filter survey) [Wolf et al., 2003], and 470 deg-2 [Gavignaud et al., 2006] in the case of the Virmos–VLT Deep Survey (VVDS). The COMBO–17 survey contains 192 QSOs selected from intermediate–band photometric redshifts with z and over 0.78 deg2, while the VVDS contains 74 spectroscopically selected QSOs in a solid angle of 0.6 deg2 with . The large factor between the X–ray and the optical surface densities is crucial to map structures to a smaller scale than that (1 Mpc) mapped with the current optical samples. Therefore, the most sensitive spatial clustering analysis of AGN, especially at high redshift, will be obtained by an X–ray survey, which is both wide and deep simultaneously. In addition, an X–ray survey including also the hard (2–10 keV) band will give clustering information separately for the unabsorbed (type–1) and the absorbed (type–2) AGN population and can thus directly test whether the obscured and unobscured AGN originate from the same parent population of galaxies, a crucial ingredient in AGN unification scenarios. To study the 3D spatial correlation as a function of redshift and source class, a few hundred spectroscopically identified AGN are required per class and redshift shell in a contiguous sky area. This is the main science goal of the XMM–Newton COSMOS Survey.
There is very good evidence that AGN and galaxies co–evolve: the peaks of AGN activity and star formation occur in the same redshift range (z = 1–2.5) and there is a similar dramatic decline towards low redshift. Black hole mass and galactic bulge properties in the local universe are strongly correlated [Kormendy & Gebhardt, 2001, Merrit & Ferrarese, 2001]. Therefore, the evolution of high–redshift AGN can be utilized to study the formation and evolution of galaxies. The observed redshift distribution of faint X–ray sources [Cowie et al., 2003, Hasinger et al., 2003, Fiore et al., 2003, Ueda et al., 2003] both in the soft and the hard bands, peaks at z and is dominated by relatively low luminosity objects (log = 42–44 erg s-1). Recently, the evolution of the space density of X–ray selected AGN has been derived [Hasinger et al., 2005] based on a sample of 1000 type–1 AGN selected in the 0.5–2 keV band from ROSAT, XMM–Newton and Chandra deep surveys with a very high completeness of optical redshift identification (). A strong dependence of the AGN space density evolution on X–ray luminosity has been found. The comoving space density of high luminosity (log erg s-1) AGN rises rapidly by more than a factor of 100 from z=0 to z2, while the space density of low luminosity AGN evolves significantly less rapidly in the same redshift interval. Moreover, there is a clear increase of the peak redshift with increasing X–ray luminosity, both in the 0.5–2 keV and the 2–10 keV band [Hasinger et al., 2003, Fiore et al., 2003, Ueda et al., 2003, Hasinger et al., 2005]. Also, for the first time there is firm evidence of a decline in the space density of lower–luminosity AGN towards higher redshift. This behaviour was not recognized in previous shallower surveys, e.g. from ROSAT [Miyaji, Hasinger & Schmidt, 2000], and was not included in the XRB synthesis models based on these [e.g. Gilli, Salvati & Hasinger, 2001].
These new results paint a dramatically different evolutionary picture for low–luminosity AGN compared to the high–luminosity QSOs. While the rare, high–luminosity objects can form and feed very efficiently rather early in the universe, with their space density declining more than two orders of magnitude at redshifts below z=2, the bulk of the AGN has to wait much longer to grow or to be activated, with a decline of space density by less than a factor of 10 below a redshift of one. The late evolution of the low–luminosity Seyfert population is very similar to that which is required to fit the Mid–infrared source counts and background [Franceschini, Braito & Fadda, 2002] and also the bulk of the star formation in the Universe [Madau, Pozzetti & Dickinson, 1998], while the rapid evolution of powerful QSOs traces more closely the history of formation of massive spheroids [Franceschini et al., 1999]. This kind of anti–hierarchical Black Hole growth scenario is not predicted by most semi–analytic galaxy evolution models based on Cold Dark Matter structure formation [e.g. Kauffmann & Haehnelt, 2000, Wyithe & Loeb, 2003, Croton et al., 2005]. It could indicate two modes of accretion and black hole growth with radically different accretion efficiency [see e.g. the models of di Matteo et al., 2003, Merloni, 2004, Menci et al., 2004].
The strong peak at z=0.7 has been somewhat contested by Treister et al. [2004], who noted that the decline at high redshift is affected by a bias against the identification of distant obscured AGN, while the obscured to unobscured AGN ratio at high-z was still consistent with the value of 4:1 observed locally. Indeed 40% of the local Seyfert galaxies are Compton thick [Risaliti, Maiolino & Salvati, 1999]. They are missing from all current X–ray surveys, but should show up in mid-infrared surveys due to their dust emission. On the other hand, the number of highly obscured objects missing in the current deep X–ray samples is limited by the integrated constraints on the number counts, the hard X–ray and soft gamma–ray background [Ueda et al., 2003] and the mass function of supermassive black holes in local galaxies [Marconi et al., 2004]. Including the observed decrease of obscuration with increasing X–ray luminosity [Ueda et al., 2003, Hasinger, 2004], there is an excellent consistency with all observed constraints [Ueda et al., 2003, Treister & Urry, 2005, Gilli, Comastri & Hasinger, 2006].
While the evolution of AGN of all luminosity classes at has now been firmly established from the rich X–ray samples discussed above, little is known about the growth phase of high–mass black holes in the redshift range 3–6. Unlike in the optical and radio bands, where a clear decline of the space density is observed in the redshift range 3–6 for the most luminous QSOs [Fan et al., 2001, Wall et al., 2005], no decrease in the space density of luminous X–ray QSOs is apparent up to z=4 [Hasinger et al., 2005]. Above that redshift, some evidence of a decline has been seen by Silverman et al. [2005] and Hasinger et al. [2005], but the number of objects available so far is way too small to obtain accurate quantitative information about the AGN growth phase, in comparison to the optical QSO surveys. The total sample of AGN more luminous than logLX=44 at z collected from all ROSAT, Chandra and XMM–Newton surveys is just [Silverman et al., 2005, Steffen et al., 2004, Hasinger et al., 2005], while in the COSMOS survey, once completed, we expect of order 100 such objects, based on an extrapolation of the most recent type–1 AGN X–ray luminosity function [Hasinger et al., 2005]. If large enough samples of AGN (several 100s per unit redshift) can be spectroscopically identified and their optical/NIR morphology can be studied with high angular resolution, then the well known correlations between observable quantities of the host galaxies and nuclei, such as surface brightness profile, effective radius and the stellar component velocity dispersion, which in the local Universe is tightly correlated with the black hole mass [Kormendy & Gebhardt, 2001, Merrit & Ferrarese, 2001], open the possibility to extend these studies to high redshift and truly determine the history of accretion in conjunction with galaxy formation.
Clusters and groups of galaxies represent the second most abundant class of objects identified in deep X-ray surveys. Due to their extended X-ray emission they can be easily discriminated from point sources. At redshifts z1 their rather low X–ray luminosities and temperatures correspond to groups and low–mass clusters. A handful of clusters with redshifts z1 has been discovered serendipitously in deep ROSAT [e.g. Rosati, P. et al., 2002] and recently also XMM–Newton observations. The highest redshift is at z1.4 [Mullis et al., 2005]. At high luminosities the X–ray cluster population shows mild cosmological evolution, consistent with the growth of structure expected in a standard CDM cosmology [Mullis et al., 2004a]. At fainter X–ray fluxes considerable confusion can exist between the diffuse cluster emission and faint AGN, either in the background or even as cluster members [e.g. Martini et al., 2006]. Because of the strong cosmological AGN evolution, the likelihood of AGN contamination substantially increases with redshift. High angular resolution observations of some of the high redshift clusters and a careful data analysis are thus important to understand possible biases introduced by AGN contamination.
Another population of objects discovered in deep X-ray fields are stars showing coronal emission, in particular G, K, and M-type stars with magnetic flaring activity. While at bright fluxes (e.g. in the ROSAT All-Sky Survey) coronal stars are quite abundant, the fraction of stars in the deep, high Galactic latitude fields is only a few percent, mainly because the observations are sensitive enough to reach beyond the typical stellar disk populations. Nevertheless, the statistics of stars in high latitude fields can e.g. constrain the decay of stellar magnetic activity on timescales of several Gyr [Feigelson et al., 2004].
In this paper (paper I) we give an overview of the XMM–Newton survey in the COSMOS field (XMM–Cosmos), which is the basis for several accompanying publications in the same journal issue, dealing with the ”X–ray data and the logN–logS” [paper II, Cappelluti et al., 2007], the ”Optical identification and multiwavelength properties of a large sample of X–ray selected sources” [paper III, Brusa et al., 2007], the ”X-ray spectral properties of Active Galactic Nuclei” [paper IV, Mainieri et al., 2007], the ”Angular Clustering of the X-ray Point Sources” [paper V, Miyaji et al., 2007], and ”Statistical properties of clusters of galaxies” [paper VI, Finoguenov et al., 2007]. Significant contributions from the XMM–Cosmos survey are also contained in the papers on ”A wide angle tail galaxy in the COSMOS field: evidence for cluster formation” [Smolcic et al., 2007] and on ”A large-scale structure at z=0.73 and the relation of galaxy morphologies to the local environment” [Guzzo et al., 2007].
| Target | aaEntries marked with an asterisk are part of the 12–field sample, for which optical identifications are presented in Brusa et al. [2007]. | Obs. DatebbObservation date yyyy-mm-ddThh:mm:ss | R.A. | Dec. | Exp. | GTIccNet exposure time in PN–CCD good time intervals | BKG rateddAverage value of quiescent particle background in the 0.3–10 keV energy band after the cleaning |
|---|---|---|---|---|---|---|---|
| [hh mm ss] | [dd mm ss] | [ks] | [ks] | [cts/100s] | |||
| Field 1 | 2004-12-11T13:45:22 | 10 02 25 | 02 44 15 | 31.0 | 25.8 | 49.7 | |
| Field 2 | 2004-12-11T22:58:42 | 10 02 25 | 02 29 16 | 44.0 | 12.3 | 48.7 | |
| Field 3 | 2005-05-14T03:40:20 | 10 02 28 | 02 10 55 | 32.1 | 26.9 | 45.4 | |
| Field 4 | * | 2004-11-21T05:34:24 | 10 02 25 | 01 59 15 | 31.0 | 23.2 | 46.4 |
| Field 5 | * | 2004-11-21T14:47:44 | 10 02 25 | 01 44 15 | 31.0 | 23.4 | 42.3 |
| Field 6 | * | 2004-05-30T01:11:41 | 10 01 25 | 02 40 56 | 32.2 | 19.7 | 36.1 |
| Field 7 | * | 2003-12-06T01:58:02 | 10 01 25 | 02 29 16 | 34.5 | 28.9 | 34.9 |
| Field 8 | * | 2004-11-17T22:11:57 | 10 01 25 | 02 14 16 | 53.0 | 24.5 | 58.4 |
| Field 9 | 2004-11-20T01:08:49 | 10 01 25 | 01 59 15 | 36.2 | 18.6 | 44.4 | |
| Field 10 | * | 2004-11-22T00:01:05 | 10 01 25 | 01 44 15 | 45.5 | 11.5 | 45.0 |
| Field 11 | 2004-12-01T23:46:01 | 10 00 25 | 02 44 15 | 44.1 | 17.5 | 51.7 | |
| Field 12 | * | 2003-12-08T18:41:48 | 10 00 25 | 02 29 16 | 34.9 | 22.7 | 33.3 |
| Field 13 | * | 2003-12-10T11:46:18 | 10 00 25 | 02 14 16 | 31.8 | 22.9 | 34.6 |
| Field 14 | * | 2003-12-10T02:14:39 | 10 00 25 | 01 59 15 | 32.0 | 27.3 | 33.8 |
| Field 15 | * | 2004-11-19T15:55:29 | 10 00 25 | 01 44 15 | 30.1 | 18.3 | 48.2 |
| Field 16 | 2004-12-06T01:17:33 | 09 59 25 | 02 42 36 | 40.1 | 0.0 | 126.8 | |
| Field 17 | 2004-12-11T04:15:21 | 09 59 25 | 02 29 16 | 31.2 | 26.8 | 40.2 | |
| Field 18 | * | 2003-12-12T06:26:01 | 09 59 25 | 02 14 16 | 28.9 | 23.8 | 35.9 |
| Field 19 | 2004-12-13T21:59:19 | 09 59 25 | 01 59 15 | 30.1 | 20.9 | 36.7 | |
| Field 20 | 2005-05-14T13:14:31 | 09 59 25 | 01 40 56 | 32.0 | 6.2 | 15.6 | |
| Field 21 | 2004-12-09T07:38:16 | 09 58 25 | 02 44 15 | 62.6 | 54.0 | 39.4 | |
| Field 22 | * | 2004-11-03T06:24:56 | 09 58 25 | 02 29 16 | 31.0 | 25.3 | 65.5 |
| Field 23 | 2005-05-09T19:23:50 | 09 58 25 | 02 10 57 | 31.0 | 8.1 | 66.3 | |
| Field 24 | 2005-05-10T04:37:10 | 09 58 25 | 01 55 58 | 31.0 | 15.5 | 60.8 | |
| Field 25 | 2005-05-10T14:20:30 | 09 58 25 | 01 40 56 | 32.0 | 0.0 | 350.5 |
2. XMM–Newton Observations
We have surveyed an area of 1.41.4 deg2 within the region of sky bounded by ; , which has also been covered almost completely by the HST ACS [1.67 deg2, see Leauthaud et al., 2007, Scoville et al., 2007]. The observations with XMM–Newton [Jansen et al., 2001] cover a mosaic of 25 overlapping XMM pointings with a grid spacing of 15 arcmin, i.e. about half of the size of the EPIC field of view. The EPIC cameras [Strüder et al., 2001, Turner et al., 2001] were operated in the standard full–frame mode. The thin filter was used for the PN camera and the medium filter for the MOS1 and MOS2 cameras. Table 1 gives a summary of the observations.
The PN and MOS data were preprocessed by the XMM Survey Scientist Consortium [Watson et al., 2001, SSC] using the XMM–Newton Standard Analysis System (SAS) routines. Because of software version changes, the data were reprocessed homogeneously at MPE using the SAS version 6.5.0 [see Cappelluti et al., 2007]. A fraction of the observations was affected by high and flaring background fluxes with count rates up to several hundred per second, compared to a quiet count rate of several counts per second per detector. The data were screened for low background intervals, rejecting time intervals with more than enhancements in the background of the individual observation [Cappelluti et al., 2007]. The remaining good time intervals for the PN–CCD detector added up to about 504 ksec (see Tab. 1). The requested exposure time for each pointing was 32 ksec, but some fields were observed longer due to scheduling constraints. The actual exposure times for the three detectors, PN–CCD, MOS1 and MOS2 are slightly different because of the different setup times. Two pointings (Field 16 and 25) were completely lost due to high background.
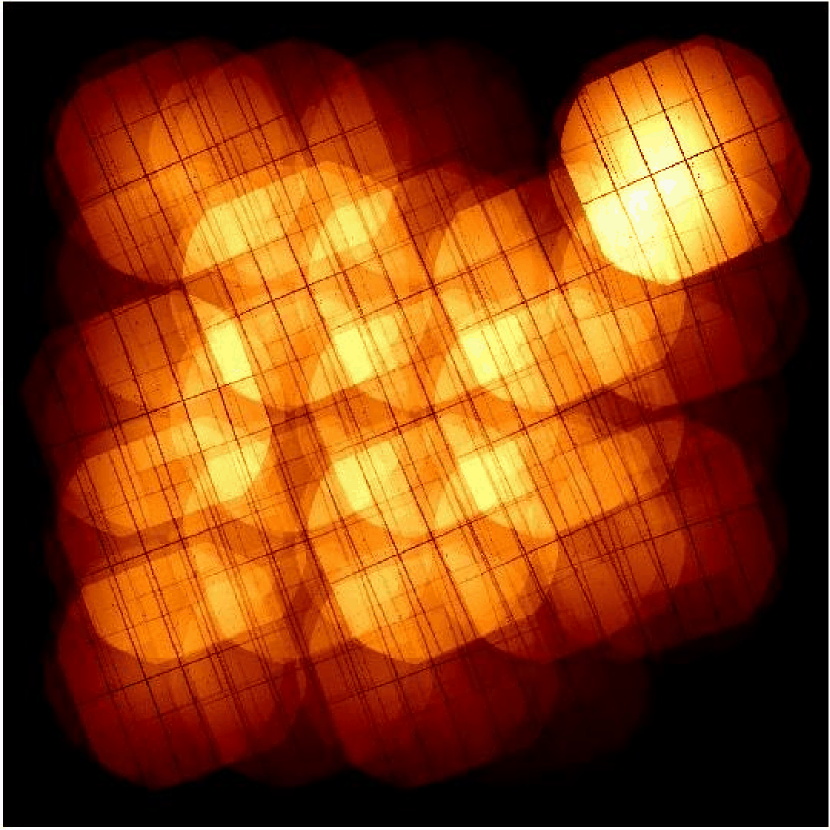
A number of hot pixels and hot columns were removed automatically from the event lists by the standard analysis software. We searched for additional hot pixels in images accumulated in detector coordinates, but did not find any. An exposure map for the whole mosaic of 23 pointings was calculated for the combination of PN–CCD plus MOS1 and MOS2 cameras (Fig. 1). The map shows residual structure due to the inter–CCD gaps and dead pixels; however, the raster strategy with a 15 arcmin step significantly reduces the residual structures. We have been granted another pass over the COSMOS Field with a total exposure time of 600 ksec in the next XMM–Newton observing period (AO4), thus almost doubling the existing dataset. The remaining large scale inhomogeneities due to missing pointings and variable net exposure times will be further smoothed out through the detailed planning of the upcoming observations. Because the pointing grid in AO4 will be shifted by 1 arcmin in both R.A. and Dec., we also expect an additional smearing of the small–scale inhomogeneities. These AO4 observations have already started and have partly been used in the wavelet analysis for diffuse sources in paper VI [Finoguenov et al., 2007]. The full set of observations will be reported elsewhere after completion of the whole X–ray survey.
3. Image Analysis
An Al–Kα line at 1.5 keV is present in both detector types. The PN background spectrum shows in addition two strong copper lines at 7.4 and 8.0 keV, which are not present in the MOS background. PN photons in the energy ranges 7.2–7.6 and 7.8–8.2 keV and all photons in the energy range 1.45–1.54 keV have therefore been neglected in the further analysis. For each separate pointing, images in celestial coordinates with a pixel size of 4″ have been accumulated in the 0.5–2, 2–4.5 and 4.5–10 keV bands for all three detectors. These are the energy bands, in which the XMM–Newton Standard Analysis is performed and which have also been used in the first XMM–Newton publication on the number counts in the Lockman Hole [Hasinger et al., 2001]. These bands are also rather close to the classical 0.5–2, 2–10 and 5–10 keV bands used in the literature, so that, given the energy–dependent sensitivity of imaging X–ray observatories, the counts to flux conversion has rather small systematic errors [see Hasinger et al., 2001]. The images have been individually background–subtracted and then mosaiced to the full raster pointing [see Cappelluti et al., 2007, for more details].
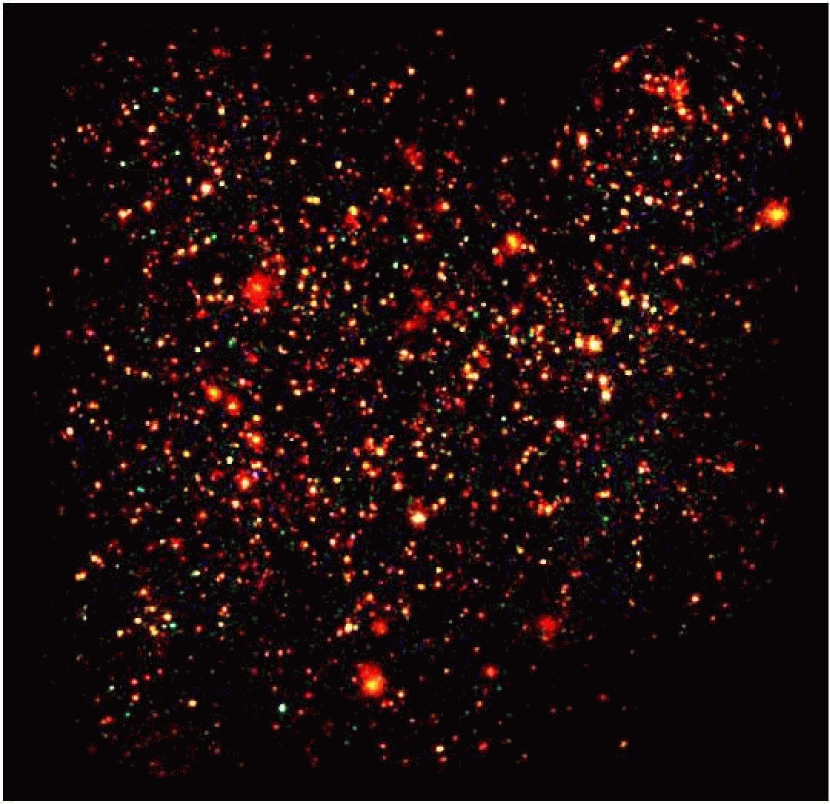
Variations in the astrometric reference between different pointings are less than 2″ and have been corrected for the current analysis. For each pointing the brighter X–ray sources have been statistically correlated to point–like optical objects (i.e. AGN or stars) using a maximum likelihood algorithm (eposcorr in SAS) to check the astrometry of the individual pointing images. Small corrections of order 2–3″ in Right Ascension and Declination were applied to the sky coordinates calculated from the original WCS keywords before jointly analysing all pointings [Cappelluti et al., 2007]. Combined PN+MOS1+MOS2 images were accumulated in the bands 0.2–0.5 keV (very soft), 0.5–2 keV (soft), 2–4.5 keV (hard) and 4.5–10 keV (very hard), respectively. Fig. 2 shows the background–subtracted image of all cameras combined in an X–ray false–color representation. The red, green and blue colors refer to the soft, hard and very hard images, respectively.
4. Summary of results
The source count rates from the 23–field COSMOS mosaic in the 0.5–2, 2–4.5 and 4.5–10 keV band have been converted to 0.5–2, 2–10 and 5–10 keV fluxes, respectively, and corresponding source counts have been derived in Cappelluti et al. [2007] together with the sky coverage for our observations. In this paper there is also an extensive discussion of systematic effects on the source counts, like source confusion and the Eddington bias. The logN–logS relations are nicely consistent with previous results from ROSAT, ASCA, BeppoSAX, Chandra and XMM–Newton. However, at intermediate fluxes they have unprecedented statistical accuracy due to the large number of objects involved. The total number of sources (point–like plus extended) detected in the 0.5–2, 2–10 and 5–10 keV bands are 1307, 735 and 187, respectively, and the corresponding flux limits are 0.7, 3.3 and 10 erg cm-2 s-1. The detection threshold has been set at a likelihood value of , where is the probability for a spurious source detection. This corresponds roughly to a Gaussian confidence threshold of 4.5. The number of spurious sources in the total COSMOS survey depends on the number of statistically independent trials, which can only be calculated numerically for our detection scheme. Detailed Monte Carlo simulations of the XMM–Newton observations in the COSMOS field, using the realistic exposure time and background levels [Cappelluti et al., 2007] show that at this likelihood threshold about 33 spurious sources, i.e. about 2.4%, are expected among the whole X–ray catalog of the COSMOS field. This is consistent with similar simulations for the Lockman Hole [Brunner et al., 2006] and is also confirmed by the statistics of optically empty error circles in Brusa et al. [2007]. The total number of different X–ray sources detected by the standard likelihood analysis method is 1416. The number of sources detected in the soft, hard and very hard band only are 676, 89 and 3, respectively. The number of 1416 sources includes 26 objects, which are found significantly extended by the maximum likelihood detection algorithm [Cappelluti et al., 2007].
First identifications with the optical catalogs from the CFHT Megacam, Subaru SuprimCam and HST ACS catalogs as well as the UKIRT K–band catalog are presented in accompanying paper III [Brusa et al., 2007]. Optical/NIR candidates for the X–ray sources are identified using the likelihood ratio technique. This is a commonly used technique for associating objects in two catalogues with each other [Sutherland & Saunders, 1992]. It compares the probability that the object in question is the true counterpart, given the catalogued position errors, with the probability of finding a chance object with this magnitude at the position of this counterpart. The large majority of the X–ray sources can be readily identified with high likelihood using this procedure. Only rather small fractions of the X–ray sources cannot be uniquely identified, because the error circles either are empty down to the sensitivity of the optical/NIR images (6%) or contain multiple, about equally likely counterparts (4%). Spectroscopic identifications of the optical counterparts of the X–ray sources have started using the IMACS spectrograph at the Magellan telescope [Impey et al., 2007] and the VIMOS spectrograph at the VLT in the zCOSMOS survey [Lilly et al., 2007]. Including about 40 spectroscopic identifications already in the literature, mainly from the 2dF and the SDSS surveys, a total of 377 X–ray sources could already be spectroscopically identified in the 23 XMM–Newton fields discussed here [see also Brusa et al., 2007].
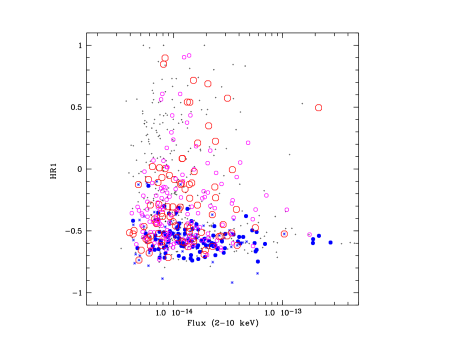
Hardness ratios have been calculated from the counts in the three different energy bands in the classical way:
HR1 refers to the hard versus soft band and HR2 to the very hard versus the hard band. Figure 3 shows an X–ray color–intensity diagram based on the 2–10 keV fluxes. Different symbols indicate different types of sources. It is easy to see that spectroscopically identified broad–line AGN (filled circles), as well as X–ray sources with point–like ACS counterparts (asterisks) only populate the soft part of the diagram, with hardness ratios typically in the range . These are candidate type–1 AGN. In this figure there is a slight shift between the average locus of these unabsorbed sources and the grid models, indicating that on average their spectra are more complicated than simple power laws. Sources spectroscopically identified with narrow emission or absorption lines (large open circles), as well as resolved ACS counterparts (small open circles) populate the whole hardness ratio range. These are either candidate type–2 AGN (mainly those with hard X–ray spectra) or low–luminosity type–1 AGN whose optical light is dominated by the host galaxy.
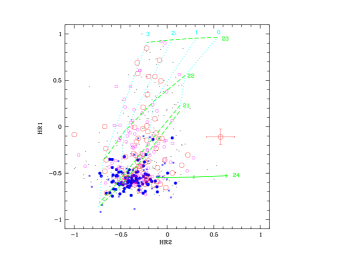
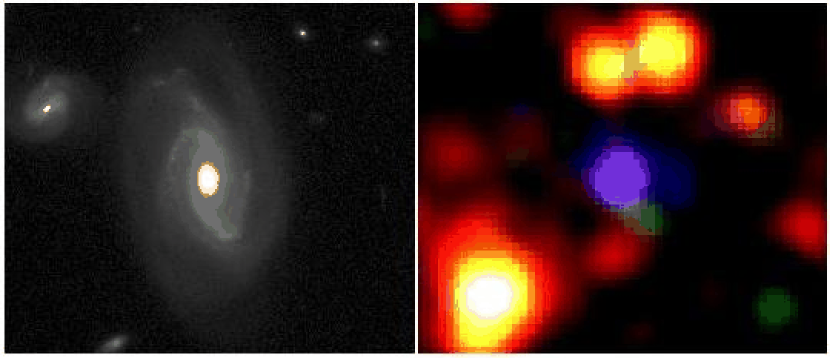
Figure 4 shows an X–ray color–color diagram for the same sources. For clarity we plotted only sources with reasonably small errors in the hardness ratio and which are significantly detected either in the hard or the very hard band (see caption). The grid of dashed and dotted lines, as well as the single solid line show different power law models folded through the instrument response of PN+MOS1+MOS2. As already found in Hasinger et al. [2001] and Della Ceca et al. [2004], type–1 AGN cluster in a well–defined location in this diagram, corresponding to low intrinsic absorption and spectral photon indices close to 1.7–2. The fact that the median of the type–1 AGN is shifted slightly to the right of the line may indicate the presence of additional soft components in some of the spectra. Type–2 AGN tend to have larger hardness ratios, especially in HR1, corresponding to larger intrinsic absorption values. Interestingly, there is a group of sources, putative type–2 AGN, which have quite hard colors in the hard band (HR2), but hardness ratios consistent with unabsorbed sources in the soft band, which do not fit any of the simple power law plus absorption models. The solid model track shows, however, that their colors can be reconciled with heavily absorbed low redshift sources with some fraction (1–10%) of unabsorbed flux leaking out. At higher redshifts, the intrinsically absorbed continua move to a softer band, so that these objects would shift to a different place in the color color diagram [Guainazzi, Matt & Perola, 2005]. A single prototypical object (#901) has already been discovered in the XMM–Newton observations of the Lockman Hole [Mainieri et al., 2002]. Guainazzi, Matt & Perola [2005] have recently shown that bright, local Compton–thick Seyfert–2 galaxies populate the same area in the color–color diagram. The large solid angle coverage of the COSMOS field now clearly identifies them as a population of the probably most absorbed objects in the field. Using the tentative criterion of HR2 and HR1, a total number of 18 candidates can be selected, which is of the total number of objects shown in Fig. 4, a fraction consistent with that detected in the Lockman Hole [Hasinger et al., 2001]. Mainieri et al. [2007] elaborate on the spectral analysis of individual sources, concentrating on the brighter spectroscopically identified sources in the COSMOS field.
A particularly interesting source is XID # 2608, the source with the largest HR2 ratio among those spectroscopically identified in Figure 4. It is a galaxy with a redshift z=0.125 from the SDSS archive and an I–band magnitude of 16.11 [Brusa et al., 2007]. Combining all three EPIC cameras, it has 72.4, 43.1 and 133.3 net counts in the soft, hard and very hard band, respectively, and thus a very peculiar X–ray spectrum. The 5–10 keV flux derived from the counts in the very hard band is erg cm-2 s-1, corresponding to a 5–10 keV luminosity of erg s-1. Fig. 5 shows a cutout from the ACS mosaic on the left and a zoom into the X–ray false color image on the right. The peculiar X–ray spectrum of this possibly weakly interacting spiral galaxy is immediately apparent from its strange violet X–ray color. A high quality optical spectrum for this source is available in the SDSS archive and has been analysed by Kauffmann et al. [2003] as part of their massive spectral analysis of all SDSS emission line galaxies. It has been classified by these authors as a narrow–line Seyfert galaxy with moderate power (logL[OIII]=6.45). The host galaxy is rather massive with a stellar mass around M⊙ and a stellar velocity dispersion of 160 km/s. Despite its absence in the total spectrum, a significant H emission line is found by these authors in the residual AGN spectrum after subtraction of the appropriate galaxy spectrum. The diagnostic line ratios log [OIII]/H=0.61 and log [NII]/H=0.12 put this object among the bulk of the normal Seyfert–2 galaxies. With its X–ray and [OIII] luminosity and its peculiar X–ray spectrum, the object can be identified as a heavily absorbed, moderately powerful Seyfert–2 galaxy, with a soft component from a leaky absorber, a scatterer/reflection nebula [Elvis, Briel & Henry, 1983] or a circumnuclear starburst region.
First science results from the XMM–Newton survey of the COSMOS field have also been derived in the realm of large scale structure and clusters of galaxies. A survey of clusters and groups of galaxies, based on extended X–ray sources detected by a wavelet algorithm in the dataset of 36 XMM–Newton pointings and overdensities in optical photometric redshift catalogs has detected 72 candidate groups and clusters over the whole field [Scoville et al., 2007, Finoguenov et al., 2007], of which the 19 most massive ones have independently been confirmed through a weak lensing analysis [Taylor et al., 2007]. These results provide first constraints on the number counts and mass function of groups and clusters in this so far unexplored flux range. A particularly interesting group of clusters has been found at a redshift around z=0.73 [Guzzo et al., 2007]. A first angular correlation function of the active galactic nuclei in the 23–field survey finds a significant signal in the range 0.5–20′ in all three energy bands 0.5–2, 2–4.5 and 4.5–10 keV [Miyaji et al., 2007].
5. Public Data Release / Acknowledgements
The COSMOS XMM–Newton data are publicly available in staged releases through the web sites at MPE: http://www.mpe.mpg.de/XMMCosmos/23fields/, and the one at at IPAC/IRSA: http://irsa.ipac.caltech.edu/data/COSMOS/. The XMM–Newton pipeline processed data are of course also available in the XMM–Newton archive.
References
- Almaini et al. [2003] Almaini, O., Scott, S. E., Dunlop, J. S., et al. 2003, MNRAS 338, 303
- Barger et al. [2003] Barger, A. J., Cowie, L. L., Capak, P., et al. 2003, AJ 126, 632
- Boyle et al. [2000] Boyle, B. J., Shanks, T., Croom, S. M., et al. , 2000, MNRAS 317, 1014
- Brandt & Hasinger [2005] Brandt, W. N. & Hasinger , G. 2005, ARA&A 43, 827
- Brunner et al. [2006] Brunner, H. et al. 2006, A&A in preparation
- Brusa et al. [2007] Brusa, M. et al. 2007, ApJS, this volume
- Cappelluti et al. [2005] Cappelluti, N., Cappi, M., Dadina, M., et al. , 2005, A&A 430, 39
- Cappelluti et al. [2007] Cappelluti, N. et al. 2007, ApJS, this volume
- Cappi et al. [2001] Cappi, M., Mazzotta, P., Elvis, M. et al. , 2001, ApJ 548, 624
- Cowie et al. [2002] Cowie, L. L., Garmire, G. P., Bautz, M. W., et al. 2002, ApJ 566, L5
- Cowie et al. [2003] Cowie, L.L., Barger A.J., Bautz M.W. et al. 2003, ApJ 586, L57
- Croton et al. [2005] Croton D. J., Springel, V., White, S. D., et al. 2005, MNRAS 365, 11
- Croom et al. [2005] Croom, S.M., Smith, R.J., Boyle, B.J., et al. 2005, MNRAS 356, 415
- Della Ceca et al. [2004] Della Ceca, R., Maccacaro, T., Caccianiga, A., et al. 2004, A&A 428, 383
- D’Elia, Fiore & Elvis [2004] D’Elia , V., Fiore, F., Elvis, M., et al. 2004, A&A 422, 11
- di Matteo et al. [2003] di Matteo, T., Croft, R. A. C. & Hernquist, L. 2003, ApJ
- Elvis, Briel & Henry [1983] Elvis, M., Briel, U. G. & Henry, J. P. 1983, ApJ 268, 105
- Fan et al. [2001] Fan , X., Strauss, M., Richards, G., et al. , 2001, AJ 121, 54
- Feigelson et al. [2004] Feigelson, E. D., Hornschemeier, A. E., Micela, G., et al. 2006, ApJ 614, 267
- Finoguenov et al. [2007] Finoguenov, A. et al. 2007, ApJS, this volume
- Fiore et al. [2003] Fiore, F., Brusa M., Cocchia F., et al. 2003, A&A 409, 79
- Franceschini et al. [1999] Franceschini, A., Hasinger, G., Miyaji, T. & Malquori, D. 1999, MNRAS, 310, L5
- Franceschini, Braito & Fadda [2002] Franceschini, A., Braito, V. & Fadda, D., 2002, MNRAS, 335, L51
- Gavignaud et al. [2006] Gavignaud, I., Buongiorno A., Paltani S. et al. 2006, A&A 457, 79
- Gilli, Salvati & Hasinger [2001] Gilli, R., Salvati M. & Hasinger, G., 2001, A&A 366, 407
- Gilli et al. [2003] Gilli, R., Cimatti, A., Daddi, E., et al. 2003, ApJ 522, 791
- Gilli et al. [2005] Gilli, R., Daddi, E., Zamorani, G., et al. 2005, A&A 430, 811
- Gilli, Comastri & Hasinger [2006] Gilli, R., Comastri, A. & Hasinger, G. 2006, (in prep.)
- Guainazzi, Matt & Perola [2005] Guainazzi, M., Matt, G. & Perola, G.C. 2005, A&A 444, 119
- Guzzo et al. [2007] Guzzo, L. et al. 2007, ApJS, this volume
- Hasinger et al. [2001] Hasinger, G., Altieri, B., Arnaud, M., et al. 2001, A&A 365, L45
- Hasinger et al. [2003] Hasinger, G. et al. 2003, AIP Conf. Proc. 666, 227
- Hasinger [2004] Hasinger, G. 2004, Nuclear Physics B Proc. Suppl.132, 86
- Hasinger et al. [2005] Hasinger, G., Miyaji, T. & Schmidt, M. 2005, A&A 441, 417
- Impey et al. [2007] Impey, C. et al. 2007, ApJS, this volume
- Jansen et al. [2001] Jansen, F., Lumb, D., Altieri, B., et al. 2001, A&A 365, L27
- Kauffmann & Haehnelt [2000] Kauffmann, G. & Haehnelt, M. G. 2000, MNRAS 311, 576
- Kauffmann et al. [2003] Kauffmann, G., Heckman, T.M., Tremonti, C. et al. 2003, MNRAS 346, 1055
- Kormendy & Gebhardt [2001] Kormendy, J. & Gebhardt, K. 2001, In The 20th Texas Symposium on Relativistic Astrophysics, eds. JC Wheeler, H Martel, pp. 363, Woodbury NY: AIP
- La Franca, Andreani & Cristiani [1998] La Franca, F., Andreani, P. & Cristiani, S. 1998, ApJ, 497, 529
- Leauthaud et al. [2007] Leauthaud, A. et al. 2007, ApJS, this volume
- Lilly et al. [2007] Lilly, S. et al. 2007, ApJS, this volume
- Madau, Pozzetti & Dickinson [1998] Madau, P., Pozzetti, L. & Dickinson, M. 1998, ApJ 498, 106
- Mainieri et al. [2002] Mainieri, V., Bergeron, J., Hasinger, G. et al. 2002, A&A 393, 425
- Mainieri et al. [2007] Mainieri, V. et al. 2007, ApJS, this volume
- Marconi et al. [2004] Marconi, A., Risaliti, G., Gilli, R., et al. 2004, MNRAS 351, 169
- Martini et al. [2006] Martini, P., Kelson, D. D., Kim, E., et al. 2006, ApJ 644, 116
- Menci et al. [2004] Menci, N., Fiore, F., Perola, G. C. & Cavaliere, A. 2004, ApJ 606, 58
- Merloni [2004] Merloni, A. 2004, MNRAS 353, 1035
- Merrit & Ferrarese [2001] Merrit, D. & Ferrarese, L. 2001, MNRAS 320, L30
- Miyaji, Hasinger & Schmidt [2000] Miyaji, T., Hasinger, G. & Schmidt, M. 2000, A&A 353, 25
- Miyaji et al. [2007] Miyaji, T. et al. 2007, ApJS, this volume
- Mullis et al. [2004a] Mullis, C. R., Vikhlinin, A., Henry, J. P., et al. 2004, ApJ 607, 175
- Mullis et al. [2004b] Mullis, C. R., Henry, J. P., Gioia, I. M., et al. 2004, ApJ 617, 192
- Mullis et al. [2005] Mullis, C. R., Rosati, P., Lamer, G., et al. 2005, ApJ 623, L85
- Risaliti, Maiolino & Salvati [1999] Risaliti, G., Maiolino, R. & Salvati, M. 1999, ApJ 522, 157
- Rosati, P. et al. [2002] Rosati, P., Borgani, S. & Norman, C., ARA&A 40, 539
- Scoville et al. [2007] Scoville, N. et al. 2007, ApJS, this volume
- Silverman et al. [2005] Silverman, J. D., Green, P. J., Barkhouse, W. A., et al. 2004, ApJ 624, 630
- Smolcic et al. [2007] Smolcic, V. et al. 2007, ApJS, this volume
- Steffen et al. [2004] Steffen, A. T., Barger, A. J., Capak, P., et al. 2004, AJ 128, 1483
- Strüder et al. [2001] Strüder, L., Briel, U., Dennerl, K., et al. 2001, A&A 365, L18
- Sutherland & Saunders [1992] Sutherland, W. & Saunders, W., 1992, MNRAS 259, 413
- Taylor et al. [2007] Taylor, N. et al. 2007, ApJS, this volume
- Treister et al. [2004] Treister, E., Urry, C. M., Chatzichristou, E., et al. 2004, ApJ 616, 123
- Treister & Urry [2005] Treister, E. & Urry, C. M. 2005, ApJ 630, 115
- Turner et al. [2001] Turner, M. J. L., Abbey, A., Arnaud, M., et al. 2001, A&A 365, L27
- Ueda et al. [2003] Ueda, Y., Akiyama, M., Ohta, K. & Miyaji, T. 2003, ApJ 598, 886
- Watson et al. [2001] Watson, M. G., Augueres, J.-L., Ballet, J., et al. 2001, A&A 365, L51
- Wall et al. [2005] Wall, J. V., Jackson, C. A., Shaver, P. A., et al. 2005, A&A 434, 133
- Wolf et al. [2003] Wolf, C., Wisotzki, L., Borch, A., et al. 2003, A&A 408, 499
- Wyithe & Loeb [2003] Wyithe J. S. B. & Loeb, A. 2003, ApJ, 595, 614
- Yang et al. [2003] Yang, Y., Mushotzky, R. F., Barger, A. J., et al. 2003, APJ 585, L85
- Yang et al. [2006] Yang, Y., Mushotzky, R. F., Barger, A. J., Cowie, L. L. 2006, APJ 645, 68