The Narrow Line Region:
Current Models and Future Questions
Abstract
I present a broad overview of modelling of the Narrow Line Region (NLR) of active galaxies, and discuss some of the more recent models we currently have for the emission from the NLR. I show why the emission line ratios from the NLR are constrained to certain observed values, and describe what physical parameters we can derive from observations using emission line models. Also presented are some examples of this, looking at the metallicity and excitation mechanism of active galaxies. As a final point, the limitations of the current models are discussed, and how how the combination of modelling and theory can help us solve some of the questions that still remain within the NLR.
Max Planck Institute for Astrophysics, Karl-Schwarzschild Str. 1, 85741 Garching, Germany
1. Introduction
The Narrow Line Region (NLR) is the region of extended interstellar gas ionized and heated by the active galactic nucleus (AGN). This region is classified as “narrow-line” as the gas lies outside the dominating influence of the central black hole, and the observed line velocity widths are much less than found in typical Broad Line Regions (discussed earlier in these proceedings). Even so, typical NLR velocity widths are in the range FWHM km s-1, and even higher velocity tails are observed.
Another distinguishing feature of the NLR is the gas density. In the NLR, the gas density is low enough that emission lines arising from magnetic dipole transitions can occur. These forbidden lines, like [O iii]Å and [N ii]Å, are strong gas coolants and dominate the NLR emission line spectrum. It is these lines that are typically used to identify both the NLR and AGN in optical spectra.
The NLR is also much more spatially extended than the BLR, reaching kiloparsec scales if the “Extended Narrow Line Region” (ENLR) is included. At such distances the NLR extends well beyond the nuclear obscuring material commonly called the torus, meaning that it is generally still visible even when other more nuclear regions, like the BLR, are hidden.
2. Line Ratio Diagrams
In modelling the NLR, we want to reproduce and explain the geometry and spatial extent of the region and, most importantly, the emission from this region. The emission lines from the NLR are not only indicative of the region, but also provide diagnostics for the density, temperature, and ionization mechanism of the NLR gas.
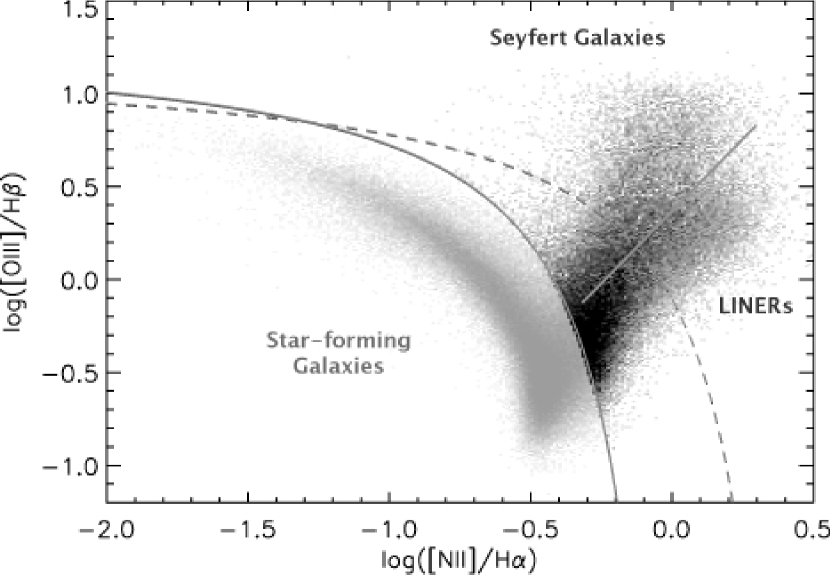
A useful visual tool for comparing models with observations of many NLR are Line Ratio Diagrams. As demonstrated by figure 1, these plot ratios of emission lines against each other and, depending upon the emission lines chosen, can show clear relationships with density, metallicity, and ionization mechanism (Veilleux & Osterbrock 1987). Figure 1 shows the “BPT” diagram, one of the earliest and strongest emission line diagrams, suggested by Baldwin, Phillips, & Terlevich (1981). This diagram is able to distinguish three different classes of narrow emission line galaxies: star-forming galaxies, Low Ionization Narrow Emission line Region or LINER galaxies, and the Seyfert galaxies which show typical AGN NLR emission line ratios. These three classes differ in their ionizing source and hence nebular temperature and emission. In terms of the NLR models, the final reproduced spectra must lie in the top right section of this diagram in the region occupied by the “pure” Seyfert galaxies.
3. Emission Line Region Modelling
To determine the resulting emission lines from ionized nebulae, emission line region models need to determine the density, temperature and ionization state of the ionized gas (discussed in detail in Dopita & Sutherland 2003). The temperature and ionization are determined fundamentally by the ionization source, of which there are two main pathways: Photoionization and Shock ionization.
3.1. Shock Ionization
In shock ionization modelling of NLR, the gas is excited collisionally through shocks caused by interactions with a jet or winds arising from the central AGN source. These models generally take as input the gas abundances and pre-shock density, shock velocity , and a parameter related to the magnetic field strength .
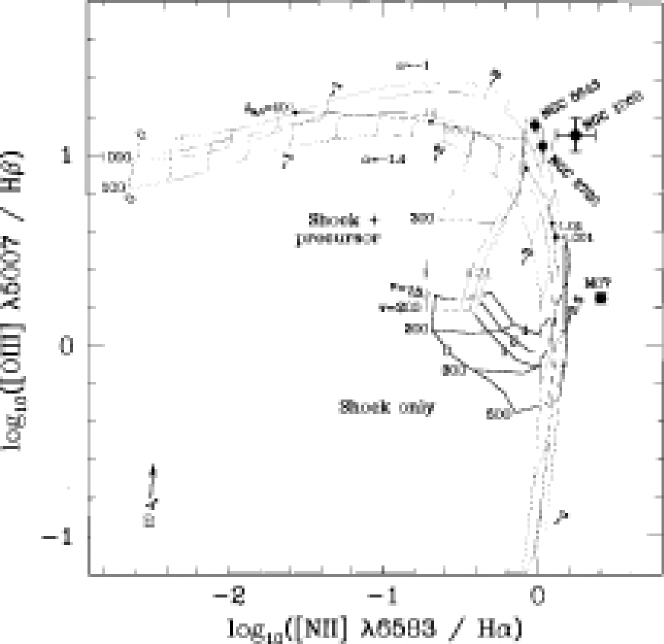
Typical line values for shock models are shown in figure 2. These models, discussed in detail in Allen, Dopita, & Tsvetanov (1998), cover the range of parameter space expected for Seyfert NLRs. As can be seen from the figure, the simple shock models are unable to reproduce typical Seyfert NLR line ratios. For some LINER-like objects however, they might possibly be the exciting mechanism.
3.2. Photoionization
In photoionization modelling, the NLR is excited by the UV and X-ray photons from a central source, thought to be the accretion disk surrounding the central black hole in AGN. These models have been explored for many years, with good reviews being the book by Osterbrock (1989) and the lecture by H. Netzer (Blandford et al. 1990, in ).
The typical parameters for photoionization models are the gas abundances and initial density, the size or column depth of the model cloud, the incident ionizing spectrum, and the incident ionizing flux of the radiation. The final parameter is often described in terms of the ionization parameter, , a dimensionless measure of the density of ionizing photons over the gas density,
| (1) |
is a controlling parameter of the emission line spectrum in photoionization models.
The resulting models for a range of typical NLR values can be seen in figure 2. The models do reproduce the ratios quite well for a limited range of parameters, as well as others such as [O I]/H. However these models cannot reproduce both low-ionization and high-ionization line strengths simultaneously, for example failing to reproduce He II/H with the same parameter set, and these simple models haven been ruled out (Stasinska 1984).
With both simple shock models and simple photoionization models not surprisingly ruled out, several more complicated models have been put forward to try and better reproduce and explain the NLR.
3.3. Shock+Precursor
It was realized early on in shock modelling that fast shocks ( km s-1) would produce ionizing photons (Dopita & Sutherland 1995, 1996). As post-shock gas cools it produces ionizing photons which diffuse up- and down-stream, and ionize the pre-shock gas. Thus the ionization in fast shocks is actually a combination of both shock and photo-ionization, where the photoionization is determined by the shock velocity.
These shock+precursor models are able to reproduce the observations quite well, as shown in figure 2, and can also produce some of the higher ionization lines. However, the problem with these models is that they require shocks throughout the NLR, meaning shock signatures should always be visible. So by themselves these models cannot explain all NLR emission.
3.4. Multi-Component Photoionization
The next level of complexity in terms of photoionization models is multi-component or multi-cloud photoionization, where the combination of two or more photoionization models is used to reproduce both the high and low ionization lines in the NLR.
Generally, most models limit themselves to two components to minimize the number of free parameters. These models have been used to examine specific galaxies (e.g. Kraemer & Crenshaw 2000; Morganti et al. 1991) and more generally trying to explain specific line ratios (e.g. Komossa & Schulz 1997; Murayama & Taniguchi 1998) or line strengths (Baskin & Laor 2005).
The main problem with these models is that as you increase the number of clouds, the problem becomes unconstrained. A way around this is to provide a physical basis for the multiple clouds, and hence physical constraints. Here I mention three current models that try to deal with this problem.
3.5. Models
The models of Binette et al. (1996) consider the NLR to be made up of hot, highly ionized, matter bounded111Matter bounded clouds have low enough column densities that not all ionizing radiation is absorbed. This compares to Ionization bounded clouds where all ionizing radiation is absorbed. clouds and, lower ionization, ionization bounded clouds. In their model, the ionization bounded (I-) clouds see the absorbed spectrum from the matter bounded (M-) clouds, and the I-clouds are also a higher density. The resulting emission line spectrum from these models is the controlled by the ratio of these two components, .
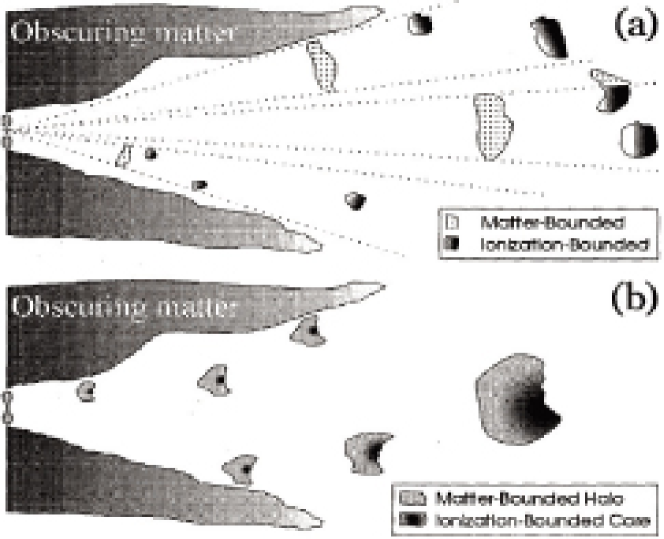
Two possible physical pictures of their model are shown in figure 3 (their figure 4). The first (figure 3a) is where the clouds are separate, with inner clouds being M-clouds, and the outer are I-clouds, while the second (figure 3b) shows composite clouds, with an I-cloud core and a M-cloud photoevaporating halo.
3.6. Local Optimally Emitting Clouds
The Locally Optimally-emitting Cloud model of Ferguson et al. (1997) is an extension of a model for the BLR. It uses the fact that the spectra we observe in AGN NLRs are likely to be dominated by selection effects: each line we observed arises from the clouds in which it is most strongly emitted. As each line emits strongest near its critical density, this recreates the linewidth-critical density relation observed in some NLR.
For their model, Ferguson et al. run a grid of simple photoionization models covering a range of densities and radii from the nucleus (connected to incident flux). The total line flux is then the integral of these over the NLR cloud distribution function, ,
| (2) |
While can take any form, for simplicity they assume separate power-law distributions,. With this distribution and simple models they obtain models that reproduce the observations very well, as shown by their figure. However again, these models are actually relatively physically unconstrained, and importantly they ignore the fact that the NLR is clumpy in nature and dusty.
3.7. Radiation Pressure Dominated Dusty Clouds
The dusty, radiation pressure dominated cloud models by Groves et al. (2004a, b) take in the observations that indicate that the NLR clouds are likely dusty and clumpy in nature to come up with a physical model that explains why AGN NLRs cluster where they do on line ratio diagrams. It uses the fact that at high ionization parameter () dust dominates the opacity in dusty gas, and that in isobaric systems the gas pressure gradient must match the radation pressure gradient to realise that radiation pressure on dust will dominate the NLR structure at high . As shown in detail in Dopita et al. (2002) this leads to a self regulatory mechanism for the local222 is defined using the local absorbed ration field and density. ionization parameter and hence for the emission lines. These models reproduce the observations very well for both high and low ionization species, as shown in the figures in Groves et al. (2004b), and converge in the region in line ratio diagrams where the NLR is observed to be.
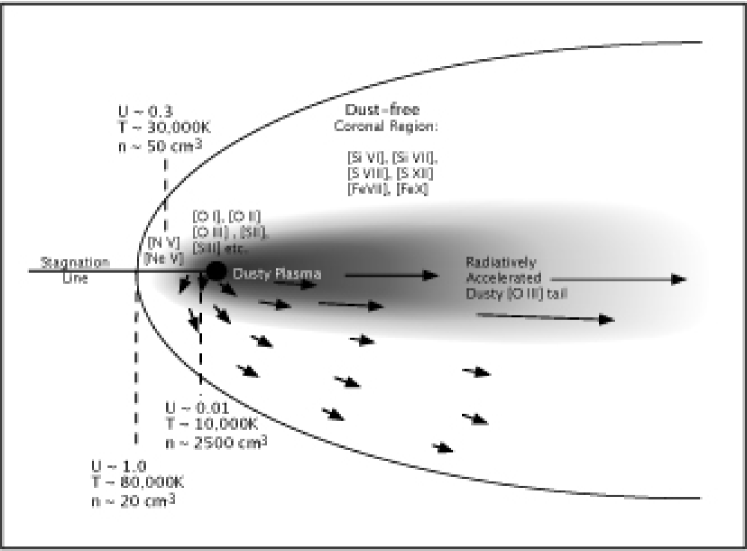
The physical picture for these models is shown in figure 4, revealing the main emitting region, the observed NLR tails, and possible sources for the very high ionization “coronal lines” observed in some AGN. In many respects it is very similar to the picture shown in figure 3b.
These models have several other benefits arising from the dust, such as a hardening of the radiation field (cf. the models), increased temperature through photoelectric heating, and of course the corresponding IR emission. This provides another constraint of NLR models, as the models (e.g. Groves et al. 2006a) must match recent observations of IR emission from the NLR (see e.g. Bock et al. (2000); Mason et al. (2006) and several other papers in this proceedings such as by Schweitzer).
The dust is also a hindrance in some respects, as Iron lines like [Fe VII] tend to be too weak due to dust depletion. Similarly, other high ionization coronal lines are unable to be reproduced. It should be noted however, that these models are for individual NLR clouds, not the NLR as a whole.
4. Low Metallicity AGN
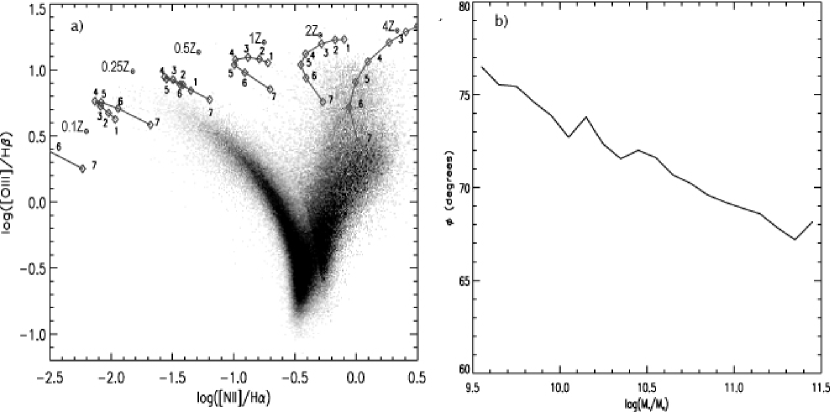
One of the uses of NLR models is to determine the average physical quantities of a specific AGN. Inversely, it is possible to use NLR models to predict what type of emission AGN of a specific type would have. For example, in a recent work Groves et al. (2006b) used NLR models to determine strong metallicity-sensitive emission line ratio diagrams, and where low metallicity AGN would appear on these. Figure 5a reveals one possible diagram, the BPT diagram, well known to be metallicity sensitive due to the secondary nature of nitrogen (Storchi-Bergmann et al. 1998). These diagrams were then used to look for possible low metallicity AGN in the SDSS emission line galaxy sample. Only 40 likely low metallicity Seyferts were found in a sample of 23000 Seyferts (or “pure” Seyferts).
5. Diagnosing Emission Line Galaxies
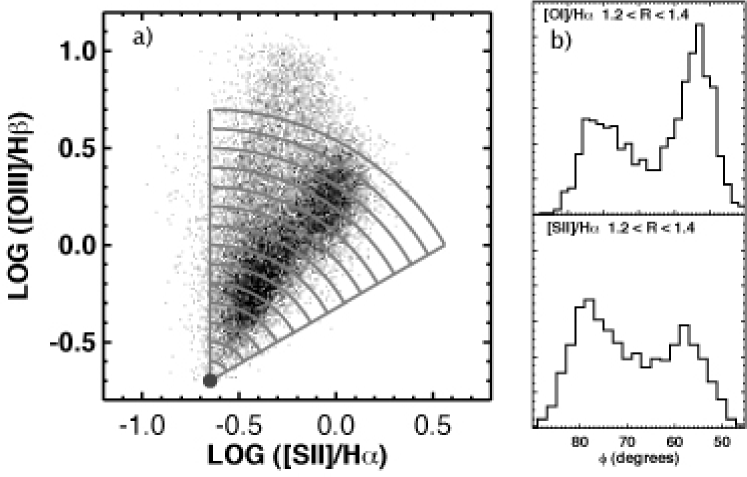
Emission line ratio diagrams were originally suggested to separate Star-forming galaxies from Seyfert type-2 (NLR only) galaxies, as both show strong narrow lines, although at different strengths (Baldwin, Phillips, & Terlevich 1981). With the advent of large spectroscopic surveys like SDSS this work has progressed much further, with the BPT diagram showing a clear continuum of objects with the edges of the V-Shaped figure corresponding to galaxy evolution effects, ionization limits, and observation limits. While the distinction between the star-forming galaxies and AGN is clear in the BPT diagram (Figure 1) apart from at low [O III]/H, the distinction between the LINERs and Seyfert galaxies is not so clear, and these objects are often classed together. Recent work by Kewley et al. (2006) however, has shown that a clear divide does exist between Seyfert and LINER objects as shown in figure 6. This figure demonstrates that LINERs and Seyferts appear as distinct populations in the [S II] and [O I] line ratio diagrams.
With this distinction, the separate galaxy properties of all three classes have been examined and compared. In addition, with NLR models like Groves et al. (2004a, b) and Star-forming galaxy models like Dopita et al. (2006) we are coming a far way in understanding the full spread of emission line galaxies in line ratio diagrams.
6. Conclusions
With current Narrow Line Region models we have a reasonably good physical understanding of the NLR and its appearance and emission lines. These models can be used to determine properties of the NLR and AGN, but caution is still needed, as these models are limited.
An individual NLR consists of many clouds, with a probable range of densities, pressures and incident spectrum. These clouds could also vary in their abundances, metallicity and dust properties, and certainly vary in shape and size. The differences between different active galaxies will be even larger. Thus models must account for this, but similarly they must account for the fact that NLR spectra are all very similar. The current NLR models are almost there but a full physical, geometrical model is not yet available.
Acknowledgments.
I would like to thank the organizers for inviting me to what turned out to be a full and very interesting conference, and for giving me the opportunity to visit China. I would also like to thank MPA and G. Kauffmann for funding me to this conference.
References
- Allen, Dopita, & Tsvetanov (1998) Allen, M. G., Dopita, M. A., & Tsvetanov, Z. I. 1998, ApJ, 493, 571
- Baldwin, Phillips, & Terlevich (1981) Baldwin, J. A., Phillips, M. M., & Terlevich, R. 1981, PASP, 93, 5 (BPT)
- Baskin & Laor (2005) Baskin, A., & Laor, A. 2005, MNRAS, 358, 1043
- Binette et al. (1996) Binette, L., Wilson, A. S., Storchi-Bergmann, T., 1996, A&A, 312, 365
- Blandford et al. (1990) Blandford, R. D., Netzer, H., Woltjer, L., Courvoisier, T. J.-L., & Mayor, M. 1990, Saas-Fee Advanced Course 20. Lecture Notes 1990. Swiss Society for Astrophysics and Astronomy, XII, Springer-Verlag Berlin Heidelberg New York
- Bock et al. (2000) Bock, J. J., et al. 2000, AJ, 120, 2904
- Contini et al. (2004) Contini, M., Viegas, S. M., & Prieto, M. A. 2004, MNRAS, 348, 1065
- Dopita & Sutherland (1995) Dopita, M. A. & Sutherland, R. S. 1995, ApJ, 455, 468
- Dopita & Sutherland (1996) Dopita, M. A. & Sutherland, R. S. 1996, ApJS, 102, 161
- Dopita et al. (2002) Dopita, M. A., Groves, B. A., Sutherland, R. S., Binette, L., & Cecil, G. 2002, ApJ, 572, 753
- Dopita & Sutherland (2003) Dopita, M. A. & Sutherland, R. S. 2003, Astrophysics of the diffuse universe, Berlin, New York: Springer, 2003. Astronomy and astrophysics library, ISBN 3540433627,
- Dopita et al. (2006) Dopita, M. A., et al. 2006, ApJ, 647, 244
- Ferguson et al. (1997) Ferguson, J. W., Korista, K. T., Baldwin, J. A., & Ferland, G. J. 1997, ApJ, 487, 122
- Groves et al. (2004a) Groves, B. A., Dopita, M. A., & Sutherland, R. S. 2004, ApJS, 153, 9
- Groves et al. (2004b) Groves, B. A., Dopita, M. A., & Sutherland, R. S. 2004, ApJS, 153, 75
- Groves et al. (2006a) Groves, B., Dopita, M., & Sutherland, R. 2006, A&A, 458, 405
- Groves et al. (2006b) Groves, B. A., Heckman, T. M., & Kauffmann, G. 2006, MNRAS, 371, 1559
- Kewley et al. (2006) Kewley, L. J., Groves, B., Kauffmann, G., & Heckman, T. 2006, MNRAS, 372, 961
- Komossa & Schulz (1997) Komossa, S. & Schulz, H. 1997, A&A, 323, 31
- Kraemer & Crenshaw (2000) Kraemer, S. B. & Crenshaw, D. M. 2000, ApJ, 544, 763
- Mason et al. (2006) Mason, R. E. et al. 2006, ApJ, 640, 2
- Morganti et al. (1991) Morganti, R., Robinson, A., Fosbury, R. A. E., di Serego Alighieri, S., Tadhunter, C. N., & Malin, D. F. 1991, MNRAS, 249, 91
- Murayama & Taniguchi (1998) Murayama, T. & Taniguchi, Y. 1998, ApJ, 503, L115
- Osterbrock (1989) Osterbrock, D. E., 1989, Astrophysics of Gaseous Nebulae and Active Galactic Nuclei, (University Science Books)
- Stasinska (1984) Stasinska, G. 1984, A&A, 135, 341
- Storchi-Bergmann et al. (1998) Storchi-Bergmann, T., Schmitt, H. R., Calzetti, D., & Kinney, A. L. 1998, AJ, 115, 909
- Veilleux & Osterbrock (1987) Veilleux, S. & Osterbrock, D. E. 1987, ApJS, 63, 295