Structure and Kinematics of CO (J=2-1) Emission in the Central Region of NGC 4258
Abstract
We present 12CO (2-1) observations towards the central region of the Seyfert 2 galaxy NGC 4258 with the Submillimeter Array (SMA). Our interferometric maps show two arm-like elongated components along the major axis of the galaxy, with no strong nuclear concentration. The CO (2-1) morphology and kinematics are similar to previous CO (1-0) results. The velocity field of the components agrees with the general galactic rotation, except for the east elongated component, which shows a significant velocity gradient along the east-west direction. In order to account for the velocity field, we propose the kinematical model where the warped rotating disk is also expanding. The line ratio of CO(2-1)/CO(1-0) reveals that the eastern component with the anomalous velocity gradient appears to be warmer and denser. This is consistent with the gas in this component being closer to the center, being heated by the central activities, and possibly interacted by expanding motions from the nuclear region.
1 Introduction
Molecular gas in the central regions of Seyfert galaxies provides important clues to the nuclear environment of the Active Galactic Nuclei (AGN). It is generally proposed that the activity of the AGN is driven by the accretion of gas onto a massive black hole in the center of the host galaxy. The actual structure and dynamics of the nuclear gas will provide some constraints on the accretion process. There have been many molecular line studies of the central regions of galaxies with interferometry. Recent molecular gas imaging surveys in Seyfert galaxies show that molecular clouds in circumnuclear region have diverse morphologies (e.g. Kohno et al. 2001, García-Burillo et al. 2003). Different CO lines are sometimes found to exhibit different distributions in the same galaxy. For example, in the case of M51, a Type-2 Seyfert galaxy, the CO (1-0) line emission is mainly associated with galactic arms and a weak nuclear peak (Sakamoto et al. 1999). However, in the CO (3-2) line, the intensity in temperature of the central concentration is higher than in the CO (1-0) line (Matsushita et al. 2004). This suggests that the nuclear regions may have warm and dense gas which is better sampled with higher excitation lines. Currently, M51 is the only Seyfert galaxy where several CO lines have been well studied with millimeter and submillimeter interferometers, and it is important to know whether the presence of warm gas in the nuclear regions is in fact common for other Seyferts.
NGC 4258 is a nearby spiral galaxy whose nuclear activity is classified as Seyfert 2 or LINER (Heckman 1980; Stauffer 1982; Makishima et al. 1994; Ho et al. 1997), and whose distance is 7.2 Mpc (Herrnstein et al. 1999). This galaxy is also known for bisymmetric “anomalous arms” in H, radio continuum and X-ray emission that span nearly the full visual extent of the galaxy (e.g. van der Kruit et al. 1972, Pietsh et al. 1994, Wilson et al. 2001). The anomalous arms have been interpreted as jets from its galactic nucleus (Ford et al. 1986; Martin et al. 1989; Cecil et al. 1992, 1995, 2000; Dutil et al. 1995; Daigle and Roy 2001) or as gas flow due to a bar (Cox and Downes 1996).
NGC 4258 is also well known to exhibit a sub-pc-scale molecular disk (P.A., Inclination) as traced by H2O maser emission (Miyoshi et al. 1995, Herrnstein et al. 1999). The major axis of the molecular disk is along the east-west direction although the P.A. of the host galaxy is around (e.g. van Albada 1980, Cox and Downes 1996), and the angle between the two rotation axes of the sub-pc-scale disk and the galactic disk is (Miyoshi et al. 1995). This indicates a significant misalignment between the axes of rotation for the entire galaxy and for the nuclear disk. Until now, the morphological and kinematical connections between the host galaxy and the nuclear disk have not been elucidated.
In NGC 4258, the CO (1-0) and (2-1) lines have been detected in single dish observations with a large velocity range from 200 to 700 km s-1 and are concentrated to the anomalous arms in the nuclear region (Sofue et al. 1989, Krause et al. 1990, Cox and Downes 1996). Interferometric studies of the CO (1-0) line emission have been done with OVRO (Plante et al. 1991), BIMA (Helfer et al. 2003) and PdBI (Krause et al. 2005), and they show two parallel elongated structures along a direction of P.A. associated with the central part of the anomalous arms, although the peak position of H is in a depression between the two CO structures (Martin et al. 1989; Plante et al. 1991; Cecil et al. 1992; Krause et al. 2005). To interpret the CO distribution, three models had been proposed. One model suggest that jets emanate from the AGN, and dig tunnels into the molecular gas. The jets then separate a big molecular cloud into two regions and create the depression between the two regions. Therefore, CO emission may be tracing the molecular gas which has been interacted with the jets (Martin et al. 1989, Plante et al. 1991). Plante et al. (1991) developed the model which superposes uniform expansion away from the nucleus in addition to a velocity pattern which is similar to that of the solid body rotation. Still another model suggests that the CO molecular gas is tracing an elongated bar structure, and that the “anomalous arms” may be region of shocked gas due to the presence of a bar. Cox and Downes (1996) have suggested that the CO velocity pattern along the arms is consistent with gas flow along -orbits, and that the broader CO line widths near the center of the galaxy may be due to the existence of the -orbit. Here we show CO (2-1) maps of the central region of NGC 4258, at resolution, obtained with the Submillimeter Array 111 The Submillimeter Array is a joint project between the Smithsonian Astrophysical Observatory and the Academia Sinica Institute of Astronomy and Astrophysics, and is funded by the Smithsonian Institution and the Academia Sinica. (SMA; Ho, Moran and Lo 2004), and compared the CO (2-1) maps with the past results of CO (1-0) by BIMA (Helfer et al. 2003). We evaluate the motion of the gas close the nucleus, and we present models in order to explain the velocity field of the CO molecular gas.
2 Observations and Data Reduction
The observations were carried out on May 4 2004 with the SMA, which consists of eight 6-m antennas. All the antennas were used for the observations. Projected baseline lengths ranged from 10 m to 128 m, which resulted in a synthesized beam size of (104 pc 69 pc in NGC 4258). Zenith opacity was between 0.1 and 0.3 at 225 GHz during the observations, and typical double sideband system temperatures towards the galaxy were 100–200 K at 1.3 mm. The correlator was configured with a frequency resolution of 0.8125 MHz. We observed J1150+497 and J1308+326 every 30 minutes for system gain calibrations. Jupiter and Callisto were observed for flux and bandpass calibration, respectively.
Calibration of raw data was done using the MIR package. Imaging and data analysis were performed using the MIRAD and NRAO AIPS package. Channel maps were made every 10 km s-1 with natural weighting of the u,v data. CO (2-1) emission was detected in 46 channel maps and imaged with the CLEAN method. The integrated intensity map and isovelocity map were created from the 46 CLEAN channel maps with CO (2-1) emission. No continuum emission was detected from data integrated over all line-free channels in a frequency range of 1.1 GHz down to a 3 rms noise level of 8.7 mJy beam-1. The FWHM of the primary beam field of view with the SMA antenna at 230 GHz is . For comparison with CO (1-0), we used the BIMA archival channel maps. The synthesized beam size of the BIMA maps is .
3 Results
3.1 CO (J=2-1) integrated intensity
CO (2-1) emissions is detected within the velocity range from 200 to 655 km s-1, which is consistent with past single-dish observations with the IRAM 30-m telescope (Cox and Downes 1996). Convolving with the same beam size as the single dish (), we estimate that our observations recovered of the single-dish flux. The missing flux is due to the lack of short ( 10 m) baselines, corresponding to a component bigger than 26 arcsec.
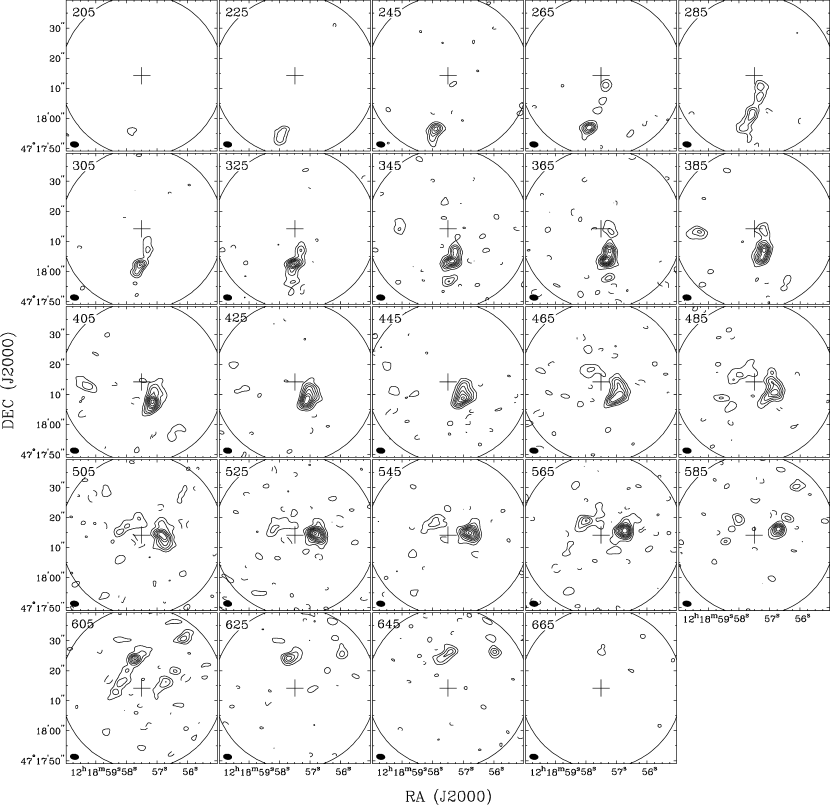
The channel maps of the CO (2-1) line with velocity resolution of 20 km s-1 are shown in figure 1. The integrated intensity map as shown in figure 2, reveals two main elongated structures along P.A. of 152∘ and a few faint components. These components identified by Plante et al. (1991) are labeled from 1 to 3. The west elongated structure (Component 1) shows several bright peaks, which is resolved for first time with the higher angular resolution of the SMA. The east elongated structure (Component 3) was resolved into two sub components, which have been found as a double-peak structure by BIMA (Helfer et al. 2003). The southern sub component of Component 3 is linked to Component 1 by a faint ridge. In previous CO (1-0) maps, Component 2 was an elongated component connecting to the north end of Component 1 (Plante et al. 1991, Helfer et al. 2003). Our CO (2-1) map shows that Component 2 appears only as a few resolved clumps located north of Component 1 possibly due to the missing flux or due to lack of CO (2-1) emission. Although the extended structures of the center found in the IRAM CO (2-1) map (Cox and Downes 1996) and in the BIMA CO (1-0) map are not seen in our SMA map, the general agreement of the CO (2-1) emission with the CO (1-0) emission is very good. Note that there is no concentrated CO (2-1) emission in the center of the galaxy as in the case of M51 (Matsushita et al. 2004).
The integrated intensity at the position of the galactic nucleus, is at the 3 level 6.3 Jy beam-1 km s-1 (24.6 K km s-1). Assuming the ratio of integrated intensity CO(2-1)/CO(1-0) , we can estimate the column density of molecular hydrogen cm-2 in the center using a Galactic CO-H2 conversion factor of cm-2 (K km s-1)-1 (Solomon et al. 1987). Equivalent would be cm-2. The value is lower than the estimate of - cm-2 as suggested by the modeling of X-ray spectra (Fruscione et al. 2005). However the estimates of from the X-ray data refer to a much smaller sizescale associated with the accretion disk around the central AGN. Total mass of the molecular gas in the nuclear region within the central 100 pc is estimated to be .
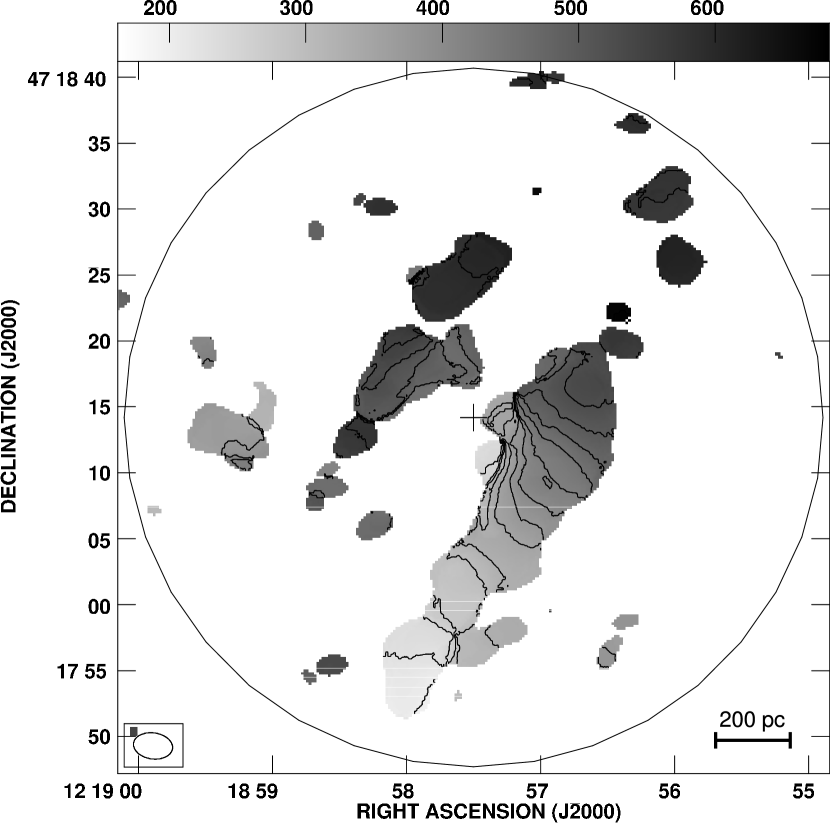
3.2 CO (J=2-1) isovelocity field
Figure 3 shows the isovelocity contour map of the CO (2-1) emission in NGC 4258. Contours of the velocity field in Component 1 are almost perpendicular to the optical major axis (P.A.) of the galaxy. Component 1 is extended over 1.1 kpc with a velocity range from 200 to 550 km s-1 along the major axis. The velocity contours for Component 1 are more closely spaced and rotated by as we get closer to the center, which agrees with the velocity field of CO (1-0) which Plante et al. (1991) have shown. The velocity field on Component 2 extends from 550 to 650 km s-1 and the velocity contours within Component 2 are almost perpendicular to the direction of P.A. of . The velocity pattern on Component 2 also agree well with those of CO (1-0). Within Component 3, we see two different velocity gradients. One velocity gradient is roughly seen along the major axis of Component 3, and similar to the CO (1-0) map. The other velocity gradient is almost along the east-west direction on the southern sub component of Component 3, which cannot be explained by a simple galactic rotation. The position-velocity diagrams on Component 3 along the P.A. in CO (1-0) and CO (2-1) is shown in figure 4. In CO (2-1), the velocity gradient is apparently found along the P.A. of 90∘ with a velocity range from 470 to 600 km s-1. Velocity gradient in CO (1-0) reveals two different velocity gradients; the first gradient is shown from 400 to 600 km s-1, which is due to the velocity gradient along the major axis of Component 3. The second gradient is formed by two peaks at 510 and 540 km s-1, as shown by the dashed line in figure 4(a), which is similar to the velocity gradient found in CO (2-1).
3.3 Residual velocity field after subtracting the rotation model
In order to see the unusual velocity gradient clearly, we analyzed the velocity field assuming circular motions to subtract a rotation curve. We performed a least square fit by applying the AIPS GAL task (van Moorsel and Wells 1985). Because the velocity fields of CO (1-0) and CO (2-1) are so similar to each other, while the field of view of the CO (1-0) map is larger and the CO (1-0) emission is more extended, we modeled the overall velocity field by fitting the BIMA CO (1-0) map with a Brandt rotation curve (Brandt 1960),
| (1) |
where is a measure of the steepness of the rotation curve and is the radius at which the maximum rotation velocity occurs. The fitting was done with a range of radius from 0 to 60 arcsec (0 to 2 kpc) in the center of NGC 4258. Figure 5 shows the velocity along the radius and the resulting rotation curve. The fit with GAL also gives parameters of center position, position angle, inclination and systemic velocity (table 1). The agreement with previous estimates is excellent. In figure 5, the rotation curve drops rapidly at 200 pc. Using the resulting parameters of the center position, the position angle and the inclination from the Brandt rotation in table 1, the velocities within 200 pc is also fitted by a solid body rotation. From the Brandt rotation, the dynamical masses within the radii of 200 pc and a 320 pc are obtained as and , respectively.
From the solid body rotation, the dynamical mass within the 200 pc radius is estimated as . These estimates are consistent with the dynamical mass of estimated to be within a 320 pc radius from previous observation of CO (1-0) in NGC 4258 (Sofue et al. 1989). They are also similar to the dynamical mass measured with CO (1-0) within a 200 pc radius for the Virgo spiral galaxies (0.1–3; Sofue et al. 2003).
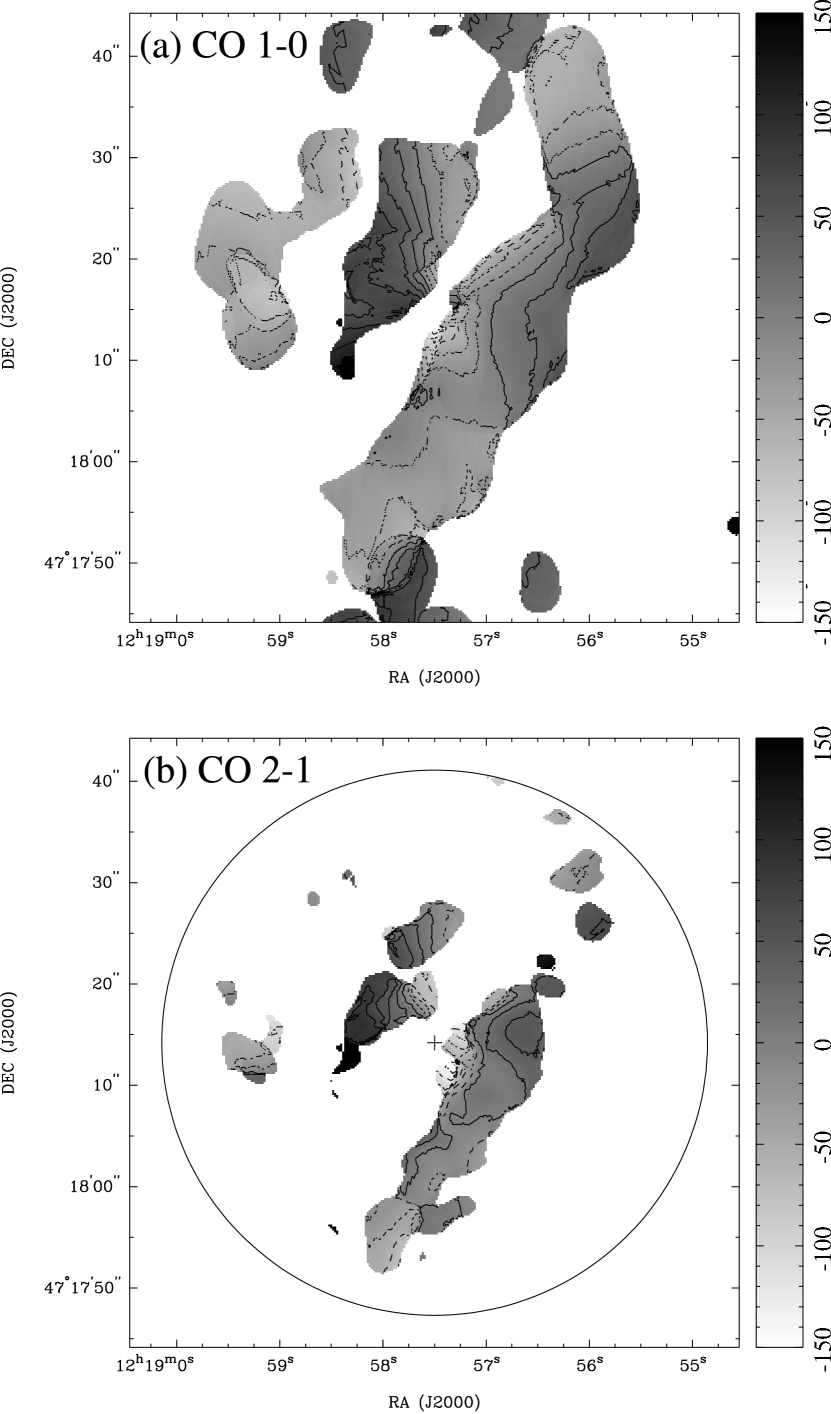
Residual velocity field maps are obtained by subtracting the Brandt rotation model from the CO (1-0) and CO (2-1) isovelocity map (figure 6). The residual velocity field is within a range of km s-1 on Component 1 and 2. Within the southern sub component of Component 3, a large velocity offset of km s-1 remains. We clearly find a residual velocity gradient along the east-west direction which spans 6 arcsec (200 pc) in the southern sub component of Component 3 (figure 6b).
We can compare the residual velocity field in CO (2-1) with a residual velocity map of H after subtracting a rotation model in the center, which is similar to the Brandt rotation. The H results have shown that the velocity in the anomalous arms is considerably offset from the basic rotation (van der Kruit 1974), with in the northern arm blueshifted by to km s-1 in the northern part of the galactic center. However, the large velocity offset of H is seen arcseconds (1 kpc) shifted to north-west from the center. The H residual velocity map shows no significant velocity offset ( 50 km s-1) at the region where Component 3 lies, 200 pc shifted to north-east from the center. It is possible that the velocity offset in H further out is due to a jet from the central engine, while the velocity offset in CO (2-1) near the center could be a reflection of another motion in the circumnuclear region.
3.4 The CO(2-1)/CO(1-0) line ratio map
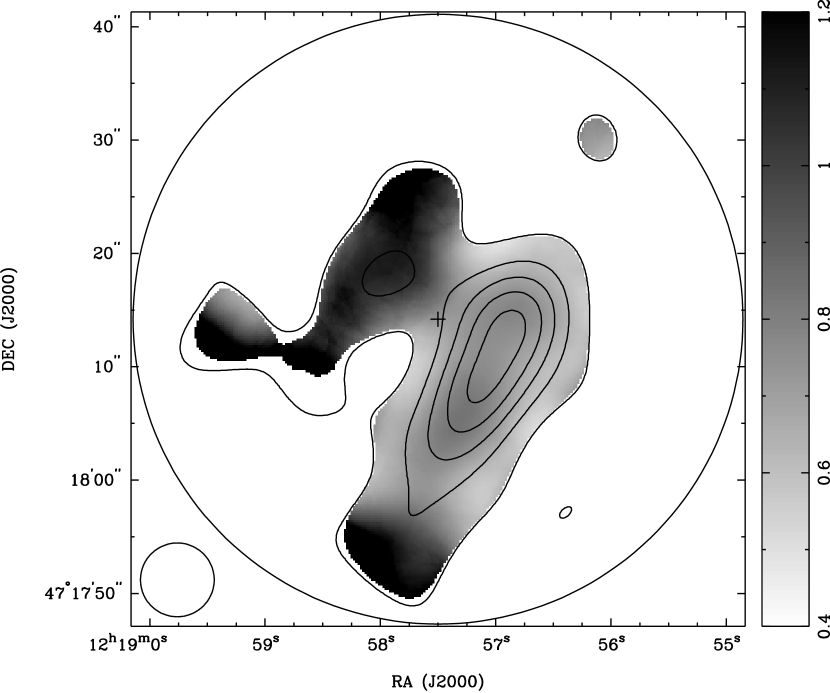
The ratio of the CO brightness temperatures allows us to estimate the physical state of the CO gas. In order to obtain a CO (1-0) intensity map with the same uv sampling as our SMA CO (2-1) data, we used the CO (1-0) BIMA channel maps as a model. The CO (1-0) BIMA map includes single-dish data and it recovers extended structures. We performed FFT and sampled it with our SMA uv coverage. Next we imaged channel by channel and created a new integrated map from these sampled visibilities. Then we deconvolved it in the usual way. As the CO (1-0) data are missing the long uv spacings, both the CO (1-0) simulated image and the SMA CO (2-1) image were finally smoothed to the same resolution of . We found that about 30 to 40 of the flux was lost from the BIMA CO (1-0) model which includes single dish data, due to the lack of short baselines ( m) for the SMA uv coverage. This is similar to the percentage of missing flux estimated in the SMA CO (2-1) map. We combined this simulated CO (1-0) map with our CO (2-1) map to produce a CO(2-1)/CO(1-0) brightness temperature ratio map which is shown in figure 7. The primary beam attenuation has been corrected in the CO (2-1) and CO (1-0) maps. Finally, we clipped out the pixels where the signal to noise ratio of CO(2-1)/CO(1-0) was lower than 3. The line ratio map after the primary beam correction (figure 7) reveals that the average of the line ratio on pixels in Component 3 is higher () as compared to the ratio in Component 1 (). The value of line ratio in Component 2 has a relatively large error (), as the Component 2 lies near the edge of the primary beam. These values agree with the past surveys of CO line ratios in various galaxies (e.g. Braine et al. 1993, Aalto et al. 1995). A gradiation of gas excitation consisting of warm gas in the central regions and cold gas in the outer regions can explain the difference of line ratio among the components. Such a difference of the line ratio between the inner nuclear region and the outer parts of a galaxy, has already been found; Papadopoulos and Seaquist (1998) showed the correlation between the CO(2-1)/CO(1-0) line ratio and the ratio of the source size to the beam size. The value of the line ratio in Component 3 is close to the average value of 0.9 found for the nuclear regions ( 1 kpc) of Seyfert and/or starburst galaxies (Papadopoulos and Seaquist 1998). We estimated the CO molecular gas characteristics using a LVG analysis. For a kinetic temperature of 30 K, the molecular hydrogen density of the gas on Component 1 is of the order of 100 cm-3. On the other hand, the density of the gas on Component 3 could be of the order of 1000 cm-3 or more.
4 Modeling of the gas kinematics in the central region
The significant differences of the CO(2-1)/CO(1-0) ratio and the residual velocity offsets within Component 1 and 3 may imply that the physical conditions of these two components are not the same. One possible reason for the difference may be that Component 3 is located near the center as compared with Component 1. Gas heating by the central engine or perturbation by nuclear activities could exist. Such effects would be less significant for Component 1, if it is located further out from the nucleus. We cannot say too much about Component 2 as the value of the CO(2-1)/CO(1-0) ratio is not well determined.
The velocity field of the central region in NGC 4258 has several observed characteristics; (1) There is a main velocity gradient along the major axis on Component 1 and 3, (2) The velocity contours are more tightly spaced and tilted with respected to background motions as we approach the nucleus within Component 1, and (3) There is a similar velocity gradient within Component 3 along the east-west direction. The bulk of the gas within Component 1 could be further out in the galactic disk, because the velocity pattern on Component 1 is consistent with the galactic rotation. On the other hand, the velocity offset of Component 3 from the galactic rotation is larger and it can be due to some nuclear activities close to the center.
To account for the characters of the velocity field, we propose models of expanding and warped disks. As we have shown in table 1, we used the galactic rotation with the P.A. of 160∘, the inclination of 65.6∘ and the of 456 km s-1. Figure 8 shows the isovelocity contour maps of the warped disk model, the expansion disk model, and the combined model with warped disk and the expansion. As we discuss below, the warped disk model and the combined model of expansion and warped disk in figure 8(a) and (c) are preferable to explain the velocity field.
Because the trend of gradient is same, we can conjecture that the east-west velocity gradient which extends 200 pc is related to the sub-parsec disk surrounding the central engine (Miyoshi et al. 1995, Herrenstein et al. 1999), although the east-west velocity gradient looks a solid body rotation with the angular resolution of 3′′ and does not seem to be the declining Keplerian tails of the sub-pc molecular disk. The solid rotation velocity estimated from the position-velocity diagram of figure 4 at a radius of 3′′ would be 74 km s-1, and exceeds the velocity estimated from the Keplerian rotation at the same radius (39 km s-1). If we assume that gas within Component 3 is closer to the center and that the east-west velocity gradient is due to rotation, the enclosed binding mass is estimated to be within 200 pc. This mass is similar to the enclosed mass obtained from the fitted Brandt rotation curve ( within 200 pc). Therefore, the velocity gradient along the east-west direction on Component 3 could be due to a circular motion of the gas in a different orbital plane from the galactic plane, but which aligns with the inner sub-parsec disk. However, the scenario of the two different orbital planes alone does not explain the titled velocity contours. If the major axis of the orbit warps from a P.A. of 90∘ to a P.A. of , the velocity contours close to the center would be more tightly spaced and shifted. This can explain the velocity contours of the inner edge of the Component 1 (figure 8a), The velocity gradient along the major axis of Component 1 and 3 would be due to the galactic rotation. The differences in the magnitude of the gradients could be due to the fact that these components are not at the same radial distance along the entire structure. If the gas on Component 3 is closer to the center as the line ratio suggests, the two different velocity gradients along the major axis and the east-west direction might be explained.
An alternative scenario to explain the velocity field in the center is a uniform expansion from the center of the galaxy as Plante et al. (1991) has proposed. The model can explain the angular offset of the velocity contours for Component 1 by and the velocity gradient along the east-west direction seen for Component 3. Component 1 and 3 are thought to be located front and back from the center, respectively. In the case of uniform expansion, Component 1 and 3 are on opposite sides from each other. The expansion pushes gas in front and back to blueshifted and redshifted velocity from the center, respectively. The east-west velocity gradient seen in Component 3 can be due to projection along the line of sight of radial expasion motions. It is reasonable that we see the velocity gradient mostly within Component 3 because Component 1 may be further from the center. The scenario of expansion can also support the idea that the gas closed to the center is more excited and therefore has a higher value of the line ratio CO(2-1)/CO(1-0). One problem is that the observed velocity fields show the most redshifted velocity on the eastern edge of Component 3. The velocity pattern of an expanding disk would show the most redshifted gas closer to the center (figure 8b). Thus, expansion alone does not account for the observed velocity field.
In NGC 4258, the presence of a bar has been proposed, although the proposed P.A. of the bar varies from to (e.g. van Albada and Shane 1975; van Albada 1980; Cox and Downes 1996; Cecil et al. 2000). Here we discuss the possibility that Component 1 and 3 are molecular gas produced by bar driven shocks, and that they flow in and around the bars into the periodic orbit perpendicular to the arms (e.g. Athanassoula 1992; Downes et al. 1996). Velocity gradients seen in Component 1 and 3 along the major axis are roughly consistent with the -orbit, as Cox and Downes (1996) have mentioned already. However, the bar model does not describe the velocity gradient along the east-west direction seen in Component 3. The velocity pattern of the periodic -orbit would show the most redshifted velocity in northern side of the major axis of the galaxy, and values of velocity would decrease continuously as it goes to west along the east-west direction. This is opposite to the velocity gradient in our isovelocity map. Therefore, we conclude that the CO gas does not trace the bar structure.
Here we present a combined model of the expanding warped disk. The more tightly spaced and tilted velocity contours at the inner edge of Component 1, and the east-west velocity gradient seen in Component 3 are, clearly seen in the expanding warped disk model. The main velocity gradient along the major axis of Component 1 and 3 could be due to galactic rotation. If the gas on Component 3 lies at an inner orbit, the velocity gradient along its major axis may be steeper as compared to Component 1. Thus, the expanding warped disk can more easily model all the observed characteristics of the observed velocity field (figure 8c).
5 Conclusions
We conducted SMA observations of the CO (2-1) emission toward the center of NGC 4258 with a high spatial resolution of pc. The CO (2-1) integrated intensity map is similar to that of CO (1-0) and does not show a concentrated component in its center. The line ratio map of CO(2-1)/CO(1-0) suggests that the gas within Component 3 is warmer and denser as compared with that of Component 1. This is consistent with Component 3 being close to the center of the galaxy and possibly perturbed by the central nuclear activities. CO (2-1) and CO (1-0) velocity field maps correlate well with each other, and the major feature of the observed velocity field can be explained by the rotation curve. However, the velocities in several small regions, including Component 3, deviate from this rotation curve. In order to account for the velocity field, we propose kinematical models for the rotating disk with expanding and warped features.
References
- Aalto (1995) Aalto, S., Booth, R. S., Black, J. H., Johansson, L. E. B., 1995, A&A300, 369
- Athanassoula (1992) Athanassoula, E., 1992, MNRAS, 259, 345
- Braine et al. (1993) Braine, J., Combes, F., Casoli, F., Dupraz, C., Gerin, M., Klein, U., Wielebinski, R., Brouillet, N., 1993, ApJ, 97, 887
- Brandt (1960) Brandt, J. C., 1960, ApJ, 131, 293
- Cecil et al. (1992) Cecil, G., Wilson, A.S., Tully, R.B., 1992, ApJ, 390, 365
- Cecil et al. (1995) Cecil, G., Wilson, A.S., De Pree, C., 1995, ApJ, 440, 181
- Cecil et al. (2000) Cecil, G., Greenhill, L.J., De Pree, C., Nagar, N., Wilson, A.S., Dotita, M.A., Prez-Fournon, I., Argon. A.L., Moran, J.M., 2000, ApJ, 536, 675
- Cox & Downes (1996) Cox, P., Downes, D., 1996, ApJ, 473, 219
- Daigle & Roy (2001) Daigle, A., Roy, J.-R., 2001, ApJ, 552, 144
- Downes et al. (1996) Downes, D., Reynaud, D., Solomon, P.M., Radford, S.J.E., 1996, ApJ, 461, 186
- Dutil et al. (1995) Dutil, Y., Beauchamp, D., Roy, J.-R., 1995, ApJ, 444, L85
- Ford (1986) Ford, H.C., Dahari, O., Jacoby, G.H., Crane, P.C., Ciardullo, R. 1986, ApJ, 311, L7
- Fruscione (2005) Fruscione, A., Greenhill, L.J., Filippenko, A.V., Moran, J.M., Herrnstein, J.R.,Galle, E., 2005, ApJ, 624, 103
- García-Burillo et al. (2003) García-Burillo, S.,Combes, F., Eckart, A., Tacconi, L. J., Hunt, L. K., Leon, S., Baker, A. J., Englmaier, P. P., Boone, F., Schinnerer, E., Neri, R., 2003, ASP Conf. Ser. 290, Active Galactic Nuclei: from Central Engine to Host Galaxy, ed. S. Collin, F. Combes, I. Shlosman, p. 423
- Heckman (1980) Heckman, T. M. 1980, A&A, 87, 142
- Helfer et al. (2003) Helfer, T. T., Thornley, M.D., Regan, M.W., Wong, T., Sheth, K., Vogel, S.N., Blitz, L., Bock, D. C.-J. 2003, ApJS, 145, 259
- Herrnstein et al. (1999) Herrnstein, J.R., Moran, J. M., Greenhill, L.J., Diamond, P.J., Inoue, M., Nakai, N., Miyoshi, M., Henkel, C., Riess, A., 1999, Nature, 400, 539
- Herrnstein et al. (2005) Herrnstein, J.R., Moran, J. M., Greenhill, L.J.,Trotter, A.S., 2005, ApJ, 629, 719
- Ho et al. (1997) Ho, L. C., Filippenko, A. V., Sargent, W. L. W. 1997, ApJS, 112, 391
- Ho et al. (2004) Ho, P. T. P., Moran, J. M., Lo, F., 2004, ApJ, 616, L1
- Kohno et al. (2001) Kohno, K., Matsushita, S., Vila-Vilaró, B., Okumura, S.K., Shibatsuka, T., Okiura, M., Ishizuki, S., Kawabe, R., 2001, in ASP Conf. Ser. 249, The Central Kiloparsec of Starbursts and AGN: The La Palma Connection, ed. J.H. Knapen, J. E. Beckman, I. Shlosman, T. J. Mahoney, p. 672.
- Krause et al. (1990) Krause, M., Cox, P., Garcia-Barrento, J.A., Downes, D., 1990, A&A, 223, L1
- Krause et al. (2005) Krause, M., Löhr, A., Fendt, C., Neininger, N., 2005, The Magnetized Plasma in Galaxy Evolution, Proceedings of the conference held in Kraków, Poland, Sept. 27th - Oct. 1st, 2004, Edited by K. Chyzy, K. Otmianowska-Mazur, M. Soida, and R.-J. Dettmar, Jagiellonian University, Kraków, p. 217
- Makishima et al. (1994) Makishima, K., Fujimoto, R., Ishisaki, Y., Kii, T., Loewenstein, M., Mushotzky, R., Serlemitsos, P., Sonobe, T., Tashiro, M., Yaqoob, T. 1994, PASJ, 46, L77
- Matsushita et al. (2004) Matsushita, S., Sakamoto, K., Kuo, C.-Y., Hsieh, P.-Y., D-V-Trung, Mao, R.-Q., Iono, D., Peck, A.B., Wiedner, M.C., Liu, S.-Y., Ohashi, N., Lim. J., 2004, ApJ, 616, L55
- Martin et al. (1989) Martin, P., Roy, J.-R., Noreau, L., Lo, K.Y., 1989, ApJ, 345, 707
- Miyoshi et al. (1995) Miyoshi, M., Moran, J.M., Herrnstein J.R., Greenhill, L.J., Nakai, N., Diamond, P.J., Inoue, M., 1995, Nature, 373, 127
- Papadopoulos and Seaquist (1998) Papadopoulos, P. P., Seaquist, E. R.,1998, ApJ, 492, 521
- Pietsch et al. (1994) Pietsch, W. Vogler, A. Kahabka, P. Jain, A. Klein, U., 1994, A&A, 284, 386
- Plante et al. (1991) Plante, R. L., Lo, K. Y., Roy, J.-R., Martin, P., Noreau, L., 1991, ApJ, 381, 110
- Sakamoto et al. (1999) Sakamoto, K., Okumura, S. K., Ishizuki, S., Scoville, N. Z., 1999, ApJS, 124, 403
- Sofue et al. (1989) Sofue, Y., Doi, M., Krause M., Nakai, N., Handa, T., 1989, PASJ, 41, 113
- Sofue & Vogler (2001) Sofue, Y., Vogler, A., 2001, A&A, 370, 53
- Sofue et al. (2003) Sofue, Y., Koda, J., Nakanishi, H., Onodera, S., 2003, PASJ, 55, 59
- Solomon et al. (1987) Solomon, P. M. Rivolo, A. R., Barrett, J., Yahil, A., 1987, ApJ, 319, 730
- Stauffer (1982) Stauffer, J. 1982, ApJ, 262, 66
- Turner & Ho (1994) Turner, J. L., Ho, P. T. P., 1994, ApJ, 421,122
- van Albada & Shane (1975) van Albada, G. D., Shane, W. W., 1975, ApJ, 42, 433
- van Albada (1980) van Albada, G. D., 1980, A&A, 90, 123
- van der Kruit et al. (1972) van der Kruit, P.C., Oort, J.H., Mathewson, D.S., 1972, A&A, 21, 169
- van der Kruit (1974) van der Kruit, P.C., 1974, ApJ, 192, 1
- van Moorsel & Wells (1985) van Moorsel, G.A., Wells, D.C., 1985, AJ, 90, 103
- Wilson et al. (2001) Wilson, A.S., Yang, Y., Cecil, G., 2001, ApJ, 560, 689


| Parameters | Our results | Previous results | |||
|---|---|---|---|---|---|
| CO (1-0) | Radio continuuma | Water maser | HId | H | |
| RA of center (J2000) | 12:18:57.52 | 12:18:57.50 | 12:18:57.5046b | ||
| DEC of center (J2000) | 47:18:15.98 | 47:18:14 | 47:18:14.303b | ||
| Position angle (deg.) | 160 | 150 | 146 | ||
| Inclination (deg.) | 65.6 | 72 | 64 | ||
| Vsys in Radio LSR (km s-1) | 456 | 473.5c | 450 | 467 | |