On the Anomalous Temperature Distribution of the Intergalactic Medium in the NGC 3411 Group of Galaxies***Based on observations obtained with XMM-Newton, an ESA science mission with instruments and contributions directly funded by ESA Member States and NASA
Abstract
We present XMM-Newton, Chandra and VLA observations of the USGC S152 group and its central elliptical NGC 3411. Imaging of the group X-ray halo suggests it is relaxed with little apparent structure. We investigate the temperature and metal abundance structure of the group halo, and find that while the abundance distribution is fairly typical, the temperature profile is highly unusual, showing a hot inner core surrounded by a cool shell of gas with a radius of 20-40 kpc, at the center of the larger group halo. Spectral mapping confirms an irregular ring of gas 0.15 keV cooler than its surroundings. We estimate the total mass, entropy and cooling time profiles within 200 kpc, and find that the cool shell contains 9of gas. VLA observations at 1.4, 5 and 8 GHz reveal a relatively weak nuclear radio source, with a core radio luminosity LR=2.7, and a diffuse component extended on scales of a few arcseconds (or more). A lack of evidence for activity at optical or X-ray wavelengths supports the conclusion that the central black hole is currently in a quiescent state. We discuss possible mechanisms for the formation of temperature features observed in the halo, including a previous period of AGN activity, and settling of material stripped from the halo of one of the other group member galaxies.
Subject headings:
galaxies: clusters: individual (USGC S152) — X-rays: galaxies: clusters —galaxies: individual (NGC 3411) — radio continuum: galaxies
1. Introduction
The study of structure in the gaseous halos of galaxies, groups and clusters has been greatly facilitated by the large collecting areas and high spatial resolution of the XMM-Newton and Chandra X-ray observatories. Some useful comparisons of radio, optical and X-ray structure were performed with earlier satellites (e.g., Sarazin et al., 1995; McNamara et al., 1996), but the relatively low efficiency and/or broad point spread functions (PSFs) of the instruments on ROSAT, ASCA and Einstein restricted this type of examination to the brightest sources. XMM and particularly Chandra have allowed a huge expansion in the field, showing the range and variety of disturbed structures, and demonstrating that they are relatively common. Perhaps most notable are the detailed interactions between the radio jets of active galaxies in the cores of groups and clusters and the surrounding inter-galactic medium (IGM). Long Chandra observations of M87 in the Virgo cluster (Forman et al., 2005; Churazov et al., 2001) and NGC 1275 in Perseus (Fabian et al., 2006; Sanders et al., 2004; Fabian et al., 2003) have revealed complex features indicative of shocks, bubbles of radio plasma, filaments of cooling gas and sound wave propagation. Mergers and interactions between galaxies and their environment also often produce visible structures in the IGM (e.g., Kraft et al., 2006; Mahdavi et al., 2005; Machacek et al., 2005b)
In two prior papers (O’Sullivan et al., 2005, 2003) we examined XMM-Newton observations of two poor, 2.5 keV clusters, AWM 4 and MKW 4. Both were selected to be relaxed systems without significant structure, to allow study of their radial mass and metal abundance profiles. The XMM exposures revealed that while the two systems have regular surface brightness distributions and similar total masses, they have distinctly different temperature profiles. While MKW 4 shows a central temperature decline (to 1.5 keV) similar to that seen in many groups and clusters, AWM 4 is approximately isothermal despite a central cooling time of only 5 yr. This divergence appears to be related to the active galactic nucleus (AGN) of NGC 6051, the dominant galaxy of AWM 4. Spectral mapping shows regions of hot and high abundance gas in the inner cluster halo, correlating with the AGN radio jets, suggesting that the halo is being heated by the AGN activity. The differences between the two clusters can therefore be attributed to their differing phase in the cycle of cooling and AGN activity; If cooling is allowed to continue in MKW 4 it is likely to fuel an AGN outburst in the central galaxy, while the current activity in AWM 4 is likely to halt in the near future, as heating prevents further gas cooling. The two clusters embody the extremes of the cycle, undisturbed cooling and ongoing outburst. An interesting possibility arising from this model is the observation of a system in the process of changing state from cooling to heating.
NGC 3411 is the dominant, central elliptical of a galaxy group first identified from the COSMOS catalogue of southern sky galaxies (Yentis et al., 1992). Later surveys have confirmed the existence of the group, sometime referred to as SS2b 153 or USGC S152, identifying three to five bright galaxies as members (Ramella et al., 2002; Mahdavi et al., 2000; Giuricin et al., 2000). The velocity dispersion of the group is estimated to be 211 , and the total mass of the system 2.7 . NGC 3411 is the only elliptical in the group, and the other confirmed members are 1 mag fainter in the B band. A short ROSAT All-Sky Survey (RASS) observation showed the galaxy to be at the center of an extended, regular X-ray halo (Pierre et al., 1994) with a luminosity of (Mahdavi et al., 2000). The galaxy was identified in the RASS Bright Source Catalogue (Voges et al., 1999), and comparison with the NRAO111The National Radio Astronomy Observatory is a facility of the National Science Foundation operated under cooperative agreement by Associated Universities, Inc. VLA Sky Survey (NVSS, Condon et al., 1998) showed that NGC 3411 also hosts a slightly extended radio source with a flux of 33 mJy at 1.4 GHz (Bauer et al., 2000). The galaxy has been observed as part of the 6dF Galaxy Redshift Survey (Jones et al., 2004), and has an absorption dominated optical spectrum, with no obvious signs of AGN activity.
More recently, NGC 3411 has been observed by both Chandra and XMM-Newton. Vikhlinin et al. (2005) analysed the Chandra data as part of a sample of 13 nearby relaxed clusters, and briefly noted that it did not have a strong central temperature decrement, perhaps indicating a recent AGN outburst or stellar winds from the central elliptical. Mahdavi et al. (2005) included the XMM dataset as part of their study of eight RASSCALS groups and found the group halo to be remarkably circular. They also noted that the gas pressure within 10 kpc was a factor of 2 higher than expected from self-similar scaling, possibly because of gas bound to the central galaxy.
In this paper, we use XMM-Newton, Chandra and Very Large Array (VLA) observations to study the properties of the group and specifically to look for signs of interaction between the central galaxy and the group X-ray halo. Section 2 describes the observations and their reduction and section 3 our analysis of the data and our main results. These are discussed in section 4 and we summarise our conclusions in section 5. Throughout the paper we assume =70 and normalize optical and near infra-red luminosities to the absolute B and K band magnitudes of the sun, MK⊙=3.37 and MB⊙=5.48 (equivalent to =5.2 ). Abundances are measured relative to the abundance ratios of Grevesse & Sauval (1998). Some details of the location and scale of NGC 3411 are given in Table 1.
| R.A. (J2000) | 10h50m26.1s |
|---|---|
| Dec. (J2000) | -12d50m42.3s |
| Redshift | 0.01527 |
| Distance (=70) | 65.4 |
| 1 arcmin = | 19 kpc |
| radius = | 19.4 kpc |
| log () | 10.66 |
| log () | 11.41 |
| log () | 42.51 |
Note. — is the unabsorbed 0.4-7.0 keV X-ray luminosity within 662.5′′ (210 kpc), taken from our own spectral fits
2. Observations and Data Analysis
2.1. XMM-Newton data
The NGC 3411 group was observed with XMM-Newton during orbit 555 (2002 December 20-21) for just under 36,000 seconds (ObsID 0146510301). The EPIC instruments were operated in full frame mode, with the thin optical blocking filter. A detailed summary of the XMM-Newton mission and instrumentation can be found in Jansen et al. (2001, and references therein). Reduction and analysis were performed using techniques similar to those described in O’Sullivan et al. (2005). The raw data from the EPIC instruments were processed with the most recent version of the XMM-Newton Science Analysis System (sas v.6.5.0), using the epchain and emchain tasks. Bad pixels and columns were identified and removed, and the events lists filtered to include only those events with FLAG = 0 and patterns 0-12 (for the MOS cameras) or 0-4 (for the PN). The total count rate for the field revealed a short background flare in the second half of the observation. Times when the total count rate deviated from the mean by more than 3 were therefore excluded. The effective exposure times for the MOS and PN cameras were 22.2 and 19.2 ksec respectively.
Images and spectra were extracted from the cleaned events lists with the sas task evselect. Response files were generated using the sas tasks rmfgen and arfgen. Because the group is relatively X-ray bright, and the PN detector mode uses a short frame integration time (73 ms), there are a significant number of out-of-time (OOT) events, visible in the PN data as a trail extending from the center of the source toward the CCD readout. An OOT events list was created using epchain, and scaled by 0.063 to allow statistical subtraction of the OOT events from spectra and images. Point sources were identified using a sliding cell algorithm, and all data within 17′′ of point sources were removed.
Creation of background images and spectra for the system was hampered by the fact that the group X-ray halo extends beyond the field of view. Use of the “double-subtraction” technique (Arnaud et al., 2002; Pratt et al., 2001) involves correcting blank-sky exposures to match a source-free area of the observation; for NGC 3411 this is not feasible. We therefore decided to consider the background as two separate components. The background contribution from high-energy particles can be estimated based on events which are detected outside the field of view. Particles-only datasets, made up of exposures taken with the telescope shutters closed (Marty et al., 2003), were scaled to match these events and used as basis of the background. The particle component dominates the continuum at high energies and produces a number of strong spectral lines, which vary across the field of view. The particles-only datasets contain these features, and subtraction of the scaled data from regions matching those used in the source data removes them satisfactorily.
The low energy background arises primarily from soft X-rays emitted by hot gas in the galaxy, and from coronal emission associated with solar wind interactions. This component can be modelled as a cool plasma extending uniformly over the field of view. Trial fitting of spectra extracted in the outer part of the field of view, and of a ROSAT All-Sky Survey spectrum extracted from an annulus at 1.5-2.0∘ from the group center showed that a 0.2 keV, solar abundance plasma model provided an acceptable fit. The variation of the soft contribution across the field of view can then be calculated based on a soft energy exposure map, or via the spectral response matrices. We add this plasma model as an additional component in our spectral fits, with all components frozen. For surface brightness fitting, an exposure map image scaled to match the plasma model contribution is added to the particles-only background image. We note that this may be a rather simple model for the fairly complex soft background, and ignores issues of small scale variation in the background. However, the group halo is relatively bright and contributes the majority of soft counts at all radii, so variations in the soft background have a relatively minimal impact.
2.2. Chandra data
NGC 3411 was observed with the ACIS instrument during Chandra Cycle 3, on 2002 November 5-6 (Obs ID 3243). A summary of the Chandra mission and instrumentation can be found in Weisskopf et al. (2002). The S3 chip was placed at the focus of the telescope in order to take advantage of the enhanced sensitivity of the back illuminated CCDs at low energies. The instrument operated in very faint mode, and observed the target for just under 30 ksec. Reduction and analysis was performed using methods similar to those described in O’Sullivan & Ponman (2004). The level 1 events file was reprocessed using ciao v3.2 and caldb v3.2.0. Bad pixels and events with ASCA grades 1, 5 and 7 were removed. The data were corrected to the appropriate gain map, the standard time-dependent gain correction was made, and a background light curve was produced. Background flaring occurred through the first early part of the observation, and all periods where the count rate deviated from the mean by more than 3 were excluded, so as to prevent contamination. The exposure time of the observation after cleaning was 18.3 ksec. We chose to use only data from the S3 chip, as the decline in effective area and broadening Point spread Function (PSF) on the more distant chips made data extracted from them less useful than those available from XMM-Newton.
Point sources were identified using the ciao task wavdetect, with a detection threshold of 10-6, chosen to ensure that the task detects 1 false source in the field. Source ellipses were generated with axes of length 4 times the standard deviation of each source distribution, and regions of twice this size were removed from the data before further analysis. A source was detected coincident with the peak of the diffuse X-ray emission; this was considered a potentially false detection and ignored, though we did later test for the presence of a central X-ray point source. Images and spectra were extracted from the resulting “clean” events list and appropriate weighted spectral response matrices were generated using the mkwarf and mkwrmf.
Background estimation for spectral fitting was performed in an analogous manner to that described above for the XMM-Newton data. The blank-sky datasets available as part of the Chandra caldb were used to subtract the high energy background. Spectra extracted from the blank-sky events list, scaled to match the numbers of counts in PHA channels 2500-3000 in the source data, were used as the basis of the background. Examination of spectra from various radii shows that the blank-sky data matches the high energy continuum and instrumental line features in the source data well. A 0.2 keV plasma model was included in the spectral fits to account for any galactic emission not found in the blank-sky data, but testing showed that this had little impact on the fits. The halo of NGC 3411 completely dominates the soft emission within the S3 field of view.
2.3. VLA data
As mentioned in Section 1, archival NVSS data shows a slightly extended radio source coincident with the centre of NGC 3411. In order to improve on the spatial resolution of these data, NGC 3411 was further observed twice with the VLA. Details of the observations are given in Table 2. The data were reduced in a standard fashion using AIPS. Because of the low intensity of the sources, no self-cal was performed and no polarization maps were made. The flux calibrator was 3C286 (observed twice during each run) and the phase calibrator was J1039-156. The final maps were made with IMAGR. For the 1.4 GHz data, it was necessary to make a tapered map of a large area to locate sources far from the field center in order to include them in the final cleaning process. Flux densities were measured using IMEAN and IMFIT, the latter task also providing deconvolved source sizes for two dimensional Gaussian fits. The results of our analysis of the VLA data are discussed in Section 3.5.
| Freq. | Date | Array | texp | r.m.s. | Beam Size | P.A. | Program |
|---|---|---|---|---|---|---|---|
| (GHz) | (mJy) | (′′) | (∘) | ||||
| 8.46 | 2005Sep04 | C | 1h6m | 0.029 | 4.12.8 | 8.6 | AO196 |
| 4.86 | 2006Feb15 | A | 3h1m | 0.016 | 0.660.43 | 3.0 | AO202 |
| 1.425 | 2006Feb15 | A | 2h24m | 0.044 | 2.31.6 | -2.4 | AO202 |
3. Results
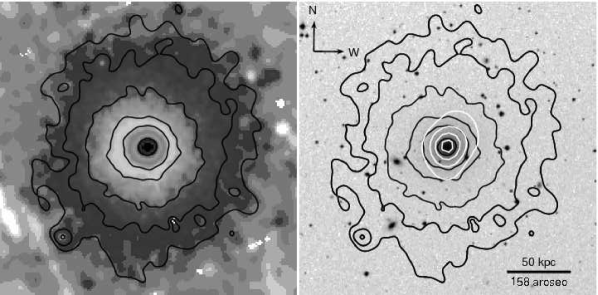
Figure 1 shows a Digitized Sky Survey (DSS) optical image of NGC 3411 with smoothed XMM-Newton X-ray contours overlaid. The contours were taken from an adaptively smoothed mosaiced image combining data from all three XMM EPIC cameras. Smoothing was performed with the sas asmooth task, with smoothing scales chosen to achieve a signal-to-noise ratio of 10. The X-ray halo extends well beyond the field of this image, and appears to be roughly circular at all radii. Examination of smoothed and unsmoothed XMM and Chandra images suggests that in general the group halo relatively relaxed, with no major substructure. We see no areas of enhanced or decreased surface brightness, or steep surface brightness gradients, such as those associated with shocks, cavities or cold fronts.
3.1. Surface brightness modeling

We initially fitted 1-dimensional azimuthally averaged radial surface brightness profiles. 0.3-3.0 keV images were extracted for the EPIC instruments and the ACIS-S3 chip, and appropriate exposure maps generated. The XMM images ere binned to the physical pixel scale of the PN camera (4.4′′), and the Chandra image to the pixel size of the ACIS CCDs (0.492′′). The PN image was corrected for OOT events. Radial profiles were then extracted, using annuli of width 2 pixels (i.e. , 8.8′′) for XMM and 2-60 pixels (1-27′′), increasing with radius, for Chandra. The XMM profiles extend to a radius of 11′, the Chandra profile to 4.3′. PSF images for PN and MOS cameras were extracted from the calibration archive. Prior experience has shown that PSF convolution is necessary for accurate fitting of XMM-Newton data, but has little effect on Chandra surface brightness fits, owing to the very narrow Chandra PSF. We therefore chose to include PSF convolution in the XMM fitting, but excluded it from the Chandra fits. The XMM-Newton images were summed to create a single radial profile as were profiles taken from the PSF images. Using these data, we found that our background models and exposure correction provided a good match to the data, to the limits of the profiles. Figure 2 shows the resulting surface brightness profiles.
Fitting was carried out in ciao sherpa, and tests were made fitting the two profiles individually. The XMM profile clearly extends far enough to reach the background level, which is modelled by a constant component which is unnecessary in the Chandra fits. A single beta model proved a poor fit to both profiles, with clear deviations from the data at large and small radii, particularly in the XMM data. Many groups have surface brightness profiles which require more than one beta model to produce a good fit (e.g. Helsdon & Ponman, 2000). This usually indicates an extra component of emission, for example a galaxy halo or cooling flow embedded within a larger group halo. We therefore fitted a second beta model, which provided a visibly improved fit to the XMM profile. The second component provides a slight increase in surface brightness to match a “bulge” in the profile at 100′′, and a somewhat steeper slope beyond 300′′. The model was a good fit to the Chandra profile outside 10′′, but underestimated the central surface brightness significantly (see panels a and c of Fig. 2). Table 3 gives details of this model, which was fitted to the XMM profile only (a goodness of fit for the Chandra data is given for comparison, but the model was not fitted to the Chandra data). The residual emission is clearly more extended than would be expected for a point source, and a model including a central point source did not provide a good fit to the central region.
Addition of a third beta model did provide a good fit to the central region of the Chandra profile, but simultaneous fitting of both datasets showed that this model overestimated the central surface brightness of the XMM profile by 25 per cent. This disagreement seems most likely to be related to the broad XMM PSF, which will act to reduce the peak surface brightness of the EPIC images. However, the inclusion of PSF convolution in the fit might be expected to correct this issue. We use monoenergetic (1 keV) PSF images to create our PSF model, and it is possible that this introduces some error in the convolution, though we would not expect it to be noticeable. It is also possible that the sherpa convolution algorithm is imperfect, though testing shows that convolution of a delta function with the PSF model reproduces the PSF to reasonable accuracy. In order to test whether the 2-D PSF convolution is more accurate that 1-D, we performed a 2-D fit to the XMM data using a circular model based on the Chandra 1-D fit with normalization free to vary. We again find that the model overestimates the data, though in this case there is a possibility that the slight ellipticity of the halo produces a fit which is a close match to the data at moderate radii but poorer in the core. However, it does not appear that fitting in 2-D resolves the problem, suggesting that the 1-D PSF convolution is not causing the difference. The differing energy responses of the telescopes and detectors should be accounted for by the exposure maps. In any case, the difference is relatively minor, affecting only the central XMM bin.
| 2- | 3- | |
|---|---|---|
| (′′) | 11.82 | 15.44 |
| (′′) | 147.37 | 206.04 |
| (′′) | - | 2.46 |
| 0.59 | 0.56 | |
| 0.88 | 1.09 | |
| - | 0.60 | |
| red. | (0.429/30.561) 7.307 | (0.983/3.934) 1.486 |
| d.o.f. | (68/22) 96 | (66/19) 94 |
Note. — Values for reduced and degrees of freedom of the fits are given in the format “(XMM/Chandra) total”, so as to allow comparison of the quality of fit between instruments. Note that the 2- model was fitted only to the XMM data, while the 3- model was fitted to both datasets simultaneously.
We also perform 2-dimensional image fitting to the two datasets, in order to test for the presence and effects of elliptical components. Simultaneous fits were performed using the three XMM images described above, and background images constructed using the method discussed in Section 2. Exposure maps were used to model the instrumental response, and models were convolved with the appropriate PSF images. As numerous image pixels contained few or zero counts, we used the xspec implementation of the Cash maximum likelihood statistic (Cash, 1979) in sherpa. We note that this statistic does not provide a true measure of the absolute goodness of fits, and we therefore judge the quality of fits by inspection of radial profiles and residual images, as well as the fit statistic.
Fitting to the XMM images, we again find that a single beta model is an inadequate description of the data, overestimating the central surface brightness and underestimating it between at 80-150′′. A two-beta model provides a reasonable fit to the data. The centrally dominant component has a slightly smaller core radius than that found in the 1-D fits, but a very similar slope (Rcore=6.91′′, =0.54, 1 uncertainties). The outer component is more divergent, with a smaller core radius (Rcore=85.59′′) and corresponding flatter slope (=0.64). Both components are mildly elliptical (=0.19, =0.15), though the outer component is poorly constrained, and consistent with zero ellipticity. The two components have slightly offset centers, but only by 2 image pixels, well within the size of the PSF. In general the model appears to be a good fit to the images, with the mild ellipticity trading off with the slope of the outer component.
3.2. Spectral fits
Most relaxed gaseous halos have temperature and abundance structures which vary smoothly with radius. As NGC 3411 is roughly circular in projection, circular annuli were used to extract spectra from the XMM EPIC and Chandra datasets. Appropriate response files were created, as well as background spectra as described in Section 2. Spectral regions were chosen to ensure at least 8000 source counts in each bin. As expected given the differences in collecting area, this produced rather narrower bins in the XMM-Newton data than in Chandra. Data from the two satellites were fitted independently, for this reason and to allow the two to act as a check upon each other. Counts at energies lower than 0.4 keV or higher than 7.0 keV were ignored, as the low energy response of some of the instruments is questionable, and energies higher than 7.0 keV tend to be dominated by cosmic and particle background emission, and fluorescence lines within the detectors. The hydrogen column of our models was held at the galactic value (4.43 cm-2) in all fits. Spectra were grouped to 20 counts per bin. The spectra were initially examined and fit by hand using xspec v11.3.2p and were found to be acceptably described by single temperature APEC plasma models (Smith et al., 2001).
As group halos are extended along the line of sight as well as in the plane of the sky, and spectral properties are expected to vary with true rather than projected radius from the group center, we perform a deprojection analysis. Using two parallel scripts, one based on the xspec projct model and another written using sherpa, we fit the Chandra and XMM-Newton spectra and find the temperature and abundance profiles shown in Figure 3. The two scripts produced almost identical results, suggesting that the fits are robust. The abundance profile is simple, declining from a central peak to low values at large radii, as expected. The temperature profile is more complex. Typically, relaxed groups have temperature profiles with a central cool region, a peak at moderate radii, and a decline to lower temperatures in the outer halo (see e.g., MKW 4, O’Sullivan et al., 2003). The NGC 3411 profile follows this pattern at radii 60′′, but inside this radius the temperature is higher than expected. The profile suggests that the group has a hot core, surrounded by a shell of cool gas, in turn surrounded by hotter gas whose temperature slowly declines with radius.
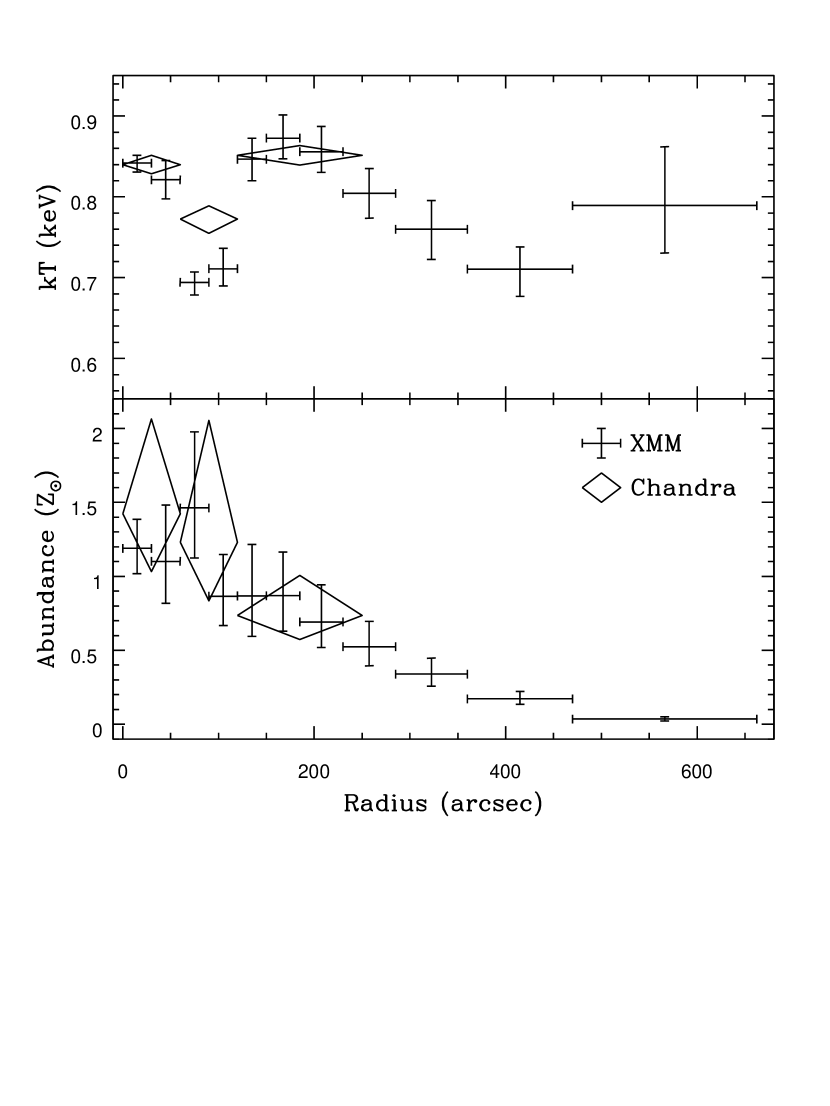
The radius of the cool shell, 60-120′′, corresponds well with the “bulge” seen in the surface brightness profiles in Section 3.1. We would expect the cooler gas of the shell to be slightly more luminous than the warmer gas surrounding it if it is in pressure equilibrium, so this is the likely cause of the excess surface brightness. While the difference between minimum and maximum temperature is small, 0.15 keV for the XMM-Newton data, it is statistically significant; for the Chandra profile, the temperature difference between bins 1 and 2 is 3.4 significant, and between 2 and 3, 3.9 significant; for the XMM profile, bins 2 and 3 are different at the 4.75 level and bins 4 and 5 are different at the 3.7 level. It is notable that there is a disagreement between the Chandra and XMM profiles as to the temperature of the cool shell. It seems likely that this arises due to the rather broad bins of the Chandra profile and the lack of data points at radii beyond 230′′. Deprojection uses the outer bins to estimate the contribution of emission at large radii, in the line of sight, to spectra at smaller projected radii, and then correct for it. Inaccuracies in fitting at large radii are therefore propagated inwards; if the fitted temperature in a bin is too high, it is likely to lower the temperatures of the bins at smaller radii. In this case, the outermost Chandra bin is broad and probably contains some variation in temperature and abundance which is then approximated, but not completely described, by the fitted model. The bin will also contain some cool emission from outer shells which may affect the fit, lowering the temperature. This could potentially lead to an underestimate of the temperature in bin 3, an undersubtraction of hard emission and therefore a higher temperature in bin 2. In any case, the fact that bins 3 and 4 of the XMM profile agree with one another suggests that the disagreement is likely to be an issue with the Chandra analysis, and that the XMM measurements are more likely to be correct.
To test the robustness of the temperature measurements in the inner region we froze the contributions from the outer bins and fitted a range of models instead of the simple single temperature plasma used in the deprojection. For the two central XMM bins, we tested two temperature plasma models, plasma models with elemental abundances free to vary, and combinations of plasma and powerlaw models. In both bins, two temperature plasma models improve the fits, but do not lower the temperature of the main spectral component. The secondary components have temperatures kT=1.72 keV and 1.66 keV, and contribute 6 and 5 per cent of the total flux. Freeing elemental abundances again improves the fit without significantly altering the primary temperature, but does not produce a well constrained fit. Fits to bins 3 and 4 of the XMM profile are not improved by additional spectral components. We also tried fitting using the xspec xmmpsf model, which corrects for the scattering of photons between spectral bins by the broad XMM PSF. Inclusion of the model introduced instabilities in the abundance profile, with poor fits in the outer bins leading to a “ringing” effect wherein bins had alternately high and low abundances. Freezing abundance at the values shown in Figure 3 for the four outer bins produced a more stable fit. The resulting temperature profile was very similar to that produced without the xmmpsf model, with differences in each bin smaller than the uncertainty, and estimated uncertainties of the temperatures increasing by 5-10 per cent. This suggests that the width of our spectral bins is sufficient to make the spectra relatively insensitive to PSF scattering, which will be dominated by photons scattered outward from the high surface brightness inner regions. We therefore believe that our deprojected temperature profile is robust and reliable.
3.2.1 AGN contribution
Freezing the model fits to the outer bins in the deprojected profile, we are able to test whether the central bin supports the inclusion of a powerlaw component. There will be some powerlaw contribution from X-ray binaries within NGC 3411; from the LX,dscr: relation of Kim & Fabbiano (2004a), we expect LX,dscr=5.1. In both XMM and Chandra data the addition of powerlaw component produces only a small improvement in the fit. A second plasma component produces a more significant improvement (e.g., reduced =1.26 for 111 d.o.f., compared to 1.52/112 for the powerlaw in the Chandra data). The powerlaw models are poorly constrained, and in the Chandra fit the emission measure is consistent with zero, within the 90% uncertainties. The total powerlaw flux estimated from the XMM (Chandra) fit is 3.17 (6.45) , which after subtraction of the expected flux from X-ray binaries, gives an AGN luminosity of =1.11 (2.79) .
As a further test, we extracted the projected Chandra spectrum from a 5′′ radius circle positioned at the galaxy center. Fitting an APEC+powerlaw model, we find a powerlaw flux of 3.16. However, an APEC model with variable O, Si, S and Fe provides a superior fit to the data (red. =1.308 for 46 d.o.f. compared to 1.572/48 d.o.f.).
As a final check we created 5.0-10.0 keV images for the three XMM cameras and Chandra, and examined the area surrounding the radio source in the optical centre of NGC 3411. No obvious source is visible in any of the images. The Chandra PSF is small enough that even at 8 keV we would expect 75% of photons from a point source to be grouped within 1′′ of the source position. The contribution from X-ray binaries or from the cosmic background is negligible over such a small area. No counts were found within 2.5′′ of the peak of the radio emission. A 3 upper limit on the emission from the AGN is equivalent to 10 counts , or 6.2 in the 0.4-7.0 keV band. This places a firm limit on the maximum X-ray luminosity of the AGN. The XMM PSF is broader, so we use regions similar to those chosen for spectral extraction. Comparing the number of counts in a region of 30′′ radius to those in a background region at 90-120′′, we find no statistically significant differences in the EPIC MOS images. The EPIC PN, which has the deepest exposure, has a marginally significant (3.0) excess, with 21.28.7 more counts than would be expected. If we assume a powerlaw model with =1.65, this corresponds to a luminosity of 3.21040in the 0.4-7.0 keV band, with a 3 upper limit of 7.11040. This is comparable to the flux expected from X-ray binaries for the galaxy as a whole. We therefore consider the AGN to have a maximum X-ray luminosity of 61040, and that its true luminosity is likely considerably lower.
3.2.2 Elemental abundances
Allowing individual elemental abundances to vary freely in the deprojected fits produced poorly constrained results with large uncertainties, even when larger bin sizes and higher quality spectra were used. We therefore chose to fit the projected elemental abundance profiles. For the central six bins, two-temperature plasma models were found to be required to achieve an acceptable fit. For the outer two bins only a single temperature model was required. Figure 4 shows the resulting profiles for 0, Si, S and Fe. The abundance of all four elements peaks in the core, Fe having the highest abundance. Fe and Si appear to decline slowly with radius, tracing enrichment of the gas. S and O show a central peak with fairly flat (though poorly constrained) abundance profiles at larger radius, with O having the lowest central abundance of the four elements measured. The general decline with radius is similar to that seen in poor clusters (e.g. Tamura et al., 2004), as is the lower O abundance. Fewer groups have published elemental abundance profiles. Similar abundance gradients and relative O abundances are found in NGC 5044 (Buote et al., 2003) and HCG 62 (Morita et al., 2006). The slightly hotter (1.5 keV) systems NGC 1399 and NGC 507 also show strong central abundance peaks and declines in both Fe and Si (Buote, 2002; Kim & Fabbiano, 2004b), although in NGC 507 generally higher abundances are reported (3 in the centre, dropping to 0.7 at 80 kpc). Based on the available data, we conclude that the metallicities we measure are not unusual for a 1 keV system such as NGC 3411.

3.3. Spectral maps
Variations of spectral properties which are not azimuthally symmetric require a more complex spectral analysis than that described above. To look for such variations, we created 2-dimensional spectral maps of the inner halo of NGC 3411 using the techniques described in O’Sullivan et al. (2005). The mapping process can be summarized as follows. A grid of square regions is defined, covering the area of interest, each of which will be a pixel of the final map. Square spectral regions are defined, centered on each map pixel, and their size is allowed to vary so that each contains a minimum number of counts. Pixels whose spectral region would be above a fixed maximum size are excluded from the map. For maps of XMM data, the most recent “canned” responses are used, the software selecting the most appropriate response files for each region. For maps based on Chandra, a grid of response matrices is produced for the map. The spectra are fitted in isis v1.3.0, and resulting parameter values (or uncertainties) entered in the corresponding map pixel to create a map showing the variation of that parameter across the field.
For the maps of NGC 3411, we chose to use 6.4′′ pixels (i.e. each pixel is a 6.46.4′′ square) in the XMM maps and 6.9′′ in the Chandra maps. The initial pixel grids were square, containing 4096 pixels, though a number were removed due to lack of counts. Each spectrum was required to have at least 800 counts, and spectra were grouped to 30 counts per bin. The spectral extraction regions varied in size from 8-60′′ for XMM and 8.55-64′′ for Chandra. It might be expected that the XMM data, which has a factor 3.4 more counts, would produce significantly smaller box sizes than the Chandra data. The broader XMM PSF prevents this, by blurring the surface brightness peak; the Chandra data have fewer total counts, but a higher central surface brightness. However, while the XMM data have a larger number of spectral extraction regions of the smallest size. The fact that the spectral extraction regions are larger than the map pixels means that spectral fits are not independent; all spectral regions overlap to some degree. However, experience with spectral maps of other systems (O’Sullivan et al., 2005; O’Sullivan & Ponman, 2004) has shown that this technique does a surprisingly good job of identifying temperature and abundance structures which may be on smaller scales than the spectral extraction regions.
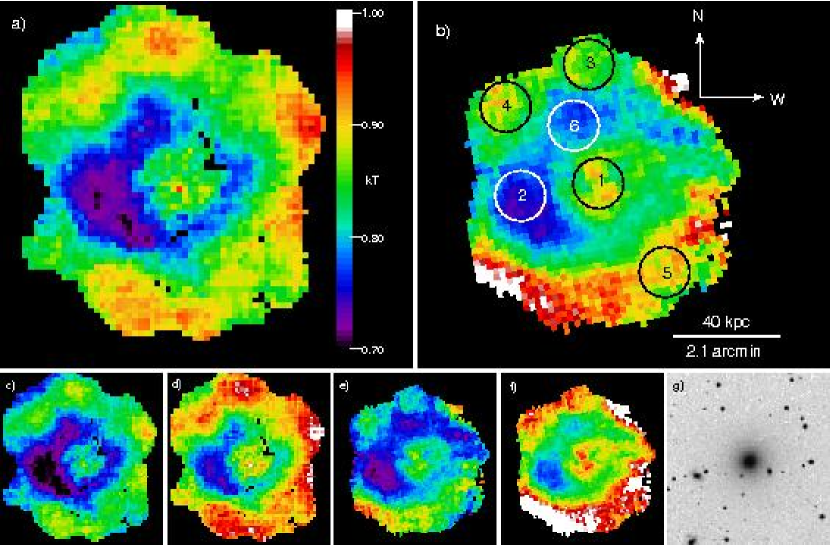
Figure 5 shows temperature maps based on XMM-Newton and Chandra data, in which a number of important features are visible. Most obvious is that the maps can be divided in to three regions; a central roughly circular warm core, surrounded by a more elliptical area of cooler gas, which is in turn surrounded by warmer gas at the edge of the maps. The temperature differences between these regions are relatively small, perhaps 0.15 keV, but are certainly 90% significant. Comparison of these regions to the radial temperature profiles discussed in Section 3.2 shows that the map temperatures correspond closely to the higher quality spectra extracted from the radial bins.
Abundances were allowed to vary freely in the spectral fits to each map pixel, but were not well constrained, and no clear structures were found in the abundance distribution. Individual fits produced typical values of 0.3-1.0. The poor constraints are unsurprising given the small numbers of counts used in the spectra. In order to check the accuracy of the map, we chose several 30′′ radius circular regions of relatively constant temperature, shown in Figure 5. Spectra from these regions were extracted and fitted as described in Section 3.2. A comparison of the fitted temperatures to those in the map is shown in Table 4. The two sets of temperatures are very similar, and we therefore conclude that the maps are an accurate and reliable guide to the temperature structure of the inner halo.
| Region | kT (keV) | Map kT (keV) | ||
|---|---|---|---|---|
| XMM | Chandra | XMM | Chandra | |
| 1 | 0.840.004 | 0.840.01 | 0.81-0.95 | 0.81-0.91 |
| 2 | 0.740.02 | 0.730.03 | 0.70-0.75 | 0.73-0.79 |
| 3 | 0.940.05 | 0.88 | 0.84-0.94 | 0.82-0.89 |
| 4 | 0.88 | 0.87 | 0.84-0.92 | 0.82-0.92 |
| 5 | 0.880.05 | 0.890.06 | 0.84-0.91 | 0.84-0.92 |
| 6 | 0.750.01 | 0.750.03 | 0.73-0.80 | 0.76-0.82 |
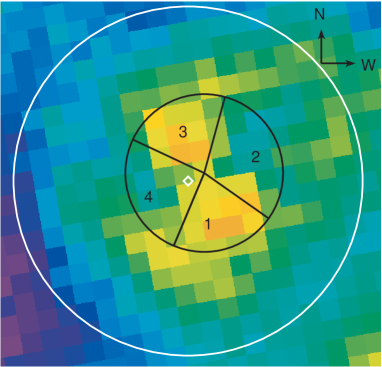
One notable difference between the Chandra and XMM maps is the degree of structure within the central hot core. The XMM map suggests that the temperature in the central 1′ is fairly constant. The Chandra map appears to show hotter regions to north and south, with cooler gas to the east and west, and the uncertainties on the map temperatures are small, suggesting that these features may be significant. Figure 6 shows an expanded view of this region of the Chandra map, with the contour and optical centre of NGC 3411 marked for comparison. To test the significance of the temperature differences, we extracted spectra from four sector regions, marked in Figure 6, chosen to approximately cover the two hotter (1 and 3) and cooler (2 and 4) regions. Spectral fitting confirmed small but significant differences in fitted temperatures between the regions. Using single spectra for each pair of regions, to maximize the signal-to-noise ratio of the data, we find a 4.5 significant difference of 0.07 keV. Similar fitting of the XMM data does not show any significant difference; however, the features in question are of comparable size to the XMM PSF (20′′ across) and it seems likely that the higher resolution of Chandra may be allowing us to detect features which are blurred out by XMM.
3.4. Mass analysis
Given the measured temperature and surface brightness profiles, it is possible to estimate a number of other properties of the gas halo, including the density, gas mass, entropy and cooling time profiles. Gas density can be estimated from the measured profiles and normalized to reproduce the X-ray luminosity of the group. The total mass profile can then be estimated from the density and temperature profiles using the well-known equation for hydrostatic equilibrium
| (1) |
A simplified definition of entropy, ignoring logarithms and constants, is used
| (2) |
Uncertainties on the derived parameters are estimated using a Monte-Carlo technique. The known uncertainties on the temperature and surface brightness models and the total luminosity are used to randomly vary the input parameters, and 10000 realizations of the derived parameter profiles generated. These are then used to estimate the 1 uncertainty on each parameter at any given radius.
The main issue which arises in these calculations is the question of how well the temperature profile can be modelled. A range of models is available, but the unusual temperature profile of the group makes an accurate fit difficult. Specifically, no model produces an acceptable description of both the cool shell and central peak. We therefore fit two separate models, both of which reproduce the temperature profile from 120′′ outward. In one we ignore the cool shell, fitting a model similar to the universal cluster temperature profile described by Allen et al. (2001), with a central high temperature, outer low temperature and a gradient in between. In the second (which we will refer to as the cool core model), an extra term is added to the model, allowing a central decline in temperature, which matches the cool shell but ignores the central two temperature bins. Each model is used to generate a set of mass, entropy and cooling time profiles, and these can be compared to examine the differing effect of the different models.
For the mass-to-light profile, a deprojected optical luminosity profile of NGC 3411 is calculated, using an approximation to a 3-dimensional de Vaucouleurs density profile (Mellier & Mathez, 1987). An effective radius of ′′ is assumed (Faber et al., 1989) and the profile is normalized to match the total B band luminosity of the galaxy.
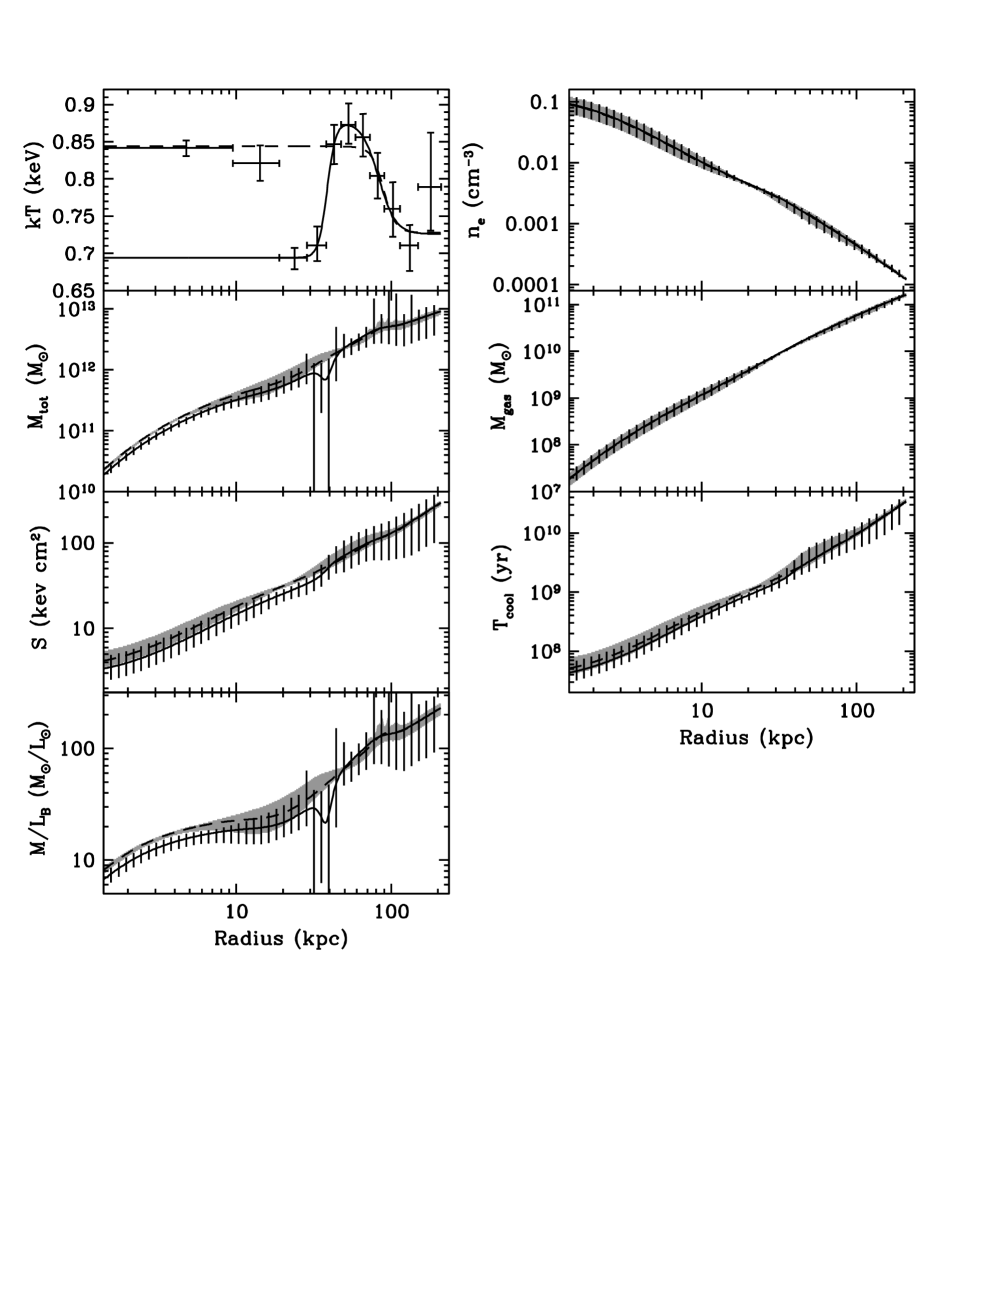
Figure 7 shows the resulting profiles. As would be expected, the density and gas mass profiles are almost unaffected by the choice of temperature model. Entropy and cooling time show only minor differences, the cool core model producing slightly lower values but larger uncertainties so that the two profiles are generally quite comparable. A number of the parameters of the cool core temperature model have correlated errors, and this increases the uncertainty on the derived mass profile, particularly at large radii. The main difference occurs in the total mass profile. At the point where the temperature begins to fall in the cool core model, a dip is visible in the total mass profile. This is of course unphysical; total mass cannot decline with increasing radius, as this would require the presence of material with negative mass. The dip is produced by the very steep gradient in T at this point. This may indicate that the sharp gradient is a product of the bin size we have used, and that were we able to use a higher resolution temperature profile the gradient would be somewhat reduced. Alternatively it may indicate a deficiency in our surface brightness model, as a steeper surface brightness gradient at that radius would counter the temperature decline. However, it seems unlikely that either of these factors could affect the mass profile enough to prevent the unphysical dip in total mass. A third possibility is that our assumptions about the gas are incorrect. We find little evidence for multi-phase gas at this radius, so the most likely cause is that the gas is not in hydrostatic equilibrium. Calculating the mean enclosed mass directly from the temperature and normalisation of the spectra in bins 4 and 5 we find that M(r) does indeed rise with radius. However, the bins are too broad to rule out some deviation from hydrostatic equilibrium on small scales. Nonetheless, apart from the region immediately around this feature, both total mass and mass-to-light ratio (M/L) profiles are quite similar, within the uncertainties, and both have physically realistic values.
3.5. Radio structure
Images from our three VLA observations are shown in Figure 8. The peak of the radio emission corresponds closely to both the peak of the X-ray halo and the optical centre of NGC 3411. The NVSS data (see Figure 1) show a resolved source with extensions to the south and north-west on a 1′ scale. Our observations provide much higher spatial resolution, and show details of the structures in the centre of the NVSS source. Both the 5 GHz and 1.4 GHz data show a resolved nuclear source, with a region of low surface brightness emission extending 5′′ to the north-east in the 1.4 GHz image. The beam size of the 8 GHz data is a little too large to resolve the core, but again there is evidence of a central peak and some extension to the north-east.
| Frequency | R.A. | Dec. | FWHM | P.A. | Peak flux density | Integrated Flux Density |
|---|---|---|---|---|---|---|
| (GHz) | (′′) | (∘) | (mJy/beam) | (mJy) | ||
| 1.4 | 10 50 26.09 | -12 50 42.2 | 1.510.051.430.06 | 123 | 5.070.15 | 8.270.25 |
| 5 | 10 50 26.08 | -12 50 42.3 | 0.12 | 31 | 2.180.07 | 2.190.07 |
| - | 10 50 26.10 | -12 50 42.4 | 1.70 | 91 | 0.160.03 | 1.520.29 |
| 8 | - | - | 2.1 | 615 | 1.5 | 1.8 |
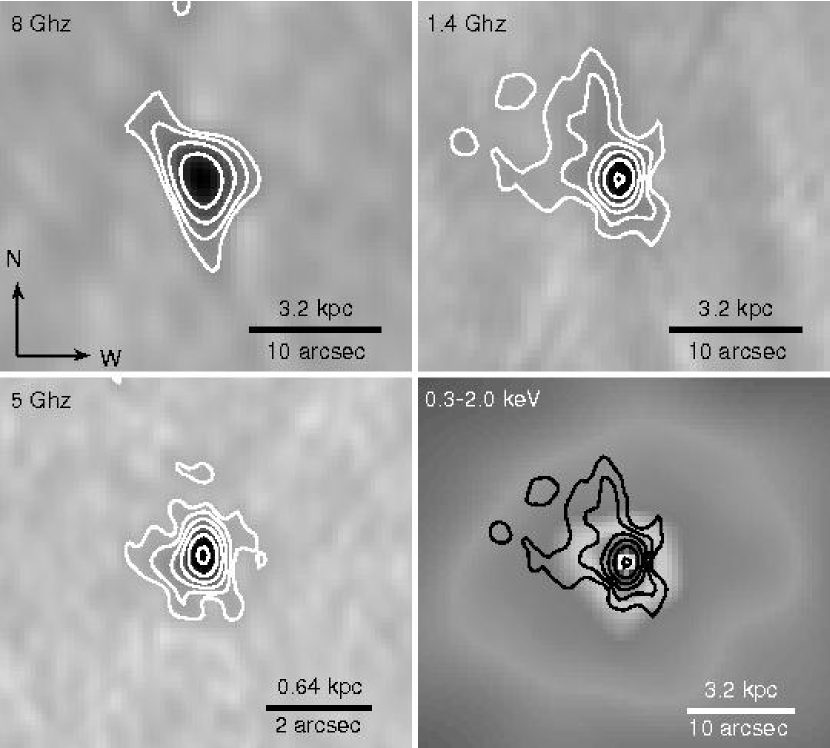
Using the aips imfit task, we fitted Gaussian models to the nuclear source visible in the 1.4 and 5 GHz images, and the best-fit parameters of these models can be found in Table 5. For the 5 GHz image, a single Gaussian was found to produce a poor fit, and a second component was added. The more extended component at 5 GHz appears to correspond fairly well with the 1.4 GHz model, both having similar extent and rather poorly defined position angles. A Gaussian model was also fit to the 8 GHz data, but was not as well constrained. Based on the 1.4 and 5 GHz fluxes, the nuclear source has a spectral index =0.630.07, and a total luminosity, integrated between 10 MHz and 10 GHz, of LR=2.7 .
The diffuse emission seen in the 1.4 GHz image has an integrated flux of 5.2 mJy, giving a total flux of 13.5 mJy. This is somewhat lower than the NVSS estimate of total flux, S1.4GHz=33 mJy, which may indicate that there is larger scale diffuse, low surface brightness emission which is not detected in our observations. Several other radio sources were found in the field of view of our observations, but comparison with the digitized sky survey images of the field and with NED222the NASA/IPAC Extragalactic Database, http://nedwww.ipac.caltech.edu suggests that these are background objects not associated with the NGC 3411 group.
4. Discussion
The most notable feature of the NGC 3411 system is the central temperature peak and surrounding cool shell. Similar temperature structures are seen in a handful of systems. Chandra temperature profiles of NGC 1407 and NGC 4649 show central rises of 0.2 keV within the central kiloparsec of each group dominant galaxy (Humphrey et al., 2006). Both systems have temperature profile which rise with radius, but with relatively shallow gradients compared to the steep rise in temperature seen at the outer edge of the cool shell in NGC 3411. Smooth mass profiles can be derived for the two groups, so any deviations from hydrostatic equilibrium must be mild. The cause of these central temperature rises are unclear, and both AGN heating or merger activity are possibilities. In either case, the systems seem to have been only weakly affected or to have had sufficient time to become largely relaxed. Abell 644 may be an example of a more disturbed system (Buote et al., 2005). In this cluster, the X-ray surface brightness peak, dominant cD galaxy and centroid of the X-ray halo are all offset from one another. If a radial temperature profile is measured centered on the X-ray peak, the central 40 kpc region is found to be 2 keV higher than in the surrounding bins. Measuring the profile from the centroid of the X-ray halo removes this peak and the surrounding low temperature region, producing a near isothermal profile. The temperature structure is thought to be the product of a merger which has heated the cluster core and produced a “sloshing” motion, leading to the observed offsets. Using the centrally peaked temperature profile, Buote et al. derive a mass profile which is very uncertain, but consistent with the NFW model (Navarro et al., 1997). However, they argue that the central 75 kpc of the cluster is likely to be out of hydrostatic equilibrium, given the observed disturbance. NGC 3411 shows no evidence of “sloshing” or of a significant merger capable of producing such a disturbance.
In NGC 3411, the shell of cool gas surrounds the hotter core at a radius of 20-40 kpc. The temperature maps show that the shell is not completely regular, and the two maps do not entirely agree on the projected distribution of the gas. However, both show cool gas completely surrounding the hotter core region, and both show the largest concentration and the coolest gas to the east of the core. If we approximate the gas distribution as a uniformly filled spherical shell, we find that it contains 91 of gas. If we instead assume a shell only 10 kpc thick, with an additional “blob” of gas of size 40 kpc (corresponding roughly to the region east of the core), the mass of cool gas is reduced to 3.9 . Neither model is physically rigorous; the most likely true configuration is a spherical hot core located towards one end of a slightly elliptical cool shell. For simplicity, we will assume the former approximation in our discussion, but note that the mass and volume may be a factor 2 lower.
4.1. Shell formation by AGN reheating of a cool core
Perhaps the most obvious scenario for the formation of the peak and shell is that NGC 3411 is a system in which the center of a cooling region has been reheated. In this model, the group halo would have been undisturbed until relatively recently, and radiative cooling would have produced a cool inner region with a smoothly declining central temperature profile. Cooling of gas in the core of NGC 3411 itself could then provide fuel for an AGN outburst (or potentially for star formation, though the current absorption dominated optical spectrum argues against this) which would provide enough energy to partially reheat the gas, producing the hot core which we observe. We can estimate the minimum energy required by assuming that the core was heated from a temperature of 0.7 keV (equal to the cool shell) to its current state. This would require erg. Using the relation between AGN luminosity and mechanical power output (Bîrzan et al., 2004), we can estimate the current rate of energy injection from the AGN in NGC 3411 to be 8.2. This is somewhat higher than the upper limits on the current X-ray luminosity of the AGN, but is considerably lower than the rate at which energy is lost from the core through radiative cooling, 1.13 . This strongly suggests that if AGN heating is responsible for the raised temperature of the core, the AGN power output must have been significantly larger in the past. Energy injection at 1043 could produce this change in 7.2 Myr, while injection at 4 times the current mechanical power estimate would take 30 Myr. However, these energy requirements should be considered lower limits; if the group did possess a cool core prior to reheating, the centre of that region would likely have been cooler than 0.7 keV. The maximum energy injection rate is limited by the fact that we see no sign of convective instability, which would be expected if the heating were very rapid. The smooth entropy gradient observed shows that the gas heating rate was not sufficient to drive convective gas flows.
We can also calculate the energy required to create the two “hot spots” within the core region. As we are not sure of the mechanism by which heating has occurred, we use the local sound speed, 365 , to estimate a rough timescale of 15.5 Myr over which the hot regions formed. Approximating each hot region as a sphere 6.5 kpc in diameter and assuming that they were heated by 0.07 keV, we find that the energy required is 1.7 erg, equivalent to 8 over the estimated timescale. This is a relatively low power compared to that estimated for the hot core as a whole.
The fact that we see no signs of jets or shocks in the radio or X-ray data suggests that the AGN is currently in a fairly quiescent state, or that it is injecting energy through some form of outflow which is not radio or X-ray bright. Comparison with low-luminosity AGN (Terashima & Wilson, 2003) and weak-line radio galaxies (Rinn et al., 2005), and with the black hole fundamental plane (using a black hole mass of M , based on galaxy luminosity Häring & Rix, 2004; Merloni et al., 2006), suggests that NGC 3411 may be a fairly typical low-luminosity system, though it lies at the low end of the range of both X-ray and radio power. However, if the X-ray luminosity is significantly lower than out upper limit, the AGN would be classed as uncommonly X-ray faint.
Some Seyfert galaxies and broad-absorption-line (BAL) QSOs are known to have diffuse bipolar radio structures centered on the AGN, similar to the radio structure we see in the core of NGC 3411 (Stocke et al., 1992; Ulvestad & Wilson, 1984). Such structures may represent outflowing winds from the accretion disk, driven by radiation pressure or magnetocentrifugal forces (Elvis, 2000; de Kool, 1997, and references therein). However, numerical modelling of such winds (Proga, 2003) and measurements from nearby systems (e.g. Kraemer et al., 2005) suggest that the energy output from such a wind would be rather low. NGC 3411 has a considerably more massive SMBH than a typical Seyfert galaxy and is perhaps more comparable with BAL QSOs, but the output would still likely be only a few 1038-39 , to low to be responsible for heating or maintaining the temperature in the group core. In any case, the lack of a definite X-ray source associated with the radio peak, the substructures to the north and south of the radio core, the lack of a decrease in central surface brightness (as would be expected if a jet in the line of sight had excavated cavities in the X-ray halo) and the absorption dominated optical spectrum all strongly suggest that the AGN is heavily absorbed, and probably has an axis close to the plane of the sky.
4.2. Shell formation from stripped gas
An alternative is that the cool shell is the product of a merger. It is well established that galaxies falling through the IGM of a galaxy cluster can be stripped of their gas by ram pressure, with several examples observed in nearby systems (e.g., Machacek et al., 2006, 2005a; Davis et al., 1997). An early-type galaxy, falling into the NGC 3411 group and passing through the core, could potentially lose a significant fraction of its gaseous halo. The stripped gas would sink or rise to a level where its entropy matches that of the surrounding IGM, and spread along the equal entropy surface, forming a shell. As the stripped gas would have a fairly constant entropy, we might expect the entropy profile to flatten at the radius of the cool shell, and to some extent this is visible in our entropy models. The 0.7 keV temperature observed in the shell is quite typical of both group and elliptical galaxy halos. If the shell is the product of a merger, no energy input from the AGN would be required, except perhaps to balance energy lost through radiative cooling.
There are however a number of potential problems with this model. The smoothly declining abundance profile shows no feature at the position of the cool shell, arguing that the gas has the same origin and enrichment history as the warmer regions around it. Ram-pressure stripping is most effective at high velocities and in high density gas . Galaxy clusters often have cores of radius 100 kpc, within which the density n0.01 (e.g., Sanderson & Ponman, 2003). The NGC 3411 halo reaches comparable densities only in the central 20 kpc, so an almost radial orbit would be required. Turbulent and viscous stripping mechanisms can be effective at lower velocities, but these are less efficient at removing gas (Nulsen, 1982), suggesting that the cool shell would represent only a part of the halo of the stripped object. The amount of gas in the shell is quite sizable. Athey (2003) measured the relation between halo gas mass and optical luminosity in elliptical galaxies, and we can use this to predict the size of a galaxy which could produce the shell. If we assume that all the gas in the shell is from the stripped galaxy, and that the galaxy halo was entirely removed, the relation suggests that we should expect an object with log =11.2 . The scatter in the relation is quite large, but this still suggests a galaxy of comparable or greater optical luminosity than NGC 3411 itself. The next most luminous galaxy in the group is a factor 1.5 fainter.
To identify galaxies which might have interacted with NGC 3411 at some point in the past, we selected those objects within 2000 and 1 Mpc on the sky. Comparing K-band luminosities (which avoid bias from young stellar populations), we find that there are four nearby galaxies of comparable size; NGC 3404 (=11.24), IC 647 (10.32), NGC 3421 (10.83), NGC 3422 (10.96). All four galaxies have recession velocities within 250of that of NGC 3411. Of these, the location of the S0 IC 647 inside the cool shell just to the east of NGC 3411 might initially suggest a connection. However, for its halo to be the source of the gas in the cool shell, it would have to have been stripped during a previous passage through the core so the observed superposition would be a very unlikely conspiracy. It may be that the galaxy halo (if one exists) affects the temperature map, decreasing the temperature at that position. However, while there is excess surface brightness in the region of IC 647 we cannot say how much is associated with the galaxy. NGC 3421 is a disturbed face-on spiral galaxy 0.5 Mpc to the north of NGC 3411. While late-type spirals predominantly contain cool gas, it has been suggested that vigorous star formation may heat this gas and cause it to expand and diffuse away from the galactic disk, making ram-pressure stripping more efficient (Rasmussen et al., 2006). However, NGC 3421 has several regions of ongoing star formation, casting doubt on the possibility that it has been significantly stripped. The two remaining galaxies, NGC 3422 and NGC 3404 are distant enough that the cool shell would have to be unrealistically old (1-2 Gyr) for them to have been its source, assuming motion at the group velocity dispersion of 500 .
4.3. Conduction across the shell boundaries
We can put a lower limit on the lifetime of the cool gas shell by estimating the rate at which it should be heated by conduction from the surrounding gas. We again assume a uniform shell of gas, 20 kpc thick, and that the process does not affect the surrounding hot gas in any way. We assume a temperature gradient of 0.14 keV over 9.5 kpc, the distance between the mid-points of the XMM spectral bins. The heat flux across this gradient can be described as (Spitzer, 1962; Sarazin, 1988):
| (3) |
where is the heat flux, is the electron temperature and is the thermal conductivity, defined as (Cowie & McKee, 1977):
| (4) |
where is the electron density, is the electron mass, and is the electron mean free path. In a fully ionized gas mainly composed of hydrogen, the mean free path is defined as (Ettori & Fabian, 2000):
| (5) |
where /10 keV, , and is the impact parameter of the Coulomb collisions, defined as:
| (6) |
From these equations, we find a mean free path of 54 pc, and estimate that with conduction at the Spitzer rate, the heat flux across the boundaries of the shell would be 1.96, suggesting that the shell would be heated to the surrounding temperature in 8 Myr. This value would be reduced if the temperature gradient were steeper, but would increase if the hot and cool regions were magnetically separated. In undisturbed regions of the IGM, magnetic field lines are commonly assumed to be tangled, producing only small reductions of the conduction rate. However, processes which introduce structure into the IGM (e.g. radio jets and lobe inflation, mergers, and gas motions) are thought to straighten the field lines, suppressing conduction across boundaries by large factors. In the case of NGC 3411, the amount of suppression required depends on our model for the formation of the cool region. If it is a cool core which has been reheated by AGN activity, only mild suppression is necessary, as the timescale to heat the core is 30 Myr. Heating and expansion of the gas in the central region could cause suppression along the inner shell surface, as field lines are stretched, and reducing conduction by a factor of 20 could be sufficient. If the shell is stripped gas, it must be a much more long-lived structure, with an age of at least a few 108 yr. In this case, conduction would have to be suppressed by a factor of a hundred or more.
One of the stronger observational constraints on conduction in galaxy clusters comes from the temperature variations within the disturbed cluster A754. Markevitch et al. (2003) suggest that conduction cannot be more than a few percent of the Spitzer rate in this system. Studies of conduction as a mechanism for balancing cooling in galaxy clusters suggest that rates of a few hundredths to a few tenths of the Spitzer value are likely typical (Pope et al., 2006; Voigt & Fabian, 2004; Zakamska & Narayan, 2003). While these studies tend to focus on much hotter, higher mass systems than NGC 3411, an examination of the 2 keV Virgo cluster finds similar conduction rates (Pope et al., 2005). If these estimates hold true for NGC 3411, they suggest that the conduction rate could easily be low enough to agree with our AGN heating hypothesis. The suppression factor required by the merger model is at the more extreme end of the range, and suggests that the other galaxies in the group may not be viable sources of stripped gas unless their velocity in the plane of the sky is large.
4.4. Mass, entropy and cooling time
The gas mass and cooling time profiles for the group halo are both rather typical of a system of this temperature. It is notable that despite its lower temperature, the cool shell surrounding the central elliptical still has a longer cooling time than the slightly hotter core. The cooling time drops below 1 Gyr at 30 kpc, around the midpoint of the cool shell, and is 400-500 Myr at 10 kpc. This emphasizes the need for a long-term heat source to prevent runaway cooling. As discussed in section 3.4, the total mass profile is unusual only in the unphysical decline at 40 kpc, which seems to indicate a deviation from hydrostatic equilibrium at the outer edge of the cool shell. Depending on the formation mechanism it is possible that all the gas in the shell, or even the entire core and shell, could be out of hydrostatic equilibrium. However, as the mass profile only becomes unphysical at the outer boundary of the shell, it seems likely that it is only in this region that the deviation from equilibrium becomes severe, and that at smaller radii the mass profile is still reasonably reliable. The mass-to-light ratio profile stays above the expected stellar M/L of 5 throughout, suggesting the presence of dark matter even at relatively small radii. Simulations of group formation suggest that we should expect dark matter halos associated both with the member galaxies and with the group potential as a whole (e.g., Barnes, 1989); the increase in the slope of M/L outside 20 kpc seems likely to indicate the point at which the group dark matter halo begins to dominate over the mass contribution associated with NGC 3411.
The measured entropy profile compares reasonably well with the results of Mahdavi et al. (2005), unsurprisingly given that both studies make use of the same XMM dataset. There is some discrepancy at the largest radii, with the Mahdavi et al. result being a factor of 3 lower than our best fit value at 200 kpc. However, the two values appear to be comparable given the uncertainties on our entropy profile and the small amount of scatter in the Mahdavi et al data points. There may be a larger discrepancy between our total mass and the optical estimate of Ramella et al. (2002), who suggest a mass of 2.7 within a Virial radius of 1.2 Mpc. A direct comparison would require a large extrapolation of our data, which only extend to 200 kpc, but our total mass in that radius, 8.5 , is high enough to suggest that the total mass of the system would be considerably higher. However, as the Ramella et al. estimate is based on velocities from only five group member galaxies, the uncertainty on this estimate is likely large, and the discrepancy may not be serious.
5. Conclusions
In order to examine the properties of the NGC 3411 group and the interactions between the central dominant elliptical and the group halo, we have analysed XMM-Newton, Chandra and VLA observations of the system. Our results can be summarized as follows:
-
1.
The group halo has a highly unusual temperature structure. The radial temperature profile rises from 0.72 keV at large radius to a peak of 0.84 keV at 50 kpc. This hot gas encloses a shell of cool, 0.7 keV gas which itself surrounds the hotter 0.84 keV core. While these temperature differences are small, they are statistically significant. Spectral mapping confirms that the cool gas completely surrounds the core (in projection) and shows the largest concentration of the coolest gas to be located west of the group core.
-
2.
The XMM-Newton X-ray surface brightness profile requires two beta models to produce a good fit, the second component producing a slight excess at 30 kpc radius, corresponding to the shell of cool gas. Chandra surface brightness modelling shows a third component in the core which is not resolved by the XMM data. This component is extended, and is therefore more likely related to diffuse or unresolved emission within the central galaxy than with AGN activity.
-
3.
The deprojected abundance profile is typical of a galaxy group, with a central peak or 1-1.5 and decline with radius. The profile shows no features corresponding to those in the temperature profile.
-
4.
Calculation of the total mass, entropy, cooling time and mass-to-light ratio shows them to be fairly typical of galaxy groups. There is no entropy inversion in the core, indicating that any heating in the system has been slow. The cooling time of the system is shorter than 109 yr within 20 kpc, suggesting that some source of heating is necessary in the long term to prevent runaway cooling. The Mass-to-light ratio profile supports the presence of dark matter at all radii with the possible exception of the innermost galaxy core. A change in gradient at 20 kpc may indicate the point at which the group dark matter halo begins to dominate the mass distribution. However, an unphysical decline in total mass at 35 kpc suggests that the gas is not in hydrostatic equilibrium at this point.
-
5.
Analysis of the VLA observations at 1.4, 5 and 8 GHz reveals a resolved nuclear source with a luminosity of 2.7. There is also evidence for some diffuse emission at 1.4 GHz, extending a few arcseconds. There is no sign of well defined radio jets or lobes, and this may indicate that the AGN is is a relatively quiescent state. An AGN driven wind may be responsible for the diffuse radio emission we observe. There is little evidence for significant AGN activity in the X-ray data, and the Chandra data places a firm upper limit on the AGN 0.4-7.0 keV luminosity of 6 . This suggests that the AGN is heavily absorbed, and probably has an axis close to the plane of the sky.
-
6.
One possible explanation of the cool gas observed in the temperature analysis is that it is stripped material which has settled along its equal entropy surface to form a shell. However, the mass of gas is relatively large, stripping mechanisms are thought to be relatively inefficient in the group environment, and the galaxies which might be the source of the material are both distant and unlikely to have possessed sufficient hot gas. It is also possible that the timescale over which conduction would heat the cool shell is short enough that the other galaxies in the group would be unrealistic as sources of the stripped gas.
-
7.
An alternative is that the temperature features represent a cool core which has been partially reheated by AGN activity. In its current quiescent state, the AGN is unlikely to provide the energy required for such heating, therefore it seems probable that it underwent a period of enhanced activity in the recent past. If this explanation is accurate, we are observing the group at a very unusual period in its history, when the effects of both cooling an heating are visible. The lack of other systems with similar temperature structure would then be unsurprising. In our opinion, this is the more likely scenario.
References
- Allen et al. (2001) Allen, S. W., Schmidt, R. W., & Fabian, A. C. 2001, MNRAS, 328, L37
- Arnaud et al. (2002) Arnaud, M., Majerowicz, S., Lumb, D., Neumann, D. M., Aghanim, N., Blanchard, A., Boer, M., Burke, D. J., Collins, C. A., Giard, M., Nevalainen, J., Nichol, R. C., Romer, A. K., & Sadat, R. 2002, A&A, 390, 27
- Athey (2003) Athey, A. 2003, PhD thesis, University of Michigan
- Barnes (1989) Barnes, J. E. 1989, Nature, 338, 123
- Bauer et al. (2000) Bauer, F. E., Condon, J. J., Thuan, T. X., & Broderick, J. J. 2000, ApJS, 129, 547
- Bîrzan et al. (2004) Bîrzan, L., Rafferty, D. A., McNamara, B. R., Wise, M. W., & Nulsen, P. E. J. 2004, ApJ, 607, 800
- Buote (2002) Buote, D. A. 2002, ApJ, 574, L135
- Buote et al. (2005) Buote, D. A., Humphrey, P. J., & Stocke, J. T. 2005, ApJ, 630, 750
- Buote et al. (2003) Buote, D. A., Lewis, A. D., Brighenti, F., & Mathews, W. G. 2003, ApJ, 595, 151
- Cash (1979) Cash, W. 1979, ApJ, 228, 939
- Churazov et al. (2001) Churazov, E., Brüggen, M., Kaiser, C. R., Böhringer, H., & Forman, W. 2001, ApJ, 554, 261
- Condon et al. (1998) Condon, J. J., Cotton, W. D., Greisen, E. W., Yin, Q. F., Perley, R. A., Taylor, G. B., & Broderick, J. J. 1998, AJ, 115, 1693
- Cowie & McKee (1977) Cowie, L. L., & McKee, C. F. 1977, ApJ, 211, 135
- Davis et al. (1997) Davis, D. S., Keel, W. C., Mulchaey, J. S., & Henning, P. A. 1997, AJ, 114, 613
- de Kool (1997) de Kool, M. 1997, in ASP Conf. Ser. 128: Mass Ejection from Active Galactic Nuclei, ed. N. Arav, I. Shlosman, & R. J. Weymann, 233
- Elvis (2000) Elvis, M. 2000, ApJ, 545, 63
- Ettori & Fabian (2000) Ettori, S., & Fabian, A. C. 2000, MNRAS, 317, L57
- Faber et al. (1989) Faber, S. M., Wegner, G., Burstein, D., Davies, R. L., Dressler, A., Lynden-Bell, D., & Terlevich, R. J. 1989, ApJS, 69, 763
- Fabian et al. (2003) Fabian, A. C., Sanders, J. S., Crawford, C. S., Conselice, C. J., Gallagher, J. S., & Wyse, R. F. G. 2003, MNRAS, 344, L48
- Fabian et al. (2006) Fabian, A. C., Sanders, J. S., Taylor, G. B., Allen, S. W., Crawford, C. S., Johnstone, R. M., & Iwasawa, K. 2006, MNRAS, 366, 417
- Forman et al. (2005) Forman, W., Nulsen, P., Heinz, S., Owen, F., Eilek, J., Vikhlinin, A., Markevitch, M., Kraft, R., Churazov, E., & Jones, C. 2005, ApJ, 635, 894
- Giuricin et al. (2000) Giuricin, G., Marinoni, C., Ceriani, L., & Pisani, A. 2000, ApJ, 543, 178
- Grevesse & Sauval (1998) Grevesse, N., & Sauval, A. J. 1998, Space Sci. Rev., 85, 161
- Häring & Rix (2004) Häring, N., & Rix, H. 2004, ApJ, 604, L89
- Helsdon & Ponman (2000) Helsdon, S. F., & Ponman, T. J. 2000, MNRAS, 315, 356
- Humphrey et al. (2006) Humphrey, P. J., Buote, D. A., Gastaldello, F., Zappacosta, L., Bullock, J. S., Brighenti, F., & Mathews, W. G. 2006, ArXiv Astrophysics e-prints
- Jansen et al. (2001) Jansen, F., Lumb, D., Altieri, B., Clavel, J., Ehle, M., Erd, C., Gabriel, C., Guainazzi, M., Gondoin, P., Much, R., Munoz, R., Santos, M., Schartel, N., Texier, D., & Vacanti, G. 2001, A&A, 365, L1
- Jones et al. (2004) Jones, D. H., Saunders, W., Colless, M., Read, M. A., Parker, Q. A., Watson, F. G., Campbell, L. A., Burkey, D., Mauch, T., Moore, L., Hartley, M., Cass, P., James, D., Russell, K., Fiegert, K., Dawe, J., Huchra, J., Jarrett, T., Lahav, O., Lucey, J., Mamon, G. A., Proust, D., & Sadler, E. M. andWakamatsu, K.-i. 2004, MNRAS, 355, 747
- Kim & Fabbiano (2004a) Kim, D., & Fabbiano, G. 2004a, ApJ, 611, 846
- Kim & Fabbiano (2004b) Kim, D.-W., & Fabbiano, G. 2004b, ApJ, 613, 933
- Kraemer et al. (2005) Kraemer, S. B., George, I. M., Crenshaw, D. M., Gabel, J. R., Turner, T. J., Gull, T. R., Hutchings, J. B., Kriss, G. A., Mushotzky, R. F., Netzer, H., Peterson, B. M., & Behar, E. 2005, ApJ, 633, 693
- Kraft et al. (2006) Kraft, R. P., Jones, C., Nulsen, P. E. J., & Hardcastle, M. J. 2006, ApJ, 640, 762
- Machacek et al. (2005a) Machacek, M., Dosaj, A., Forman, W., Jones, C., Markevitch, M., Vikhlinin, A., Warmflash, A., & Kraft, R. 2005a, ApJ, 621, 663
- Machacek et al. (2006) Machacek, M., Nulsen, P. E. J., Jones, C., & Forman, W. R. 2006, ArXiv Astrophysics e-prints
- Machacek et al. (2005b) Machacek, M. E., Nulsen, P., Stirbat, L., Jones, C., & Forman, W. R. 2005b, ApJ, 630, 280
- Mahdavi et al. (2000) Mahdavi, A., Böhringer, H., Geller, M. J., & Ramella, M. 2000, ApJ, 534, 114
- Mahdavi et al. (2005) Mahdavi, A., Finoguenov, A., Böhringer, H., Geller, M. J., & Henry, J. P. 2005, ApJ, 622, 187
- Markevitch et al. (2003) Markevitch, M., Mazzotta, P., Vikhlinin, A., Burke, D., Butt, Y., David, L., Donnelly, H., Forman, W. R., Harris, D., Kim, D.-W., Virani, S., & Vrtilek, J. 2003, ApJ, 586, L19
- Marty et al. (2003) Marty, P. B., Kneib, J. P., Sadat, R., Ebeling, H., & Smail, I. 2003, in Proceedings of the SPIE, Vol. 4851, X-Ray and Gamma-Ray Telescopes and Instruments for Astronomy., ed. J. E. Truemper & H. D. Tanabaum, 208–222
- McNamara et al. (1996) McNamara, B. R., O’Connell, R. W., & Sarazin, C. L. 1996, AJ, 112, 91
- Mellier & Mathez (1987) Mellier, Y., & Mathez, G. 1987, A&A, 175, 1
- Merloni et al. (2006) Merloni, A., Körding, E., Heinz, S., Markoff, S., Dimatteo, T., & Falcke, H. 2006, New Astronomy, 11, 567
- Morita et al. (2006) Morita, U., Ishisaki, Y., Yamasaki, N. Y., Ota, N., Kawano, N., Fukazawa, Y., & Ohashi, T. 2006, PASJ, 58, 719
- Navarro et al. (1997) Navarro, J. F., Frenk, C. S., & White, S. D. M. 1997, ApJ, 490, 493
- Nulsen (1982) Nulsen, P. E. J. 1982, MNRAS, 198, 1007
- O’Sullivan & Ponman (2004) O’Sullivan, E., & Ponman, T. J. 2004, MNRAS, 354, 935
- O’Sullivan et al. (2005) O’Sullivan, E., Vrtilek, J. M., Kempner, J. C., David, L. P., & Houck, J. C. 2005, MNRAS, 357, 1134
- O’Sullivan et al. (2003) O’Sullivan, E., Vrtilek, J. M., Read, A. M., David, L. P., & Ponman, T. J. 2003, MNRAS, 346, 525
- Pierre et al. (1994) Pierre, M., Boehringer, H., Ebeling, H., Voges, W., Schuecker, P., Cruddace, R., & MacGillivray, H. 1994, A&A, 290, 725
- Pope et al. (2005) Pope, E. C. D., Pavlovski, G., Kaiser, C. R., & Fangohr, H. 2005, MNRAS, 364, 13
- Pope et al. (2006) —. 2006, MNRAS, 367, 1121
- Pratt et al. (2001) Pratt, G. W., Arnaud, M., & Aghanim, N. 2001, in Clusters of Galaxies and the High Redshift Universe Observed in X-rays:, ed. D. M. Neumann & J. Tranh Thanh Van
- Proga (2003) Proga, D. 2003, ApJ, 585, 406
- Ramella et al. (2002) Ramella, M., Geller, M. J., Pisani, A., & da Costa, L. N. 2002, AJ, 123, 2976
- Rasmussen et al. (2006) Rasmussen, J., Ponman, T. J., & Mulchaey, J. S. 2006, MNRAS, 589
- Rinn et al. (2005) Rinn, A. S., Sambruna, R. M., & Gliozzi, M. 2005, ApJ, 621, 167
- Sanders et al. (2004) Sanders, J. S., Fabian, A. C., Allen, S. W., & Schmidt, R. W. 2004, MNRAS, 349, 952
- Sanderson & Ponman (2003) Sanderson, A. J. R., & Ponman, T. J. 2003, MNRAS, 345, 1241
- Sarazin (1988) Sarazin, C. 1988, X-ray emission from clusters of galaxies (Cambridge University Press)
- Sarazin et al. (1995) Sarazin, C. L., Burns, J. O., Roettiger, K., & McNamara, B. R. 1995, ApJ, 447, 559
- Smith et al. (2001) Smith, R. K., Brickhouse, N. S., Liedahl, D. A., & Raymond, J. C. 2001, ApJ, 556, L91
- Spitzer (1962) Spitzer, L. 1962, Physics of Fully Ionized Gases (Physics of Fully Ionized Gases, New York: Interscience (2nd edition), 1962)
- Stocke et al. (1992) Stocke, J. T., Morris, S. L., Weymann, R. J., & Foltz, C. B. 1992, ApJ, 396, 487
- Tamura et al. (2004) Tamura, T., Kaastra, J. S., den Herder, J. W. A., Bleeker, J. A. M., & Peterson, J. R. 2004, A&A, 420, 135
- Terashima & Wilson (2003) Terashima, Y., & Wilson, A. S. 2003, ApJ, 583, 145
- Ulvestad & Wilson (1984) Ulvestad, J. S., & Wilson, A. S. 1984, ApJ, 285, 439
- Vikhlinin et al. (2005) Vikhlinin, A., Markevitch, M., Murray, S. S., Jones, C., Forman, W., & Van Speybroeck, L. 2005, ApJ, 628, 655
- Voges et al. (1999) Voges, W., Aschenbach, B., Boller, T., Bräuninger, H., Briel, U., Burkert, W., Dennerl, K., Englhauser, J., & et al. 1999, A&A, 349, 389
- Voigt & Fabian (2004) Voigt, L. M., & Fabian, A. C. 2004, MNRAS, 347, 1130
- Weisskopf et al. (2002) Weisskopf, M. C., Brinkman, B., Canizares, C., Garmire, G., Murray, S., & Van Speybroeck, L. P. 2002, PASP, 114, 1
- Yentis et al. (1992) Yentis, D. J., Cruddace, R. G., Gursky, H., Stuart, B. V., Wallin, J. F., MacGillivray, H. T., & Collins, C. A. 1992, in ASSL Vol. 174: Digitised Optical Sky Surveys, ed. H. T. MacGillivray & E. B. Thomson, 67
- Zakamska & Narayan (2003) Zakamska, N. L., & Narayan, R. 2003, ApJ, 582, 162