Flaring Activity of Sgr A*: Expanding Hot Blobs
Abstract:
Sgr A* is considered to be a massive black hole at the Galactic center and is known to be variable in radio, millimeter, near-IR and X-rays. Recent multi-wavelength observing campaigns show a simultaneous X-ray and near-IR flare, as well as sub-millimeter and near-IR flares from Sgr A*. The flare activity is thought to be arising from the innermost region of Sgr A*. We have recently argued that the duration of flares in near-IR and submillimeter wavelengths implies that the burst of emission expands and cools on a dynamical time scale before the flares leave Sgr A*. The detection of radio flares with a time delay in the range of 20 and 40 minutes between 7 and 12mm peak emission implies adiabatic expansion of a uniform, spherical hot blob due to flare activity. We suspect that this simple outflow picture shows some of the characteristics that are known to take place in microquasars, thus we may learn much from comparative study of Sgr A* and its environment vs. microquasars.
1 Background
More than three decades have elapsed since the discovery of Sgr A* (Balick & Brown 1974), and during most of this time the source remained undetected outside the radio band. Recent observations have provided compelling evidence that the compact nonthermal radio source Sgr A* can be clearly identified with the massive black hole at the center of the Galaxy. A major breakthrough in our understanding of the nature of this source came from stellar orbital measurements showing a mass 3-4 coincident within 45 AU of Sgr A* (e.g., Schödel et al. 2003; Ghez et al. 2003). This dark, massive object has been uniquely identified with the radio source Sgr A* through measurements of the proper motion of the radio source, which show that Sgr A* must contain and does not orbit another massive object (Reid & Brunthaler 2004). A “sub-millimeter bump” was detected in the broad-band spectrum of Sgr A* (Zylka et al. 1995; Falcke et al. 1998); the peak sub-millimeter frequency is thought to be the dividing line between optically thin emission at higher frequencies, and optically thick emission at lower frequencies. A number of additional observations such as the time variability and polarization (Bower et al. 2005; Marrone et al. 2006) analysis are providing additional opportunities to study the innermost regions, within just a f ew Schwarzschild radii of the black hole event horizon, a region currently unaccessible via high spatial resolution imaging. Here we focus only on the recent time variability studies of Sgr A*.
The Chandra X-ray Observatory detected the quiescent X-ray counterpart of Sgr A∗, followed a year later by the discovery of strong X-ray flares by Chandra (Baganoff et al. 2001) and then XMM-Newton (Goldwurm et al. 2003). During a flare event, the X-ray flux of Sgr A∗ increases by 1–2 orders of magnitude. Using XMM-Newton, Porquet et al. (2003) detected the most powerful X-ray flare seen to date, which also showed the softest spectrum. The typical time scale for X-ray flares is about an hour. More recently, the long-sought near-IR counterpart to Sgr A∗ was discovered when Genzel et al. (2003) and Ghez et al. (2004) detected quiescent emission and a number of flares in the H, Ks and L’ bands from Sgr A∗. Typical IR flares last about 40 minutes, with the flux increasing by a factor of about 5. Variability has also been reported at millimeter and centimeter wavelengths (Zhao et al. 2003; Miyazaki et al. 2004). The amplitude is small, however, in comparison to that of X-ray and near-IR wavelengths, and the variability time scale appears to range between days and weeks.
Although numerous observations have detected Sgr A* in its flaring state, there are limited simultaneous observations to measure the correlation in different wavelength bands and within radio bands (e.g., Eckart et al. 2006). On the theoretical side numerous models have also been proposed. The discussion of these models are beyond the scope of this contribution paper. Highlights of our multi-wavelength observations are presented here (Yusef-Zadeh et al. 2006a,b), as the following issues are discussed: Is the time variability of Sgr A* at different wavelengths correlated? And if so, what will correlated variability measurements tell us about the emission mechanisms and the properties of the accretion flow within a few Schwarzschild radii of the black hole?
2 Correlation Study
We begin with the correlation study of X-ray and near-IR flares, followed by the correlation of near-IR and sub-millimeter wavelengths. Finally, we present the correlation of flare emission in submillimeter and radio bands. The discussion below should provide some insights on the physical processes that may run parallel in both micro-quasars and Sgr A*.
2.1 X-ray and Near-IR Flares
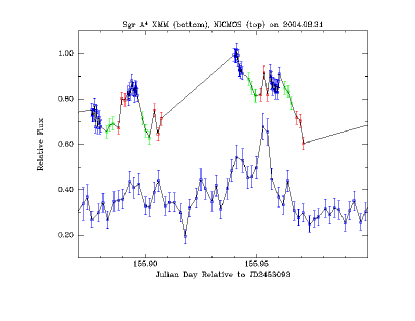
The long temporal coverage of XMM-Newton and HST observations have led to the detection of a simultaneous flare in both X-ray and near-IR wavelengths. Figure 1a shows the simultaneous near-IR and X-ray emission with an amplitude increase of 15% and 100% for the peak emission, respectively. It is clear that near-IR and X-ray flares track each other on short timescales, providing compelling evidence for their correlation with no time delay. The X-ray light curve shows a double peaked maximum flare which appears to be remarkably in phase with the near-IR strongest double peaked flares, though with different amplitudes. Since detectable X-ray flares occur on the average once a day, the lack of X-ray counterparts to other near-IR flares indicates that i) not all near-IR flares have X-ray counterparts or ii) that the X-ray-to-near-IR ratio of some of the flares is too small for X-rays to be detected above the strong, diffuse and steady X-ray background emission from the central parsec. This observational fact has important implications on the emission mechanism, as described below.
We argue that the X-ray counterparts to the near-IR flares are unlikely to be produced by synchrotron radiation in the typical G magnetic field for two reasons. First, emission at 10 keV would be produced by 100 GeV electrons, which have a synchrotron loss time of only 20 seconds, whereas individual X-ray flares rise and decay on much longer time scales (Baganoff et al. 2001). Second, the observed spectral index of the X-ray flares, (Belanger et al. 2005), does not match the value of near-IR to X-ray spectral index (Yusef-Zadeh et al. 2006a). We favor an inverse Compton model for the X-ray emission, which naturally produces a strong correlation with the near-IR flares. In this picture, sub-millimeter photons are up-scattered to X-ray energies by the electrons responsible for the near-IR synchrotron radiation. The fractional variability at sub-millimeter wavelengths is less than 20%, so we consider a steady supply of submillimeter photons scattering off the variable population of GeV electrons that emit in the near-IR wavelengths. In the ICS picture, the spectral index of the near-IR flare must match that of the X-ray counterpart, i.e. = 0.6. Future simultaneous observations should be able to test this picture.
Another important characteristic of the X-ray and near-IR flares is the lack of a one-to-one match between them. This suggests that the variable spectral index (or the magnetic field) of near-IR flare emission can increase the chance of detecting an X-ray flare counterpart if the energy spectrum of near-IR emitting particles is soft. Support for the importance of the energy spectrum of the particles may come from the sub-flares in the X-ray and near-IR flare light curves showing different amplitudes but the same phase (see Fig. 1a). Additional support for this suggestion comes from the fact that the brightest detected X-ray flare thus far has shown the softest spectrum in X-rays (Porquet et al. 2003). Assuming that the ICS picture to produce X-ray emission from Sgr A* is correct, then it is clear that this mechanism is vastly different than what is considered to produce X-ray emission from micro-quasars.
2.2 Sub-millimeter and Near-IR Flares
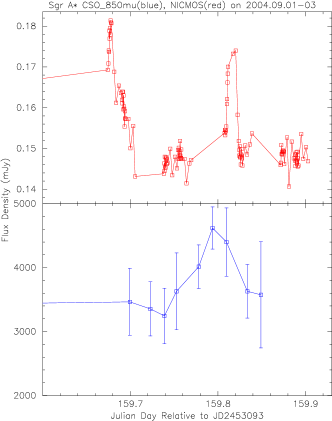
Figure 1b shows simultaneous near-IR and sub-millimeter observations using the NICMOS/HST and the CSO, respectively. Two near-IR flares with durations of about 20–35 min are displayed against an 850 m flare with an estimated 2-hour duration. Two important points can be drawn from this diagram. First, the simultaneity of the flares suggests that the same synchrotron emitting electrons are responsible for production of both near-IR and sub-millimeter flares. Thus, the duration of flares in these wavelength bands should be set by their cooling time scales. However the 2h time scale of the 850m flare is inconsistent with the expected 12h synchrotron cooling time scale. This implies that the durations of the sub-millimeter and near-IR flares must be set by dynamical mechanisms such as adiabatic expansion.
The second point is that it is not clear whether the sub-millimeter flare is correlated simultaneously with the second bright near-IR flare, or is produced by the first near-IR flare but with a delay of roughly 160 minutes (Figure 1b). A delay between near-IR and sub-millimeter peak emission would imply that the emission is optically thick and cools by adiabatic expansion of hot plasma.
2.3 Radio and Sub-millimeter Flares
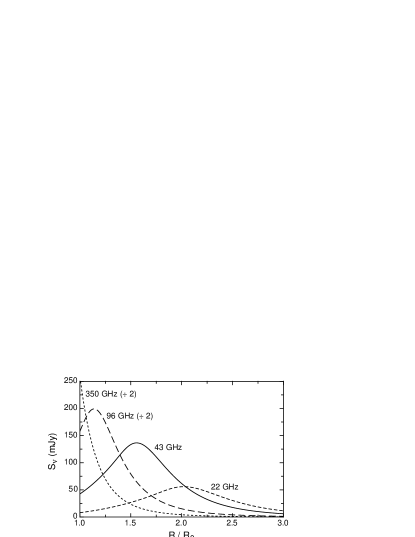
The durations of near-IR and sub-millimeter flares imply that flare activity can be driven by an outflow (Yusef-Zadeh et al. 2006a). This prediction motivated us to search for a time delay at radio wavelengths. In order to test the outflow picture, we studied the light curves of Sgr A* at 7 and 13mm taken with the VLA in 2005 (Fig. 2a). The light curves at both wavelengths show a 5-10% increase of flux with respect to its quiescent level. We found that the emission at 13 mm lags that at 7 mm by 20 minutes (Yusef-Zadeh et al. 2006b). If this time delay is correct, then this supports a picture in which the peak frequency of emission (i.e. near-IR) shifts toward lower frequencies (sub-millimeter, millimeter and then radio) as a self-absorbed synchrotron source expands adiabatically (van der Laan 1966). Figure 2b shows theoretical modeling of radio, millimeter, sub-millimeter and near-IR emission as a function of the size of an expanding synchrotron bubble. For this plot, we used a particle energy spectrum and an initial blob size of 4Rs, where Rs is the Schwarzschild radius. Simultaneous measurements were taken only at 7 and 13mm as the near-IR optically thin flare emission, with a flux density of 1 mJy, is expected to arise from the most compact region. As the hot plasma expands, however, the larger surface area should produce optically thick millimeter and radio emission with a peak flux of 100–220 mJy, corresponding to a two to three order of magnitude increase in the flux of the optically thin emission. This simple picture of adiabatic expansion of plasma is a phenomenon that is commonly observed in micro-quasars (e.g. Ueda et al. 2002).
Since synchrotron optical depth is , an assumption that went into constructing Figure 2b is that the sub-millimeter peak emission is optically thin. However, this may not be the case, as Figure 1b alludes to a possible time delay between the near-IR and sub-millimeter peak emissions. Such a time delay should be longer for a flare with a steep spectral index than for one with a flat spectral index. This is due to the larger number of steep spectrum nonthermal particles at low energies that can push the gas outward, producing a greater emitting surface. The hot material with a steep spectrum can also keep the expanding plasma optically thick for a longer period, thus generating a longer time delay.
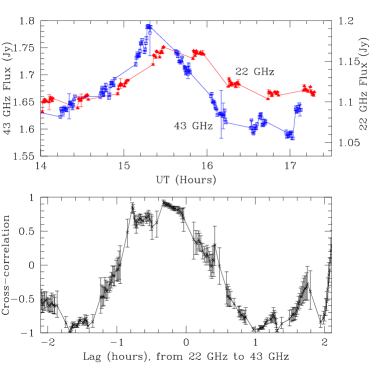
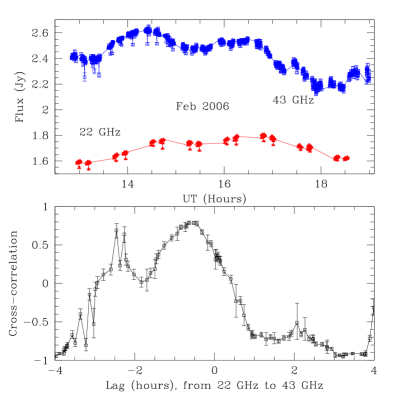
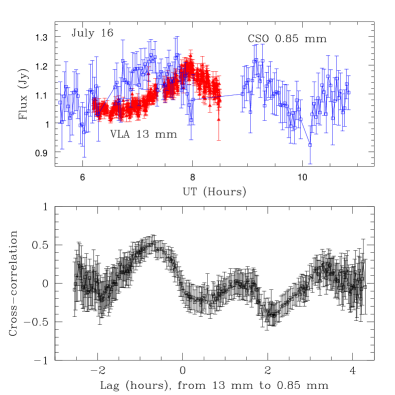
To confirm the time delay between radio wavelengths, we recently re-observed Sgr A* with the VLA at 7 and 13mm at two epochs in February and July of 2006. Figure 3a shows an example of the light curves of Sgr A* at these wavelengths and the corresponding cross-correlation that shows a peak which is consistent with the 7mm emission leading the 13mm emission. Figure 3b shows also a cross-correlation peak between 0.85mm and 13mm emissions using the CSO and the VLA. It can be seen that the 0.85mm emission leads the 13mm emission, consistent with our radio measurements.
2.4 X-ray and Sub-millimeter Flares
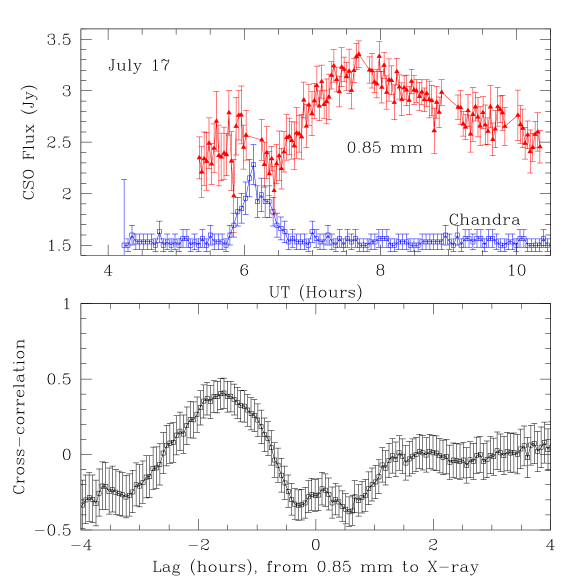
In the latest multi-wavelength campaign to study the flaring activity of Sgr A*, a flare was simultaneously detected at X-ray and sub-millimeter wavelengths. The results of this campaign will be given elsewhere. Here we briefly present the light curves of Sgr A* at 850m and X-rays and the corresponding cross correlation peak, as displayed in Figure 4. The photon index of the X-ray flare is flat 1.0 (0.0, 2.6). The 90% confidence error bars are large because the flare spectrum only had about 180 net counts. The absorption corrected peak flux (2-8 keV) is 5.3 erg s-1 cm2. Assuming 8 kpc as the distance to the Galactic center, the corresponding luminosity would be 4.0 erg s-1. Although the sub-millimeter time coverage is not as good as the X-ray time coverage, we believe that the two peaks are related to each other. If so, the cross correlation plot suggests that the sub-millimeter peak lags the X-ray peak by about 110 minutes. Another possible support for the association of the two peaks comes from the flat shape of the decaying part of the two light curves in X-rays and sub-millimeter wavelengths, although the X-ray flare decays somewhat faster than that of the sub-millimeter flare (see Morris et al. in this volume for the near-IR counterpart to this flare). Also, assuming that the X-ray flare has a simultaneous near-IR counterpart, then the hour time delay seen in Figure 4 is consistent with that observed between the near-IR and sub-millimeter peaks in September 2004 (Yusef-Zadeh et al. 2006a).
3 To Outflow or Not To Outflow
Given the relatively short observing sessions for a southern source that is active most of the time, it is difficult to definitively establish the relation between activity in various wavelength bands. However, the picture of flaring activity driving an adiabatic expansion of hot plasma is consistent with observations, though it is not clear if this hot plasma can indeed leave the gravitational potential of Sgr A*. As has been shown theoretically in the context of a jet model (see Melia and Falcke 2001; Falcke & Markoff 2000), the outflowing material requires a steep energy spectrum, a high initial velocity, a relatively large initial size and a high fraction of thermal material mixed in with the nonthermal plasma in order for the initial hot blob to escape with significant mass outflow rate. The 2-h duration of a typical radio flare corresponds to a maximum size scale of AU or 190Rs, assuming that the hot blob is expanding at the speed of light. The blob size at the peak is 100 Rs which is is much bigger than than the VLBI size scale of Sgr A*. On the other hand, combining the 103s time delay and a size scale of 1AU as the initial size of an expanding blob gives an expansion speed less than one-half the speed of light. This estimate does not violate the inverse Compton limit and is consistent with the model described here. If the blobs originate near the last stable orbit, it is not clear that this expanding material can leave the gravitational potential of Sgr A*. If Sgr A* has a disk, the 20-40 minute time scale for the durations of near-IR flares can then be identified with the accretion disk’s orbital period at the location of the emission region. The dynamical time scale is the natural expansion time scale for the pressure to build up, implying that the emitting size of the blob is of the order of the disk radius, a few Rs. In this picture, the hot blobs expand to a size scale which is comparable to the 1 AU radio emission size of Sgr A*.
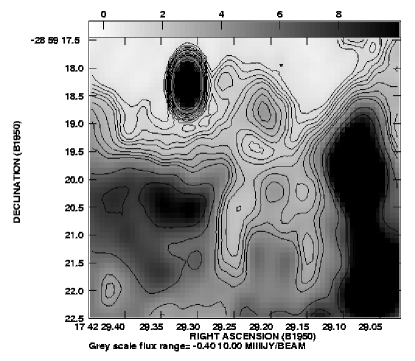
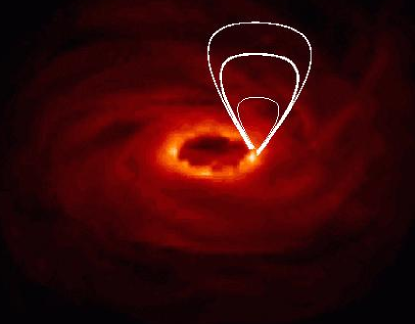
It is also not clear if the outflowing material will be collimated since there is no evidence that Sgr A* has a disk. There are some hints that a collimated outflow may arise from Sgr A*. For example, there is the intriguing radio continuum image of the inner few arcseconds of Sgr A*, as shown in Figure 5a (Yusef-Zadeh, Morris & Ekers 1992). These large-scale (1017 cm) blob-like structures could potentially be material outflowing from Sgr A*. One could speculate that these blobs are collimated by a disk as shown in Figure 5b. This figure shows a schematic diagram of expanding blobs superimposed on a color image of a synchrotron emitting disk based on an MHD simulation of a radiatively inefficient accretion flow (Goldston, Quataert & Igumenshchev 2005). The observed time delay in radio wavelengths could also be explained by a jet model (see Yusef-Zadeh et al. 2006b). In addition, one could argue that the similarity of the underlying ejection of hot plasma in Sgr A* and micro-quasars suggests that there should be a collimated outflow from Sgr A*.
References
- [1] F. K. Baganoff, et al. “Rapid X-ray flaring from the direction of the supermassive black hole at the Galactic Centre”, 2001, \nat, 413, 45
- [2] B. Balick & R. L. Brown “Intense sub-arcsecond structure in the galactic center”, 1974, Astrophys. J. , (1) 94, 265
- [3] G. Bélanger, A. Goldwurm, F. Melia, P. Ferrando, N. Grosso, D. Porquet, R. Warwick, & F. Yusef-Zadeh “Repeated X-Ray Flaring Activity in Sagittarius A*”, 2005, Astrophys. J. , (6) 35, 1095
- [4] G. C. Bower, H. Falcke, M. C. Wright, & D. C. Backer “Variable Linear Polarization from Sagittarius A*: Evidence of a Hot Turbulent Accretion Flow”, 2005, \apjl, 618, L29
- [5] A. Eckart, et al. “The flare activity of Sagittarius A*. New coordinated mm to X-ray observations”, 2006, \aap, 450, 535
- [6] H. Falcke, W. M. Goss, H. Matsuo, P. Teuben, J.-H. Zhao, & R. Zylka “The Simultaneous Spectrum of Sagittarius A * from 20 Centimeters to 1 Millimeter and the Nature of the Millimeter Excess”, 1998, Astrophys. J. , (4) 99, 731
- [7] H. Falcke, & S. Markoff “The jet model for Sgr A*: Radio and X-ray spectrum”, 2000, \aap, 362, 113
- [8] R. Genzel, R. Schödel, T. Ott, A. Eckart, T. Alexander, F. Lacombe, D. Rouan, & B. Aschenbach “Near-infrared flares from accreting gas around the supermassive black hole at the Galactic Centre”, 2003, \nat, 425, 934
- [9] A. M. Ghez, B. L. Klein, M. Morris, & E. E. Becklin “High Proper-Motion Stars in the Vicinity of Sagittarius A*: Evidence for a Supermassive Black Hole at the Center of Our Galaxy”, 1998, Astrophys. J. , (5) 09, 678
- [10] A. M. Ghez, et al. “Variable Infrared Emission from the Supermassive Black Hole at the Center of the Milky Way”, 2004, \apjl, 601, L159
- [11] A. Goldwurm, E. Brion, P. Goldoni, P. Ferrando, F. Daigne, A. Decourchelle, R. S. Warwick, & P. Predehl “A New X-Ray Flare from the Galactic Nucleus Detected with the XMM-Newton Photon Imaging Cameras”, 2003, Astrophys. J. , (5) 84, 751
- [12] J.E. Goldston, E. Quataert, & I.V. Igumenshchev “Synchrotron Radiation from Radiaitively Inefficient Accretion Flow Simulations: Application to Sgr A*”, 2005, Astrophys. J. , (6) 25, 785
- [13] J.-P. Macquart & G. C. Bower “Understanding the Radio Variability of Sagittarius A*”, 2006, Astrophys. J. , (6) 41, 302
- [14] D. P. Marrone, J. M. Moran, J.-H. Zhao, & R. Rao “Interferometric Measurements of Variable 340 GHz Linear Polarization in Sagittarius A*”, 2006, Astrophys. J. , (6) 40, 308
- [15] J. C. Mauerhan, M. Morris, F. Walter, & F. K. Baganoff “Intraday Variability of Sagittarius A* at 3 Millimeters”, 2005, \apjl, 623, L25
- [16] F. Melia & H. Falcke “The Supermassive Black Hole at the Galactic Center”, 2001, Ann. Rev. Astron. & Astrophys. , (3) 9, 309
- [17] A. Miyazaki, T. Tsutsumi, & M. Tsuboi “Intraday Variation of Sagittarius A* at Short Millimeter Wavelengths”, 2004, \apjl, 611, L97
- [18] D. Porquet, P. Predehl, B. Aschenbach, N. Grosso, A. Goldwurm, P. Goldoni, R. S. Warwick, & A. Decourchelle “XMM-Newton observation of the brightest X-ray flare detected so far from Sgr A*”, 2003, \aap, 407, L17
- [19] M. J. Reid & A. Brunthaler “The Proper Motion of Sagittarius A*. II. The Mass of Sagittarius A*”, 2004, Astrophys. J. , (6) 16, 872
- [20] R. Schödel, T. Ott, R. Genzel, A. Eckart, N. Mouawad, & T. Alexander “Stellar Dynamics in the Central Arcsecond of Our Galaxy”, 2003, Astrophys. J. , (5) 96, 1015
- [21] Y. Ueda, et al. “Study of the Largest Multiwavelength Campaign of the Microquasar GRS 1915+105”, 2002, Astrophys. J. , (5) 71, 918
- [22] H. van der Laan “A Model for Variable Extragalactic Radio Sources”, 1966, \nat, 211, 1131
- [23] F. Yusef-Zadeh, Bushouse, H., Dowell, C. D., Wardle, M., Roberts, D., Heinke, C., Bower, G. C., Vila-Vilar, B., Shapiro, S., Goldwurm, A., Belanger, G. ““A Multiwavelength Study of Sgr A*: The Role of Near-IR Flares in Production of X-Ray, Soft -Ray, and Submillimeter Emission”, 2006a, Astrophys. J. , (6) 44, 198
- [24] F. Yusef-Zadeh, M. Morris, & R. D. Ekers “New structures near the compact radio source at the Galactic Centre”, 1990, \nat, 348, 45
- [25] F. Yusef-Zadeh, D. Roberts, M. Wardle, C. O. Heinke, & G. C. Bower “Flaring Activity of Sagittarius A* at 43 and 22 GHz: Evidence for Expanding Hot Plasma”, 2006b, Astrophys. J. , (6) 50, 189
- [26] J.-H. Zhao, K. H. Young, R. M. Herrnstein, P. T. P. Ho, T. Tsutsumi, K. Y. Lo, W. M. Goss, & G. C. Bower “Variability of Sagittarius A*: Flares at 1 Millimeter”, 2003, \apjl, 586, L29
- [27] R. Zylka, P. G. Mezger, D. Ward-Thompson, W. J. Duschl, & H. Lesch “Anatomy of the Sagittarius A complex. 4: SGR A* and the Central Cavity revisited”, 1995, \aap, 297, 83