Confirmation of New Planetary Nebulae in the Large Magellanic Cloud111Based on observations with the NASA/ESA Hubble Space Telescope, obtained at the Space Telescope Science Institute, which is operated by the Association of Universities for Research in Astronomy, Inc., under NASA contract NAS 5-26555.
Abstract
We present Hubble Space Telescope (HST) images of new planetary nebulae (PNe) that were discovered in the Reid-Parker AAO/UKST H survey of the Large Magellanic Cloud. These serendipitous observations from various HST programs yield independent confirmations of 6 PNe; one other detected nebula may also be a PN, and one appears to be a region of diffuse emission. The high resolution HST archival images enable us to determine the physical sizes, the nebular morphology, and related features of these new PNe in detail for the first time. In a few cases we were also able to identify the central star, which was impossible with the lower resolution, wide-field discovery data. The confirmation of faint, extended halos surrounding many PNe in the RP catalog must await the acquisition of new deep, high-resolution, narrow-band imagery.
1 Introduction
The study of planetary nebulae (PNe) in the Magellanic Clouds spans half a century, but it has received renewed attention in the past half decade. New discovery surveys, detailed spectroscopic studies, and a greater understanding of the Magellanic Clouds themselves has greatly increased our understanding of PNe in these systems. Studying PNe in the Magellanic Clouds offers significant advantages compared to studies of the Galactic PN populations (see e.g., Jacoby, 2003; Shaw, 2006). Chief among them is their location in systems at known distance so that large numbers of PNe can be studied in detail, and important physical parameters such as sizes and luminosities can be determined with high accuracy. The average foreground extinction to both the Large Magellanic Cloud (LMC) and Small Magellanic Cloud (SMC) is low so that large, complete, flux-limited samples may be obtained without the severe selection biases that apply in the Galaxy. Finally both systems are among the most massive in the Local Group, so that the PN populations total hundreds of objects which enables the study of statistical properties of various sub-samples. Magellanic Cloud PNe have thus been very successfully employed over the past few decades to investigate a number of very important astrophysical questions such as the form and origin of the PN luminosity function, the effects of metallicity and environment on PN properties and the late stages of stellar evolution, and as kinematical probes of the galaxies themselves (e.g., Reid & Parker, 2006b). More recently, high resolution imaging and spectroscopy have been employed to study the coevolotion of individual nebulae (Shaw et al., 2001; Stanghellini, et al., 2002, 2003; Shaw et al., 2006) and their central stars (Villaver, Stanghellini & Shaw, 2003, 2004, 2007).
Observing PNe in the Magellanic Clouds is not without its challenges, however. The fields are extremely crowded, the individual nebulae cannot be resolved in useful detail except with HST or advanced optical systems on large, ground-based telescopes, and the LMC in particular is permeated with very bright, spatially complex nebular emission from a variety of sources including H II regions, supernova remnants, and wind-blown nebulae around O-stars. In addition, the Magellanic Clouds extend over a wide area of sky. These issues complicate the task of conducting uniform, deep surveys for PNe over the full spatial extent of these galaxies. The heterogeneity of prior surveys in the spatial coverage, depth, discovery technique, and the lack of complete follow-up spectroscopy for verifying the classification have been the principal barriers to realizing the full potential of Magellanic Cloud PN studies until recently.
Recent surveys with wider areal coverage, uniform depth, and greatly increased sensitivity have been published by Jacoby & De Marco (2002) for the SMC and by Reid & Parker (2006a, b) for the LMC; another in the LMC is underway (Smith, 1999). See Jacoby (2003) and Parker (2006) for recent reviews of these and other surveys. We focus in this paper on PNe in the LMC, the known population for which has increased greatly with the publication of an extensive catalog by Reid & Parker (2006a, b, hereafter referred to as the RP catalog). The RP catalog is based upon both a deep photographic survey in H and in red continuum of the central 25 square degrees of the LMC, and upon follow-up confirmatory spectroscopy. In all, 460 new objects were classified as PNe with varying degrees of confidence: a thorough analysis of optical emission line ratios, nebular morphological features, prominence of the continuum, and the inferred degree of contamination from background sources, resulted in 292 objects being classified by Reid & Parker (2006a, b) as “true” PNe, 54 as “likely,” and 114 as “possible.” The lack of complete certainty in the PN classification is in part due to the similarity of emission line ratios between very low excitation (VLE) PNe and other kinds of objects, and also to strong, diffuse H II emission or strong contaminating continuum emission in the immediate vicinity of some objects.
The thrust of this study was to search the HST archive for images that might contain any of the new RP catalog objects, and to use any detections to illuminate a) the veracity of the PN designations, particularly for cases were the classifications in the RP catalog were uncertain, b) the nebular dimensions and morphological features, c) the location and characteristics of the central stars, and d) strategies for follow-up observations of the RP sample. In §2, we describe the RP catalog of LMC PNe and the survey upon which it is based, and then describe the observational data extracted from the HST archive that matches the new sources in the RP catalog. The individual objects are described in §3, along with an analysis of non-detections. In §4 we discuss the implications of these data for future observing programs.
2 Observational Data
The surveys upon which the RP catalog of LMC PNe is based, the observing strategies, the discovery technique, the follow-on spectroscopy, and the classification schema are all described by (Reid & Parker, 2006a, b). We summarize in the next subsection some of the key features of the RP survey and discovery images in enough detail to explain the comparison to the serendipitous HST images. Following that we describe the attributes of the HST observations, the reduction procedures, and our analysis of the data.
2.1 AAO/UKST H Deep Stack Images
A photographic mini-survey of 40 fields in and around the Magellanic Clouds was undertaken as part of the Anglo-Australian (AAO)/UKST H survey of the Southern Galactic Plane and Magellanic Clouds (Parker et al., 2005). In addition, a separate, deep AAO/UKST photographic survey of the central 25 square degrees of the central bar of the LMC was also undertaken by Q. Parker and D. Morgan between 1998 and 2000. Twelve well-matched, 2 hour H exposures and six 15 min equivalent short red (SR) broad-band exposures on this field were taken for the purpose. The images were scanned by the “SuperCOSMOS” measuring machine at the Royal Observatory Edinburgh (Hambly et al., 2001), and the resulting digitized images were placed on a common world coordinate system and co-added. The photometric depth is 21.5 mag for the SR images and 22 mag for H (or in units of flux density, erg cm-2 s-1 Å-1). The pixel size of the scanned images is 10m (067) which samples the image sufficiently well to resolve compact nebulae larger than 35 in diameter. Spurious detections such dust particles were effectively removed through the median-stacking of the individual exposures taken over a 3 year period while the influence of variable stars was considerably abated. This new H map led directly to the discovery of a significant new population of LMC emission sources, including the many new PNe that comprise the Reid-Parker catalog of LMC PNe.
Candidate emission sources were identified using an adaptation of a technique available within the KARMA collaboration (Gooch, 1996) which is fully described by Reid & Parker (2006a). The stacked SR and H images were each assigned a specific color: red for SR and blue for H. The colored images were then merged, resulting in a pink color for continuum sources, whereas compact or point source emitters develop a blue aura around a pink core whose relative size depends on the intensity of the emission. Extended nebulae, including H II regions, supernova remnants, super-bubbles and resolved, faint PNe can appear solely blue on an otherwise dark background. Many of the PNe are only visible as blue features in the false-color image. Most PNe central stars however are too faint, and the resolution too poor in the ground based UKST images, to be detected. A variety of telescopes and instruments were employed for spectroscopic follow-up including FLAMES on the Very Large Telescope (VLT) UT2, the 1.9-m telescope at the South African Astronomical Observatory, the 2.3-m telescope at Siding Spring Observatory, and 6dF on the UKST. However, the vast majority were confirmed using 2dF on the Anglo Australian Telescope (AAT) in 2004 December (see Reid & Parker, 2006b).
2.2 AAO 2dF Fiber Spectra
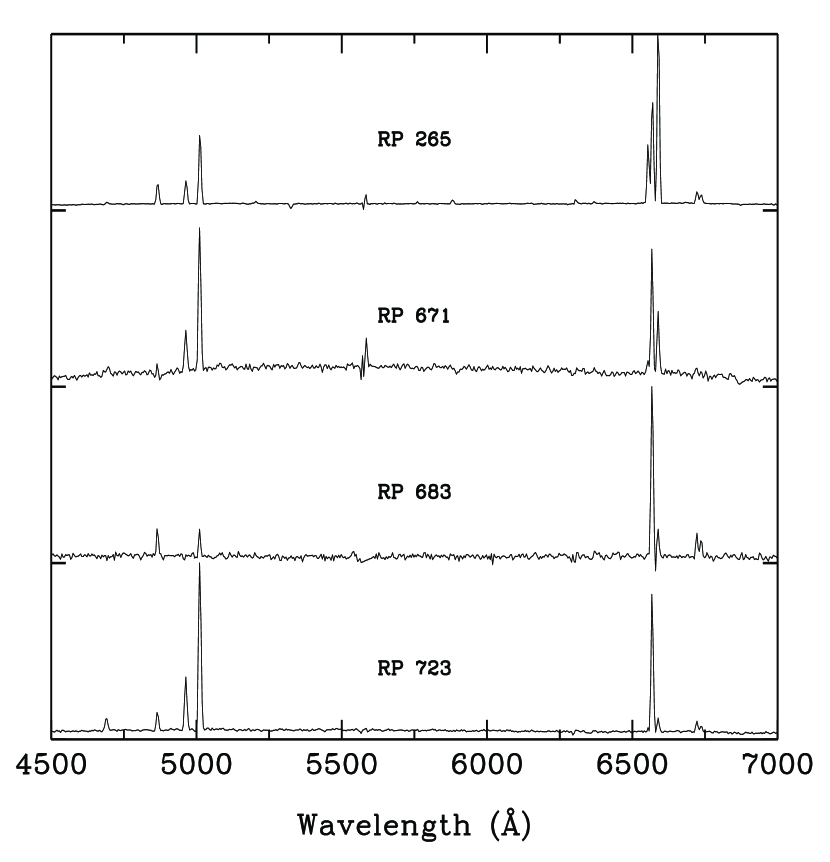
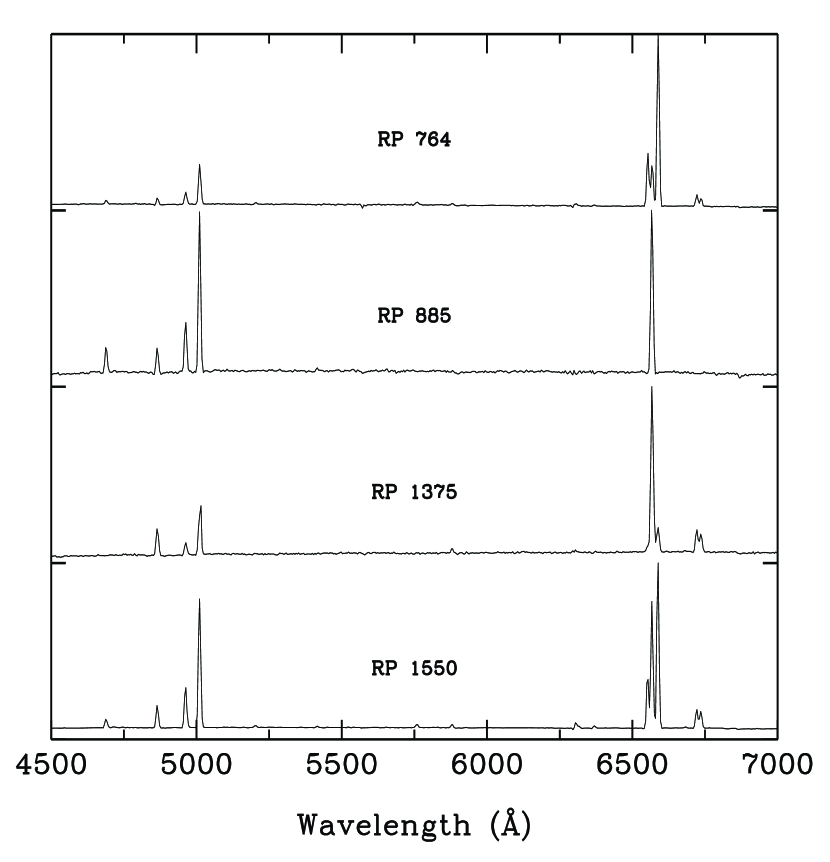
Confirmatory spectra were obtained for nearly every object in the RP catalog (Reid, 2006). All of the spectra for the objects presented here were obtained with the AAO 2dF spectrograph on the AAT, which is capable of obtaining more than 400 simultaneous spectra, using a 300 line mm-1 grating to cover the spectral range 3650–8050ÅÅ with a dispersion of 4.3 Å pixel-1. The spectra were corrected for detector bias, extracted, and sky-subtracted. The wavelength calibration was performed with the aid of comparison arcs taken during the course of the observations, but no flux calibration was performed. See Reid & Parker (2006b) and Reid (2006) for details of the reductions. The spectrograms are shown in Figures 1 and 2; the flux scale is in instrumental units.
2.3 HST Images
Our search of the HST archive (conducted in 2006 June) identified nearly 200 images that were coincident with 19 of the newly discovered PNe candidates in the RP catalog, or about 4.0% of the sample of new PNe. Such a high number of serendipitous observations is due in large part to the popularity of the Magellanic Clouds for various HST research programs, particularly for stellar populations. Many additional exposures were obtained through pure parallel programs. Although the majority of the objects were observed with more than one filter, more often than not these were broad-band filters which were not well suited for detecting emission line nebulae, in that they do not include the strongest nebular emission lines within the bandpass. However, when available these filters were useful for identifying extremely blue stars in the vicinity, which aided the identification of the likely source of the nebular ionization. Fortunately, some of the archival images that match RP catalog positions were taken through more suitable filters. The WFPC2/F300W bandpass includes nebular [O II] and [Ne III] emission when present, but the system efficiency is quite low. The F555W filter includes H and the strong [O III] emission lines, plus H + [N II] at lower efficiency. F606W, which has the highest overall system efficiency, includes the [O III], H, and [N II] emissions mentioned above. The clearest detections were made with the F656N filter (which includes some [N II] emission in the wing), but this filter is not as often used.
The HST images presented here were obtained using the Wide-Field Planetary Camera 2 (WFPC2) or the Advanced Camera for Surveys (ACS). These images were calibrated with the standard reduction pipelines for the instruments used to obtain them. The pipelines perform similar processing: bias correction, dark scaling and subtraction, and flat-fielding. The ACS pipeline also performs a geometric rectification. For many of the objects, multiple exposures were obtained at or near the same location with the same instrument and filter combination. Typically this is done to facilitate the identification and rejection of cosmic rays, to mitigate the effects of detector defects such as charge traps or high dark current, or (in the case of WFPC2) to improve the spatial sampling by dithering the image. These images were combined when possible. For WFPC2 many pre-combined images are available from the Multi-mission Archive at STScI (MAST) as high level science products (HLSP). Wadadekar, et al. (2006) describe the details of this processing, as well as the quality of the photometry of the resulting images. For the present purpose we are concerned primarily with determining precise coordinates, sizes, and morphologies of the new RP nebulae, so that the accuracy of the reductions is not critical. However we did combine images taken with the same filter, when possible, to eliminate cosmic rays and to improve the signal-to-noise ratio for presentation. The HST observing log for all nebulae is presented in Table 1. The first column lists the RP designation, followed by the confidence with which Reid & Parker (2006b) could establish the target as a genuine PN based on their imaging and confirmatory spectroscopy, followed by their estimate of the diameter of the nebular shell. This information is followed in the next two columns by the HST observing configuration, followed by the exposure time and whether extended emission was detected. The last column lists the dataset identifiers in the MAST archive, which corresponds to high-level science products (i.e., combined images as generated through, e.g., the WFPC2 Archival Pure Parallels Project pipeline) where available.
3 Dimensions and Morphology for the Matched Sources
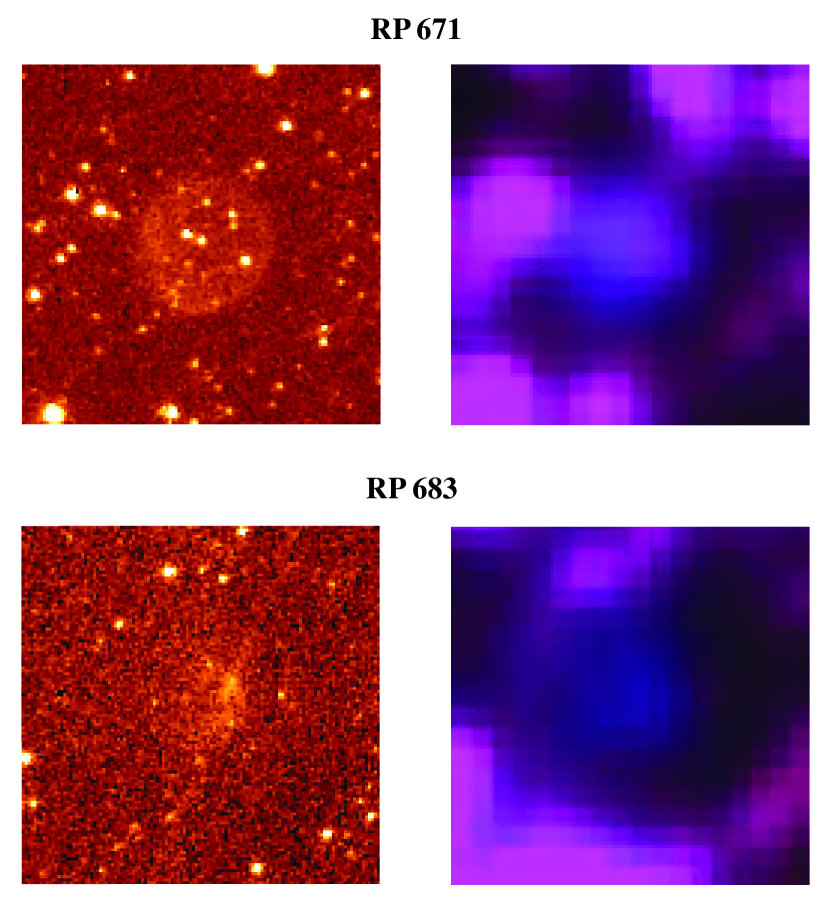
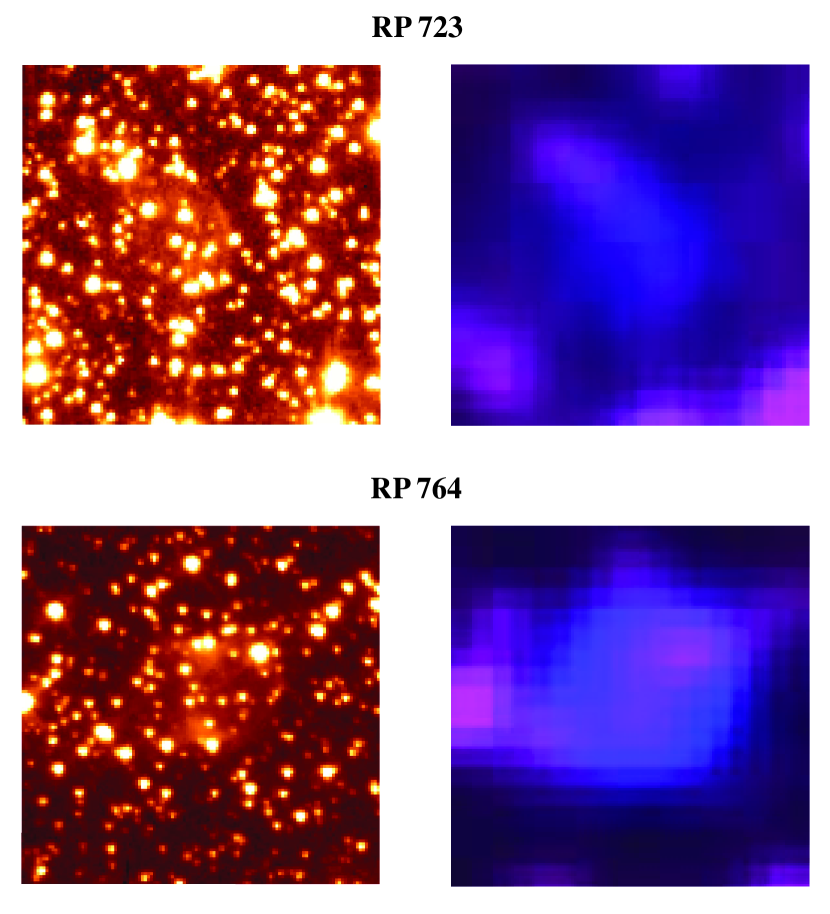
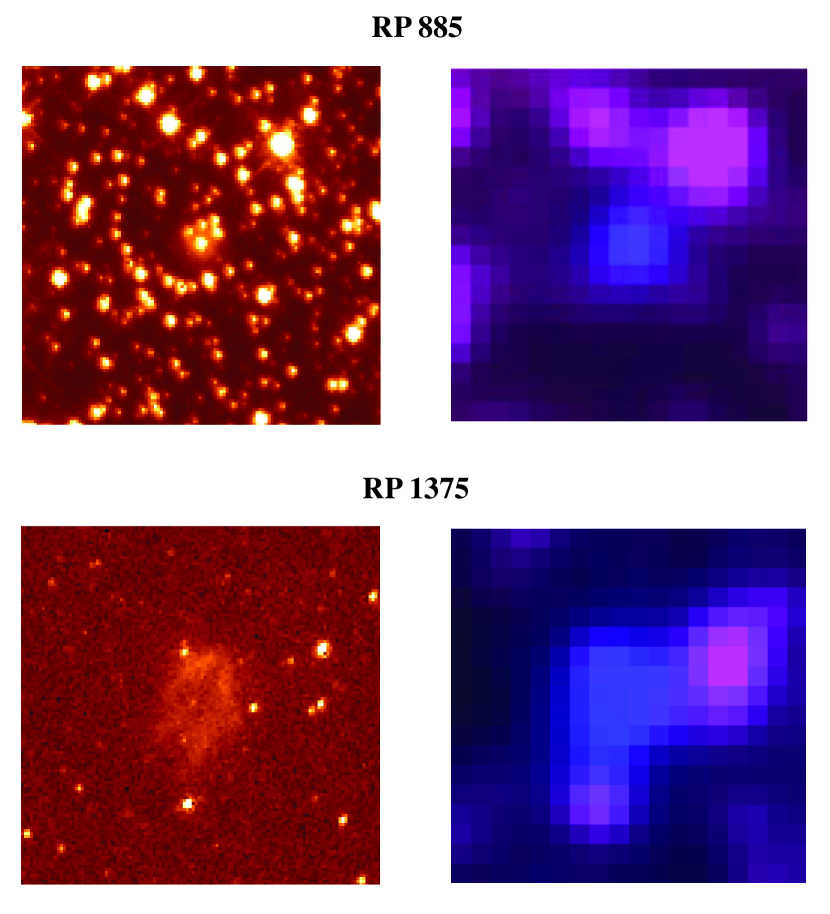
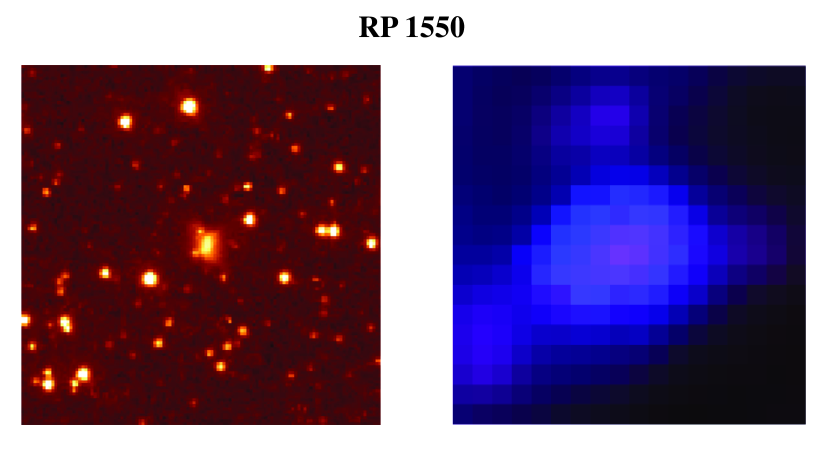
The HST and matching RP catalog images for the detected nebulae are presented in Figures 3 through 6, where for each object we show both the UKST discovery image and the HST image on the same spatial scale. All of the images are rendered in false-color, usually with a square-root intensity scale, in order to bring out the often faint structural features of the nebulae. In spite of the generally low signal-to-noise (S/N) ratio in the HST images (which, after all, were not obtained for this purpose), we were able to confirm several of the objects as genuine PNe. Furthermore the 01 resolution of the HST images permits a solid morphological classification to be assigned, which is not possible from the Reid & Parker (2006b) data. The morphological classifications would ordinarily be based on the appearance of the nebula in the monochromatic light of either [O III] or H (possibly including [N II] ). Although WFPC2 monochromatic emission-line images are only available for three of the objects, Shaw et al. (2006) point out that the principal, larger scale morphological features can generally be inferred from other emission lines with some confidence. We used the same classification scheme as those of Shaw et al. (2001, 2006) and Stanghellini, et al. (2002, 2003), where the morphological types of relevance here are: round (R), elliptical (E), and bipolar (B). Other important structural features, such as attached shells, were noted as well.
Table 2 gives detailed information for the PNe presented here. The equatorial J2000 sky coordinates, as measured from the HST images, are given in columns (2) and (3). These coordinates correspond to either the geometric centroid of the nebula or, in three cases, the newly identified central stars. They agree to within 1″ with the (likely more accurate) RP positions, which is consistent with the accuracy of the HST guide star frame of reference (GSC 1.1, Morrison et al., 2001). Nebular diameters along the major and minor axes, given in column (4), were usually measured with respect to the 20% intensity contour of the outermost structure that was visible in the HST image. The dimensions given in Table 2 are generally smaller than those cited by Reid & Parker (2006b). The reasons for the discrepant sizes are varied: a) Nebulae smaller than 34 were not resolved in the RP data; b) one or more nebulae (probably including RP1550) are surrounded by faint, outer shells or halos that are not detected in these HST exposures; c) differing measurement techniques were employed: here we prefer the 20% intensity contour, in part because of the limited S/N ratio of the HST data and the impracticality of measuring a photometric radius, whereas Reid & Parker (2006b) measured the full width at zero intensity in monochromatic light; d) nebulae embedded in a bright continuum were problematic to measure in the RP images owing to the response of the photographic media, as explained by Reid & Parker (2006b). Our assessment of whether the object is a genuine PN is given in column (5), and the nebular morphological classification is given in column (6). Column (7) contains specific notes about each object, including whether a central star was identified.
3.1 Detected Objects
As discussed in the previous section, extended emission was detected in the HST archival images for eight RP catalog objects. We describe here the morphological details and noteworthy spectral features for each of the nebulae listed in Table 2.
LMC–RP 265.—The HST image for this object was presented by Shaw et al. (2006). Although it is extremely faint, it is probably a bipolar. The spectrum in Figure 1 indicates a moderate excitation, owing to the modest [O III]/H ratio and weak He II 4686 emission. The very strong [N II]/H ratio is consistent with the strong nebular bi-polarity (Shaw et al., 2006).
LMC–RP 671.—This object is confirmed as an extremely low surface brightness PN. It is very apparent in the combined 5000 s exposure with the WFPC2/F656N filter, but it is barely detected in F450W and F606W images. This nebula is large, nearly perfectly round, and is similar in appearance to many Galactic Abell PNe (see Figure 3). The central star is near the geometric center of the nebula, and is easily identified through its color. The spectrum in Figure 1 indicates a fairly high excitation, with a large [O III]/H ratio and relatively strong He II 4686 emission, which is consistent with an advanced evolutionary state for this star + nebula.
LMC–RP 683.—This apparently diffuse nebula may be ionized by one or more of a number of very blue stars (judging from the colors) that lie within 10″, one of which lies within (or is projected onto) the nebulosity. RP categorize this object as only a “possible” PN, and also a very low excitation (VLE) object given that the intensity of H is similar to that of [O III] (see Figure 1). Given the morphology evident in the HST imagery (Figure 3) it is unlikely that this object is a genuine PN.
LMC–RP 723.—This object is an extremely low surface brightness PN. It is very faint in the moderate-length exposure with the WFPC2/F555W filter. The nebula is round, although the western limb is brighter and has a more sharply defined edge (see Figure 4). The likely central star appears to be near the geometric center of the nebula, and is tentatively identified through its color. The spectrum in Figure 1 indicates a fairly high excitation, with a large [O III]/H ratio and relatively strong He II 4686 emission.
LMC–RP 764.—This object is clearly a bipolar PN and is similar in appearance to the Dumbbell nebula (see Figure 4). The identification of the central star is puzzling: based on the F330W image, a star at the northwest edge of the nebula is by far the bluest in the image, and is the best candidate. The spectrum in Figure 2 indicates a moderate level of excitation, with a moderate [O III]/H ratio and finite He II 4686 emission. The very strong [N II]/H ratio (more than 4:1) is consistent with the strong nebular bi-polarity (Shaw et al., 2006).
LMC–RP 885.—This object is confirmed as a round, faint PN. It has a main shell of pc in diameter, and has an attached shell that is twice as large but fainter by a factor of at least 3 (see Figure 5). The central star is relatively bright. The spectrum in Figure 2 indicates a very high excitation, with a large [O III]/H ratio and very strong He II 4686 emission. The absence of [N II] emission suggests that N is very under-abundant, which is consistent with the nebular morphology.
LMC–RP 1375.—The extremely low surface brightness of this object makes a definitive classification as a PN difficult, in spite of the lengthy exposure time in the WFPC2/F656N filter, but it could be a genuine PN. The morphological classification is very uncertain: the overall shape is elliptical, but it has internal structure that suggests a bipolar core (see Figure 5). The central star might be the star near the geometrical center of the nebula, but no other passbands are available for confirmation. The spectrum in Figure 2 show a low level of excitation, with a low [O III]/H ratio, no He II 4686 emission, but weak He I 5876 emission.
LMC–RP 1550.—Despite the relatively small angular size this object is confirmed as a bipolar PN, even with the short exposure time in the WFPC2/F555W filter (see Figure 6). No central star is evident in the image. The spectrum in Figure 2 indicates a moderately high level of excitation, with a high [O III]/H ratio and moderate He II 4686 emission. The strong [N II]/H ratio is consistent with the strong nebular bi-polarity (Shaw et al., 2006).
3.2 Non-Detections
Of the 19 RP sources that were imaged with HST, extended emission was not detected around eleven of the targets. It is useful to consider whether the non-detections are significant, particularly for RP sources classified as “possible” PNe. In most cases the non-detections can be attributed either to very brief exposure times of less than a minute (3 objects: RP307, RP1759, RP2180), or to the use of filters that do not include strong nebular emission lines (4 objects: RP232, RP241, RP1443, RP1580). In three other cases, it is possible that the nebular emission is extended, but with a surface brightness that is lower than the detection threshold in the HST image. To explore this possibility, we make use of the nebular diameters from Reid & Parker (2006b), the empirical relation of the decline of average [O III] surface brightness with radius from Shaw et al. (2006), and assuming the [O III] flux is comparable in intensity to H. The exposure time calculator for ACS (scaling by the relative efficiency for WFPC2 images where necessary) provides some indication of whether extended emission in the remaining objects might have been detectable, given the above assumptions. In one case, RP218, the average surface brightness would have been far below the detection threshold for WFPC2/F606W. But for two objects we might have expected to detect extended emission: RP203 with a signal-to-noise (S/N) ratio of about 2, and RP268 with a S/N ratio of about 4. Given the dispersion in the surface brightness relation and in the other assumptions, it is easily possible that the emission from RP203 and RP268 is extended, but with an emissivity that lies just below the detection threshold. For RP505 the extremely weak confirmation spectrum lead Reid & Parker (2006b) to classify it as only a “Possible” PN that is not resolved in their images. It may be that this object is a faint, diffuse nebula like RP683.
4 Discussion and Summary
Our search of the HST archive for serendipitous observations of new LMC PN candidates in the RP emission-line survey has resulted in the independent confirmation of 8 extended emission objects, 6 of which can be confirmed as genuine PNe including one that was independently confirmed as a PN by Shaw et al. (2006). There is also one source, RP1375, where Reid & Parker (2006b) classified it as a “possible” PN and the morphology from the HST image is uncertain. Finally, RP683 is a region of diffuse emission that may be an H II region; but which was only classed as a possible VLE PN by Reid & Parker (2006b). The central stars can be readily identified in four of the PNe, and possibly in a fifth. Perhaps as importantly, it is very clear from the HST images the degree of crowding of stars in the vicinity of each object, which will guide the strategy of follow-up studies. We found HST images of fields surrounding an additional 11 RP objects, but no extended emission was detected at the published coordinates. A close examination shows that the non-detections can always be explained by a combination of inappropriate filters and exposures of insufficient depth to reach the anticipated nebular surface brightness.
All of the RP nebulae identified here are faint and most have very low average surface brightness, which are characteristics common to many of the new PNe in the RP catalog. While these serendipitous, high-resolution images provide a useful validation of the PN morphological classifications, they did not prove to be very useful for detecting or validating the faint, outer shells or halos that Reid & Parker (2006b) found for nearly 60% of all PNe in their catalog. Even in the extensive, targeted surveys by Shaw et al. (2001, 2006) and Stanghellini, et al. (2002, 2003) faint halos were seldom detected. Very much deeper exposures with 01 resolution will be required to study and understand these features in any detail. Still, the images in this study are another useful step in our understanding of the nature and evolution of planetary nebulae in the LMC.
References
- Bland-Hawthorn, Shopbell & Malin (1993) Bland-Hawthorn, J., Shopbell, P. L., Malin, D. F. 1993, AJ, 106, 2154B
- Gooch (1996) Gooch R. 1996, in A.S.P. Conference Series, Vol. 101, Astronomical Data Analysis Software and Systems V, eds. G. H. Jacoby & J. Barnes (San Francisco: ASP), 80.
- Hambly et al. (2001) Hambly, N. C., et al. 2001, MNRAS, 326, 1279H
- Jacoby (2003) Jacoby, G. H. 2003, in Planetary Nebulae Beyond the Milky Way, ed. L. Stanghellini, J. Walsh, & N. G. Douglas (Berlin: Springer), 17
- Jacoby & De Marco (2002) Jacoby, G. H., & De Marco, O. 2002, AJ, 123, 269
- Morrison et al. (2001) Morrison, J. E., Roser, S., McLean, B., Bucciarelli, B., & Lasker, B. 2001, AJ, 121, 1752
- Parker et al. (2005) Parker Q.A., et al. 2005, MNRAS, 362, 689
- Parker (2006) Parker, Q. 2006, in IAU Symp. 234, Planetary Nebulae in Our Galaxy and Beyond, ed. M.J. Barlow & R.H. Mendez (Cambridge, UK: Cambridge Univ. Press), in press
- Reid (2006) Reid, W.A. 2006, Ph.D. Thesis, in prep.
- Reid & Parker (2006a) Reid, W. A., & Parker, Q. A. 2006, MNRAS, 365, 401
- Reid & Parker (2006b) Reid, W. A., & Parker, Q. A. 2006, MNRAS, in press
- Shaw (2006) Shaw, R. A. 2006, in IAU Symp. 234, Planetary Nebulae in Our Galaxy and Beyond, ed. M.J. Barlow & R.H. Mendez (Cambridge, UK: Cambridge Univ. Press), in press
- Shaw et al. (2001) Shaw, R. A., Stanghellini, L., Mutchler, M., Balick, B., & Blades, J. C. 2001, ApJ, 548, 727
- Shaw et al. (2006) Shaw, R. A., Stanghellini, L., Villaver, E., & Mutchler, M. 2006, ApJS, 167, in press
- Smith (1999) Smith, R. C. 1999, in IAU Symp. 190, New Views of the Magellanic Clouds, ed. Y.-H. Chu, N.B. Suntzeff, J.E. Hesser, & D.A. Bohlender (San Francisco: ASP), 28
- Stanghellini, et al. (2002) Stanghellini, L., Shaw, R. A., Mutchler, M., Palen, S., Balick, B., & Blades, J. C. 2002, ApJ, 575, 178
- Stanghellini, et al. (2003) Stanghellini, L., Shaw, R. A., Balick, B., Mutchler, M., Blades, J. C., & Villaver, E. 2003, ApJ, 596, 997
- Villaver, Stanghellini & Shaw (2003) Villaver, E., Stanghellini, L., & Shaw, R. A. 2003, ApJ, 597, 298
- Villaver, Stanghellini & Shaw (2004) Villaver, E., Stanghellini, L., & Shaw, R. A. 2004, ApJ, 614, 716
- Villaver, Stanghellini & Shaw (2007) Villaver, E., Stanghellini, L., & Shaw, R. A. 2007, ApJ, 655, in press
- Wadadekar, et al. (2006) Wadadekar, Y., Casertano, S., Hook, R., Kiziltan, B, Koekemoer, A., Ferguson, H., & Denchev, D. 2006, PASP, 118, 450
| RP | RP Diam. | Instrument/ | TExp | Nebula | |||
|---|---|---|---|---|---|---|---|
| Nebula | Certainty | (arcsec) | Aperture | Filter | (s) | Detected | Dataset |
| LMC–RP 203 | True | 9.0 | ACS/WFC1 | F555W | 250 | No | J8NE75IDQ |
| F814W | 170 | No | J8NE75J2Q | ||||
| LMC–RP 218 | Possible | 14.0 | WFPC2/WFALL | F606W | 2x700 | No | U8IXN301M |
| LMC–RP 232 | Likely | 6.0 | WFPC2/WFALL | F450W | 240 | No | U4WOEM02BaaMAST high-level science product, composed of multiple exposures. |
| F450W | 440 | No | U4WOEM04BaaMAST high-level science product, composed of multiple exposures. | ||||
| F814W | 600 | No | U4WOEM06BaaMAST high-level science product, composed of multiple exposures. | ||||
| F300W | 640 | No | U4WOEM08BaaMAST high-level science product, composed of multiple exposures. | ||||
| LMC–RP 241 | Possible | 6.0 | WFPC2/WFALL | F300W | 3660 | No | U2OU7N01baaMAST high-level science product, composed of multiple exposures. |
| LMC–RP 265bbExtended emission detected in at least one filter. | True | WFPC2/WFALL | F606W | 240 | Yes | U4WOEM02BaaMAST high-level science product, composed of multiple exposures. | |
| F450W | 340 | No | U4WOE704BaaMAST high-level science product, composed of multiple exposures. | ||||
| F814W | 500 | No | U4WOE706BaaMAST high-level science product, composed of multiple exposures. | ||||
| F300W | 440 | No | U4WOE708BaaMAST high-level science product, composed of multiple exposures. | ||||
| LMC–RP 268 | Possible | 4.0 | WFPC2/WFALL | F606W | 2x300 | No | U4K2CQ01R |
| LMC–RP 307 | Possible | 4.0 | ACS/HRC | F220W | 20 | No | J8QZ02011 |
| F435W | 10 | No | J8QZ02021 | ||||
| LMC–RP 505 | Possible | 2.3 | WFPC2/WFALL | F606W | 240 | No | U4WOE202BaaMAST high-level science product, composed of multiple exposures. |
| LMC–RP 671bbExtended emission detected in at least one filter. | True | 5.4 | WFPC2/WFALL | F606W | 1600 | Marginal | U4WODE04BaaMAST high-level science product, composed of multiple exposures. |
| F300W | 5100 | No | U4WODE04BaaMAST high-level science product, composed of multiple exposures. | ||||
| F450W | 2210 | Marginal | U4WODE07BaaMAST high-level science product, composed of multiple exposures. | ||||
| F814W | 3020 | No | U4WODE0CBaaMAST high-level science product, composed of multiple exposures. | ||||
| F656N | 5000 | Yes | U4WODE0IBaaMAST high-level science product, composed of multiple exposures. | ||||
| LMC–RP 683bbExtended emission detected in at least one filter. | Possible (VLE) | 4.0 | WFPC2/WFALL | F606W | 3500 | Marginal | U6GZOE01MaaMAST high-level science product, composed of multiple exposures. |
| F656N | 1400 | Yes | U4WOFY0ABaaMAST high-level science product, composed of multiple exposures. | ||||
| F300W | 7300 | No | U6GZOE02MaaMAST high-level science product, composed of multiple exposures. | ||||
| F450W | 1800 | Marginal | U4WOFZ04MaaMAST high-level science product, composed of multiple exposures. | ||||
| F814W | 1760 | No | U4WOFZ06MaaMAST high-level science product, composed of multiple exposures. | ||||
| LMC–RP 723bbExtended emission detected in at least one filter. | True | 4.7 | WFPC2/WFALL | F439W | 4x400 | Marginal | U4ZN0502B |
| F555W | 4x400 | Yes | U4ZN050BR | ||||
| F675W | 820 | No | U4ZN0506B | ||||
| F814W | 1020 | No | U4ZN0508B | ||||
| LMC–RP 764bbExtended emission detected in at least one filter. | True | 6.0 | WFPC2/WFALL | F606W | 500 | Yes | U8UOUO01M |
| F606W | 500 | Yes | U8UOUQ01M | ||||
| F300W | 1500 | Marginal | U8UOUO02M | ||||
| F300W | 1500 | Marginal | U8UOUQ02M | ||||
| LMC–RP 885bbExtended emission detected in at least one filter. | True | 3.4 | WFPC2/WFALL | F555W | 3700 | Yes | U2O90104BaaMAST high-level science product, composed of multiple exposures. |
| F814W | 3900 | Marginal | U2O90105BaaMAST high-level science product, composed of multiple exposures. | ||||
| LMC–RP 1375bbExtended emission detected in at least one filter. | Possible | 3.4 | WFPC2/WFALL | F656N | 2070 | Yes | U4KY0805R |
| LMC–RP 1443 | True | 6.0 | WFPC2/WFALL | F547M | 40 | No | U26M1202T |
| LMC–RP 1550bbExtended emission detected in at least one filter. | True | 7.0 | WFPC2/WFALL | F555W | 80 | Yes | U69W0102R |
| LMC–RP 1580 | True | 3.0 | WFPC2/WFALL | F547M | 800 | No | U64B0601BaaMAST high-level science product, composed of multiple exposures. |
| LMC–RP 1759 | True | 6.0 | WFPC2/WFALL | F555W | 20 | No | U26M1B02P |
| F450W | 40 | No | U26M1B01P | ||||
| LMC–RP 2180 | Likely | 10.1 | ACS/WF1 | F555W | 20 | No | J8NE68REQ |
| F814W | 20 | No | J8NE68RIQ |
| R.A. | Decl. | Diameter | Object | Morph. | ||
|---|---|---|---|---|---|---|
| Nebula | J(2000) | (J2000) | (arcsec) | Class | Class | Notes |
| (1) | (2) | (3) | (4) | (5) | (6) | (7) |
| LMC–RP 265 | 5 37 00.72 | 21 29.1 | PN | B? | ||
| LMC–RP 671 | 5 26 11.28 | 16 05.6 | 4.78 | PN | R | CS identified |
| LMC–RP 683 | 5 36 36.07 | 07 05.3 | H II reg.? | Diffuse emission | ||
| LMC–RP 723 | 5 25 04.66 | 48 33.3 | 3.2 | PN | R | CS identified |
| LMC–RP 764 | 5 26 16.35 | 38 01.9 | 2.77 3.70 | PN | B | CS tentative identification |
| LMC–RP 885 | 5 24 13.62 | 47 23.7 | 1.1 | PN | R | Attached shell is 22; CS identified |
| LMC–RP 1375 | 5 18 15.09 | 16 22.2 | PN? | E? | Diam. w.r.t. 10% contour | |
| LMC–RP 1550 | 5 08 49.70 | 44 05.6 | 1.11 1.24 | PN | B |