Resolving the Galactic X-ray background
We use Chandra deep observations of the Galactic Center (GC) region to improve the constraints on the unresolved fraction of the Galactic X-ray background (also known as the Galactic ridge X-ray emission). We emphasize the importance of correcting the measured source counts at low fluxes for bias associated with Poisson noise. We find that at distances of – from Sgr A∗ at least % of the total X-ray emission in the energy band 4–8 keV originates from point sources with luminosities erg s-1. From a comparison of the source number-flux function in the GC region with the known luminosity function of faint X-ray sources in the Solar vicinity, we infer that Chandra has already resolved a large fraction of the cumulative contribution of cataclysmic variables to the total X-ray flux from the GC region. This comparison further indicates that most of the yet unresolved % of the X-ray flux from the GC region is likely produced by weak cataclysmic variables and coronally active stars with erg s-1. We conclude that the bulk of the Galactic X-ray background is produced by discrete sources.
Key Words.:
stars: binaries: general – Galaxy: bulge – Galaxy: disk – X-rays: general – X-rays: stars1 Introduction
One of the largest extended features of the X-ray sky is the Galactic X-ray background, often referred to as the Galactic ridge X-ray emission (GRXE hereafter), discovered in the late 1970’s (Cooke, Griffiths, & Pounds 1970; Bleach et al. 1972; Worrall et al. 1982). The GRXE extends over more than 100 degrees along the Galactic plane but only a few degrees across it (e.g., Warwick et al. 1985; Yamauchi & Koyama 1993).
The origin of the GRXE is the topic of a long-standing debate. The GRXE spectrum resembles the optically thin emission of thermal plasma with a temperature of 5–10 keV (e.g. Koyama et al. 1986, 1989). However, such hot plasma cannot be gravitationally bound to the Galaxy, as suggested by strong concentration of the GRXE towards the Galactic disk and bulge. A number of models, still assuming a diffuse origin of the GRXE, were proposed (see e.g. the review by Tanaka 2002), but none of them was successful in explaining all of observed properties of the GRXE.
An alternative explanation of the GRXE, proposed soon after its discovery, is that it is the superposition of weak Galactic X-ray sources (e.g. Worrall et al. 1982; Worrall & Marshall 1983; Koyama et al. 1986; Ottmann & Schmitt 1992; Mukai & Shiokawa 1993). However, until recently there remained a large uncertainty with regard to the expected contributions of different classes of faint Galactic X-ray sources to the GRXE.
In recent work of Revnivtsev et al. (2006), Revnivtsev, Molkov, & Sazonov (2006), and Krivonos et al. (2006), based on X-ray observations from the RXTE and INTEGRAL satellites, it was demonstrated that the GRXE closely traces the near-infrared emission and consequently the stellar mass distribution in the Galaxy. Furthermore, the observed GRXE to stellar mass ratio is compatible with the X-ray luminosity function of cataclysmic variables and coronally active stars in the vicinity of the Sun, measured with RXTE and ROSAT (Sazonov et al. 2006). These findings therefore suggest that the bulk of the GRXE could indeed be produced by emission from descrete sources (Revnivtsev et al. 2006).
A straightforward way to test the origin of the GRXE is to check which fraction can be resolved into discrete sources in deep Chandra images. The first such study was by Ebisawa et al. (2001, 2005) who used a ks Chandra observation of a Galactic plane region. They inferred that less than 15% of the GRXE in that region could be resolved into point sources with fluxes higher than (3–5) erg s-1 cm-2.
Perhaps the best place for studying the Galactic X-ray background is the Galactic Center (GC) region, because: 1) the GRXE spectrum in this region is fairly typical (e.g., Tanaka 2002), 2) the GRXE intensity is so high that the contribution of the extragalactic X-ray and the instrumental backgrounds is very low, and 3) the high concentration of X-ray sources near the GC implies that most of them are within the Galactic nuclear stellar cluster and thus at the known distance from the Sun; this allows one to easily convert the source relation to the intrinsic luminosity function. A disadvantage of the GC region for the GRXE studies is the presence of a large number of supernova remnants and different types of non-thermal phenomena (Muno et al. 2004; Park et al. 2004).
Chandra has accumulated a long exposure time in the several arcmin2 near the GC. Previous analyses of the combined ksec worth of data (Muno et al. 2003, 2004; Park et al. 2004) have shown that –30% of the total X-ray flux can be resolved into point sources in a sub-region that is maximally free from supernova remnants (region “Close” in Muno et al. 2004). Since these works, an additional 330 ksec of GC observations have become available, which allows one to go deeper in resolving the Galactic X-ray background. In this paper, we analyze all publicly available Chandra data in the GC region in an attempt to resolve as much of the GXRE as possible.
2 Data reduction
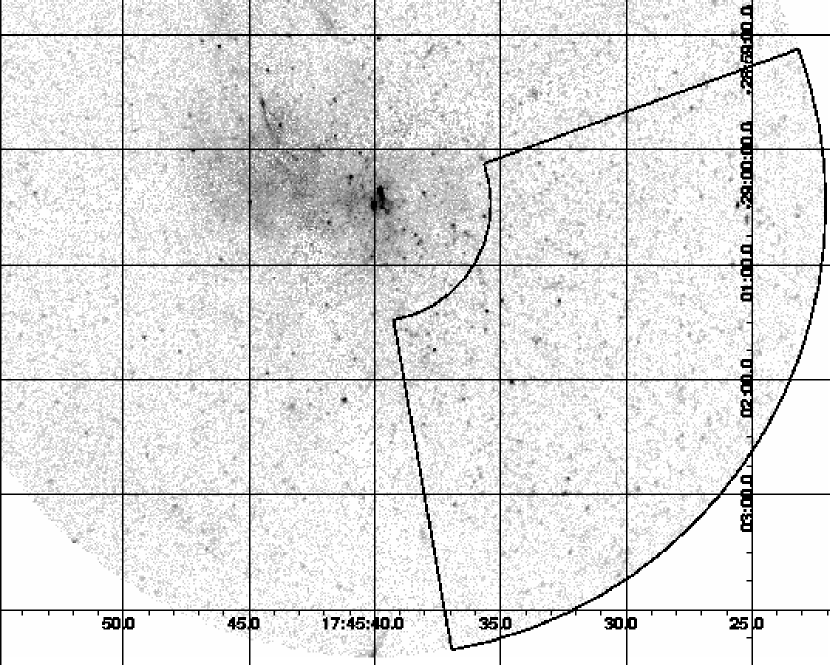
We used Chandra ACIS-I observations of the GC region with the aim point close to Sgr A∗ (observation ID #945, 1561, 2282, 2284, 2287, 2291, 2293, 2943, 2951, 2952, 2953, 2954, 3392, 3393, 3663, 3665, 4500, 4683, 4684, 5360, and 6113). The Chandra data were reduced following a standard procedure fully described in Vikhlinin et al. (2005). The only difference is that the detector background was modeled using the stowed dataset (http://cxc.harvard.edu/contrib/maxim/stowed). The total clean exposure time is 918 ks. Figure 1 shows the combined image in the 4–8 keV energy band 4–8 keV.
The GC region is known to be rich in supernova remnants (see e.g. Park et al. 2004; Muno et al. 2004). In order to minimize the contribution of X-ray emission from plasmas heated by the supernova remnants, in our analysis we: 1) considered only a sub-region to south-west of the GC (see Fig. 1), subtending 9.77 arcmin2, where the contribution of low-temperature plasmas is known to be small from the weakness of low-energy X-ray lines (see e.g. Park et al. 2004) and 2) used only the energy band 4–8 keV.
To maximize the sensitivity to point sources, we used only the data within from the optical axis, where the Chandra angular resolution is within (FWHM). Using a stacked image of bright ( cnts) sources, we verified that the effective Point Spread Function (PSF) in the combined image can be well modeled as a Gaussian with .
3 Source counting strategy
To determine the total point source flux we cannot simply coadd the observed counts from detected sources, because of strong statistical biases discussed below. A better approach is to integrate the reconstructed function down to the sensitivity limit.
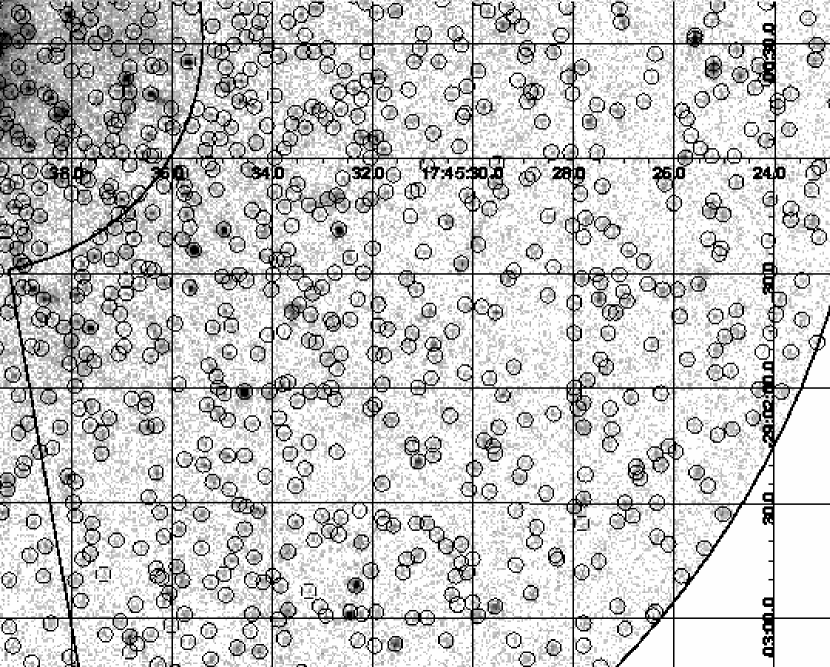
Because of its excellent angular resolution and low instrumental background, Chandra can detect point sources yielding just a few total counts. Such low detection thresholds lead to strong biases in the derived related to the Poisson counting statistics. Generally, the raw number-flux relation near the detection threshold is significanly below the true because of these effects. This observational bias and methods for correcting it have been extensively studied (e.g. Hasinger et al. 1993; Vikhlinin et al. 1995, and references therein), and in particular for the Chandra image analysis in Moretti et al. (2002); Kenter & Murray (2003); Bauer et al. (2004). An additional bias in our case arises from source confusion, non-neglibile in the GC region even with the Chandra’s angular resolution (Fig.2).
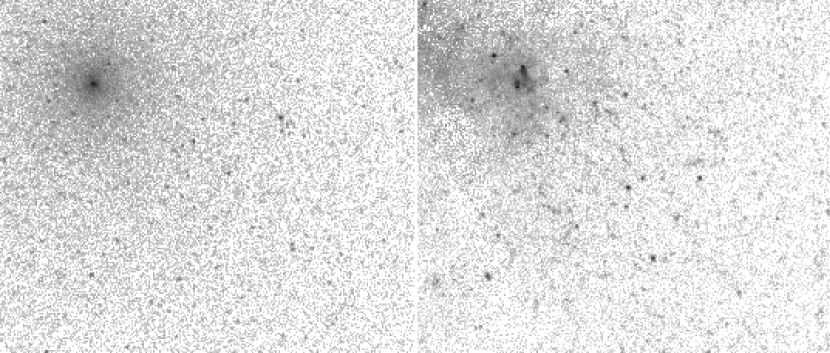
Our procedure for recovering the true function in the GC region is based on Monte-Carlo simulations, which allows us to derive accurate corrections for the statistical and source confusion biases. We start with simulating the images containing realistic parent point source populations. We assume that the shape of the relation is independent of distance from Sgr A∗ (which corresponds to distance-independent luminosity function in this region). The normalization of the parent is assumed to vary as , consisted with the previous studies of both the descrete source populations (see e.g. Muno et al. 2003, 2006a) and the total X-ray flux (e.g. Neronov et al. 2005) in the GC region. The shape of the parent is assumed to be a power law, with , at bright fluxes ( cnt)111Assuming the power law spectrum with the photon index absorbed with cm-2 (Muno et al. 2004), 40 counts in the 4–8 keV band corresponds to an unabsorved flux of erg s-1 cm-2 in the 2–10 keV band.. At lower fluxes, we allowed for a nearly arbitrary shape of the intrinsic . Namely, we assumed that in the flux intervals 40–10, 10–3, 3–1, and 1–0.3 cnts but the normalization within each interval is arbitrary. The normalizations of the parent in each flux range were varied randomly in each realization. For each simulated source, the number of detected photons was drawn from the Poisson distribution. If the total number of simulated photons was below the total observed intensity, the “missing” flux was added as a diffuse component with the surface brightness . An example of the simulated image is shown in Fig.4.
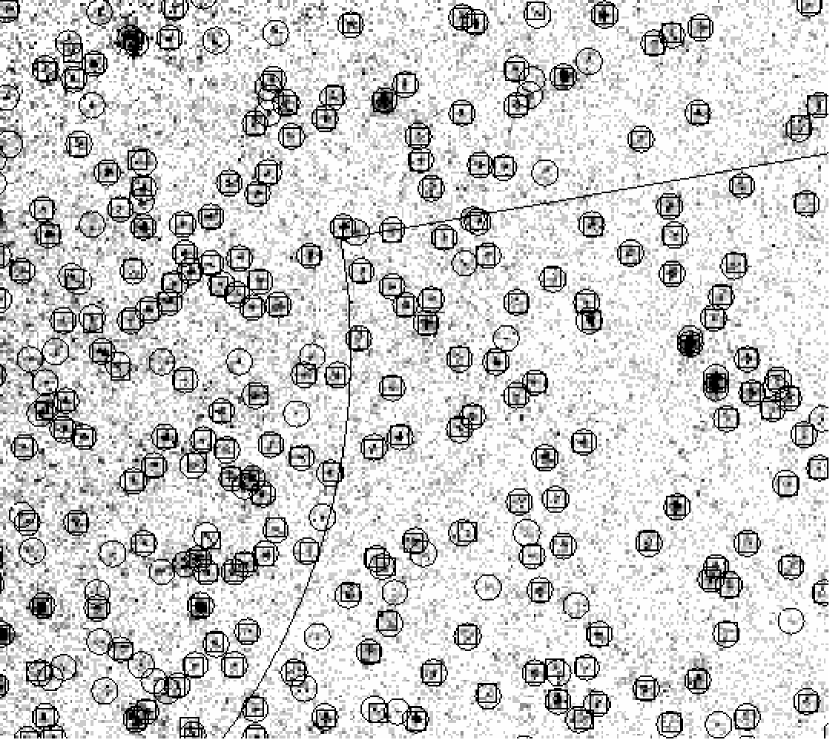
Our source detection is based on the wavelet decomposition algorithm described in Vikhlinin et al. (1998). The detection threshold (specified as a required statistical significance) was chosen so that less than 1 spurious detection is allowed over the region of interest. Sources detected in the Chandra image of the GC region are shown by circles in Fig.2. We also checked that wavelet decomposition provides equal or better sensitivity to the point sources compared with the CIAO task wavdetect (Fig. 3).
The fluxes of detected sources were measured within the aperture (which should contain nearly 100% of the total source flux for the observed PSF width, see § 2). The local background, provided by the largest scale of the wavelet decomposition, , was subtracted from the source flux.
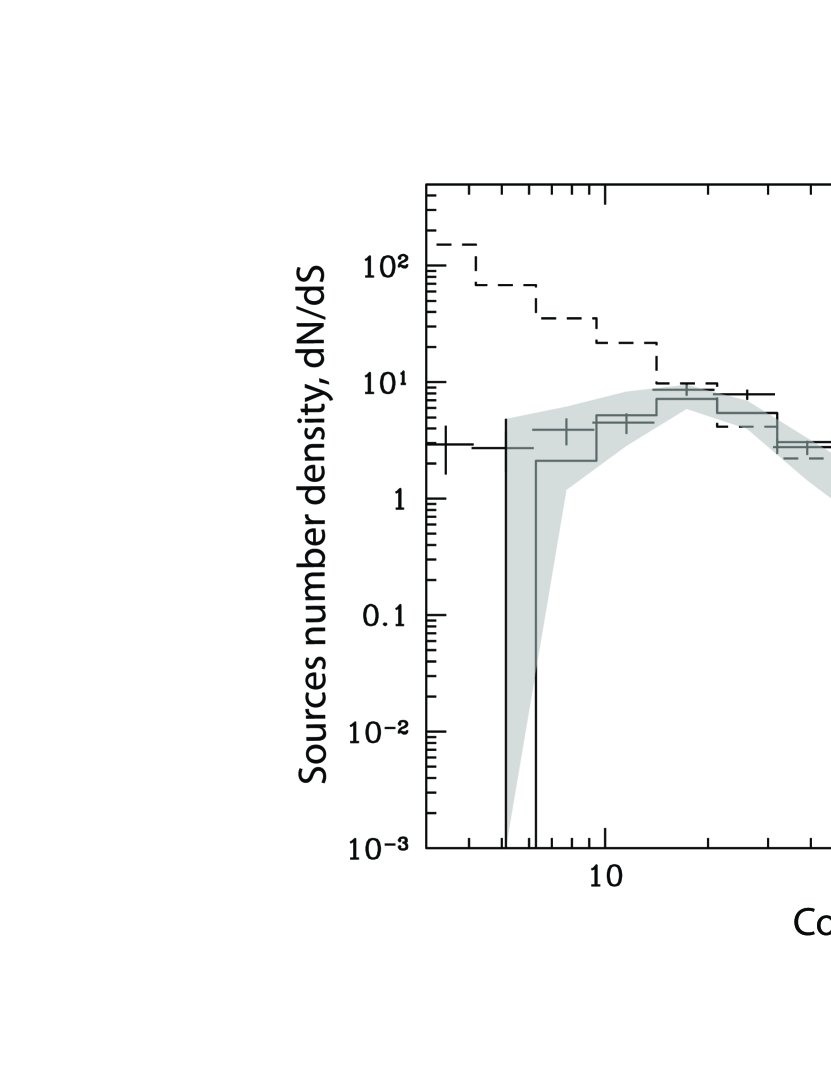
The raw differential number-flux relation derived from the real observation is shown by crosses in Fig.5. From our simulations, we can determine the “response” to which shape and normalization of the parent best describes the observed flux distribution. These results are discussed below.
4 Results
The region outlined by the solid line in Fig. 1 contains in total 63.5 kcnts in the energy band 4–8 keV. The estimated particle background image of the same region contains 10.6 kcnts. Thus the net background-corrected number of counts is 52.9 kcnts. The total flux from all the sources detected in the region is kcnts.
4.1 Resolved fraction
Figure 5 shows an example of a simulated number-flux function that is consistent with the distribution measured by Chandra. Also shown is the corresponding intrinsic relation. By sampling over many such well-matching (the reduced difference from the observed number-flux function is less than 1.5) trial distributions, we determined the allowed range of the cumulative flux of “parent” sources in the GC region (shaded region in Fig. 5).
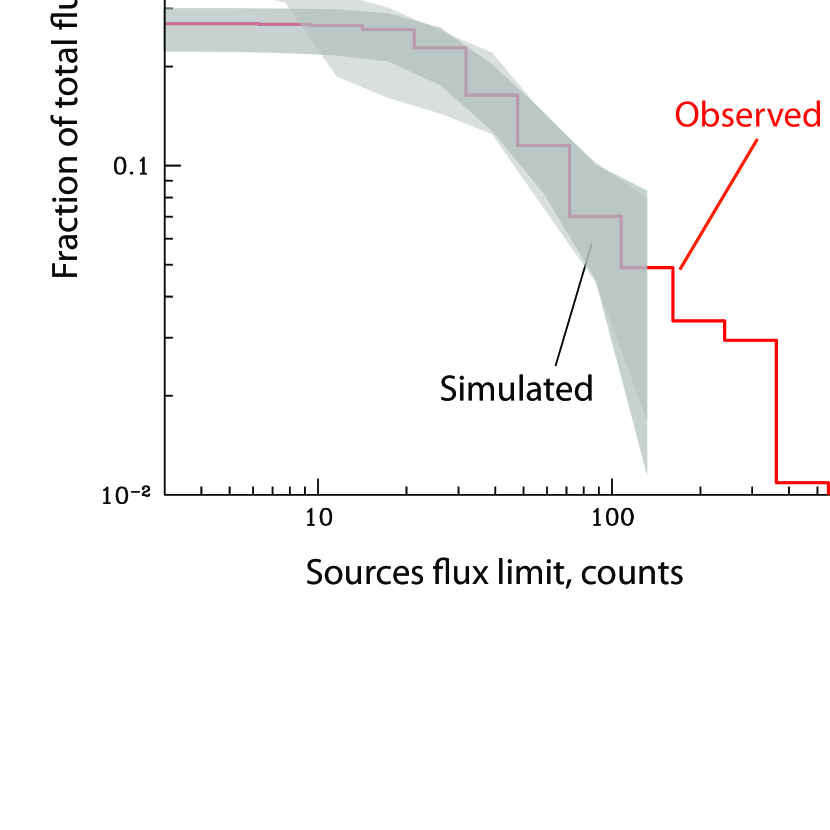
The outcome of this analysis is presented in Fig. 6. We conclude that at least 40% and possibly 100% of the total X-ray flux from the GC region is produced by point sources. We note that in obtaining this result we limited ourselves to sources with average intensities of more than 3 integrated counts, because the number densities of yet weaker sources are poorly constrained by the available data. Therefore 40% is actually a conservative lower limit on the contribution of point sources to the total X-ray flux. Below we discuss the expected contribution of sources with luminosities below the Chandra detection threshold.
4.2 Luminosity function of point X-ray sources
We now address the luminosity function of faint X-ray sources in the GC region. Since the volume density of stars within several tens of parsecs of Sgr A∗ is several orders of magnitude higher than in other places along the line of sight in that direction, we can safely assume that the absolute majority of stars and X-ray sources in the sky region of our study (located at a pc projected distance from Sgr A∗, see Fig. 1) physically belong to either the nuclear stellar cluster (NSC) or nuclear stellar disk (NSD) components of the Galaxy (Genzel & Townes 1987; Launhardt, Zylka, & Mezger 2002). This allows us to readily estimate the stellar mass contained in the volume of the Galaxy covered by our observations and consequently the luminosity function of X-ray sources in the GC region normalized by stellar mass.
For the NSC we adopted the following density profile:
where /pc3 and pc. The slope was assumed to be at pc and at larger distances. The total mass of the NSC within 200 pc of Sgr A∗ is thus . This value is actually uncertain by a factor of (see e.g. Lindqvist, Habing, & Winnberg 1992; Launhardt, Zylka, & Mezger 2002).
The NSD was assumed to have the density distribution ( and are measured in parsecs)
where /pc3 and pc. At pc, the slope , at pc pc, , and at pc, . The total mass of the NSD is thus . In reality this quantity is uncertain by some 50% (Launhardt, Zylka, & Mezger 2002). We took the distance to the Galactic Center to be 7.6 kpc (Eisenhauer et al. 2005).
The adopted mass model gives a total mass of stars enclosed in the region of our study of . This value is uncertain by a factor of mainly due to the uncertainty in the NSC mass. We note that a similar mass model was found to provide a satisfactory description of the surface density distribution of detected X-ray sources in the GC region (Muno et al. 2006a).
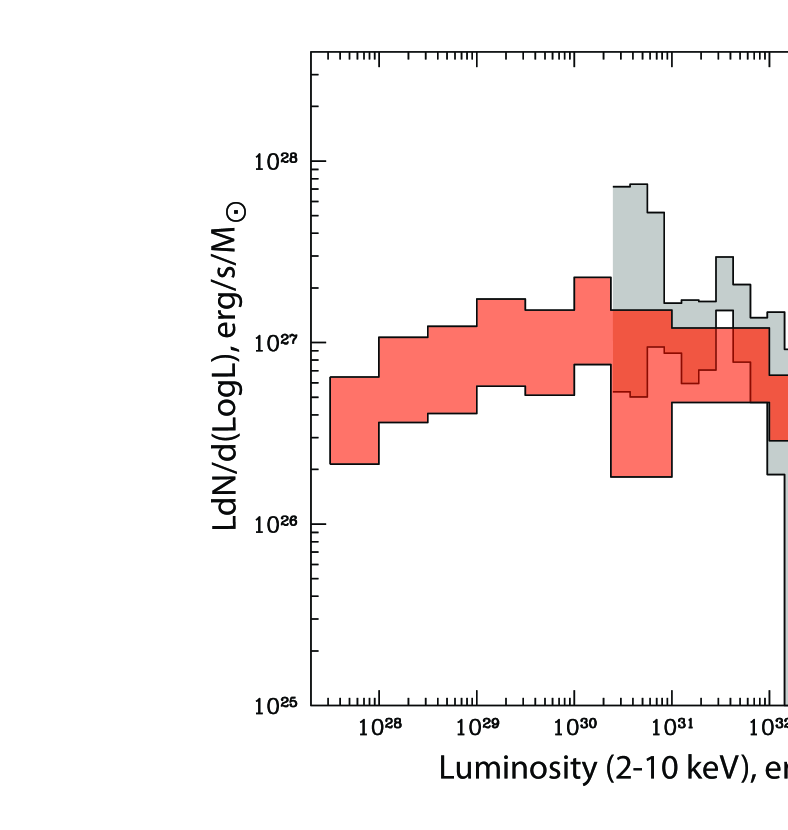
Using this estimate of the enclosed stellar mass and the Chandra source number-flux function, we obtained from simulations the allowed range for the luminosity function of X-ray sources in the GC region at luminosities erg s-1, which is shown in Fig. 7. It is important to note that the overall normalization of this luminosity function is uncertain by a factor of due to the uncertainty in the stellar mass enclosed in the studied region of the Galaxy. For comparison we show in Fig. 7 (points with error bars) the result of simply dividing the differential – function measured by Chandra by the enclosed stellar mass. This naive determination is affected by the bias discussed in the previous section and thus underestimates the true luminosity function. On the other hand, the allowed range for the luminosity function inferred from the Chandra data for the dense GC region is remarkably compatible with the luminosity function of faint X-ray sources in the Solar vicinity (Sazonov et al. 2006, Fig. 7), taking into account the uncertainty in the NSC mass.
The total absorption-corrected (assuming a line-of-sight absorption of cm-2) X-ray flux in the energy band 2–10 keV from the studied GC region is erg s-1 cm-2. For the GC distance of 7.6 kpc (Eisenhauer et al. 2005), this corresponds to a total X-ray luminosity erg s-1. Therefore the total X-ray emissivity in the studied volume of the Galaxy is erg s-1, where we included the uncertainty in the NSC mass. This derived value of the X-ray emissivity per unit stellar mass agrees within the uncertainties with the cumulative emissivity of faint X-ray sources (cataclysmic variables and coronally active stars) near the Sun: erg s-1 (Sazonov et al. 2006).
We should note here that in the studied GC region there may be a non-negligible contribution from warm diffuse plasma heated by supernova remnants. According to Muno et al. (2004), % of the total 2–10 keV flux is probably due to a keV plasma. This would mean that the X-ray emissivity of point sources in the GC region is actually somewhat smaller, erg s-1, i.e. even closer to the value measured by Sazonov et al. (2006) in the Solar neighborhood.
5 Discussion
We showed that at least 40% of the total X-ray emission from the Galactic Center region is produced by point sources with luminosities erg s-1. The inferred luminosity function of such sources (see also Muno et al. 2006a) is compatible with that measured in the Solar vicinity (Sazonov et al. 2006). Moreover, the data are consistent with the hypothesis that sources with luminosities below erg s-1, the effective Chandra detection limit, provide the rest of the total X-ray flux. Such sources are in fact expected to be present in the required numbers in the GC region.
According to studies in the Solar neighborhood (Sazonov et al. 2006), most of the X-ray sources with luminosities erg s-1 are coronally active stars. Late-type stars with convective envelopes can have coronae where the plasma can be heated up to X-ray temperatures (see Güdel 2004, for a review). Such stars are usually fast rotators, as is required for high coronal activity, because they are either members of binary systems or relatively young (see e.g. Walter & Bowyer 1981; Queloz et al. 1998). The relative fraction of binary stars with active coronae near the Sun is quite high: at least every 80’th star has an X-ray (2–10 keV) luminosity in the range erg s-1 erg s-1. The relative fraction of single stars with active coronae is even larger.
The relative contribution of coronally active stars to the total X-ray emission of a given volume of the Galaxy is estimated to be 30–60% (Sazonov et al. 2006). For this fraction to be smaller, the fraction of stars with convective envelopes (usually late-type, low-mass stars) should somehow be reduced, whereas the population of low-mass stars at distances 4.5–8.7 pc from Sgr A∗ appears quite normal (e.g. Philipp et al. 1999).
As mentioned above, the luminosity function of GC sources agrees within the uncertainties with that measured in the Solar vicinity (Sazonov et al. 2006). We point out that because the vast majority of sources detected in the GC region are located at the same and known distance from us, a luminosity function determined there can be more accurate than a luminosity function determined elsewhere.
Acknowledgements.
This research made use of data obtained from the High Energy Astrophysics Science Archive Research Center Online Service, provided by the NASA/Goddard Space Flight Center.References
- Bauer et al. (2004) Bauer F. E., Alexander D. M., Brandt W. N., Schneider D. P., Treister E., Hornschemeier A. E., Garmire G. P., 2004, AJ, 128, 2048
- Bleach et al. (1972) Bleach R. D., Boldt E. A., Holt S. S., Schwartz D. A., Serlemitsos P. J., 1972, ApJ, 174, L101
- Cooke, Griffiths, & Pounds (1970) Cooke B. A., Griffiths R. E., Pounds K. A., 1970, IAUS, 37, 280
- Ebisawa et al. (2001) Ebisawa K., Maeda Y., Kaneda H., Yamauchi S., 2001, Sci, 293, 1633
- Ebisawa et al. (2005) Ebisawa K., et al., 2005, ApJ, 635, 214
- Eisenhauer et al. (2005) Eisenhauer F., et al., 2005, ApJ, 628, 246
- Genzel & Townes (1987) Genzel R., Townes C. H., 1987, ARA&A, 25, 377
- Giacconi et al. (1962) Giacconi R., Gursky H., Paolini R., Rossi B. 1962, Phys.Rev.Lett. 9, 439
- Giacconi et al. (2002) Giacconi R., Zirm A., Wang J. et al. 2002, ApJS, 139, 369
- Güdel (2004) Güdel M., 2004, A&ARv, 12, 71
- Hasinger et al. (1993) Hasinger G., Burg R., Giacconi R., Hartner G., Schmidt M., Trumper J., Zamorani G., 1993, A&A, 275, 1
- Kenter & Murray (2003) Kenter A. T., Murray S. S., 2003, ApJ, 584, 1016
- Koyama et al. (1986) Koyama K., Makishima K., Tanaka Y., Tsunemi H., 1986, PASJ, 38, 121
- Koyama et al. (1989) Koyama K., Awaki H., Kunieda H., Takano S., Tawara Y., 1989, Natur, 339, 603
- Krivonos et al. (2006) Krivonos R., Revnivtsev M., Churazov E., Sazonov S., Grebenev S., Sunyaev R., 2006, astro, arXiv:astro-ph/0605420
- Launhardt, Zylka, & Mezger (2002) Launhardt R., Zylka R., Mezger P. G., 2002, A&A, 384, 112
- Lindqvist, Habing, & Winnberg (1992) Lindqvist M., Habing H. J., Winnberg A., 1992, A&A, 259, 118
- Moretti et al. (2002) Moretti A., Lazzati D., Campana S., Tagliaferri G., 2002, ApJ, 570, 502
- Mukai & Shiokawa (1993) Mukai K., Shiokawa K., 1993, ApJ, 418, 863
- Muno et al. (2003) Muno, M. P., et al. 2003, ApJ, 589, 225
- Muno et al. (2004) Muno, M. P., et al. 2004, ApJ, 613, 326
- Muno et al. (2006a) Muno M. P., Bauer F. E., Bandyopadhyay R. M., Wang Q. D., 2006a, ApJS, 165, 173
- Neronov et al. (2005) Neronov A., Chernyakova M., Courvoisier T. J. -., Walter R., 2005, astro, arXiv:astro-ph/0506437
- Ottmann & Schmitt (1992) Ottmann R., Schmitt J. H. M. M., 1992, A&A, 256, 421
- Park et al. (2004) Park S., Muno M. P., Baganoff F. K., Maeda Y., Morris M., Howard C., Bautz M. W., Garmire G. P., 2004, ApJ, 603, 548
- Philipp et al. (1999) Philipp S., Zylka R., Mezger P. G., Duschl W. J., Herbst T., Tuffs R. J., 1999, A&A, 348, 768
- Queloz et al. (1998) Queloz D., Allain S., Mermilliod J.-C., Bouvier J., Mayor M., 1998, A&A, 335, 183
- Revnivtsev (2003) Revnivtsev M., 2003, A&A, 410, 865
- Revnivtsev, Molkov, & Sazonov (2006) Revnivtsev M., Molkov S., Sazonov S., 2006, MNRAS, in press, astro-ph/0605693
- Revnivtsev et al. (2006) Revnivtsev M., Sazonov S., Gilfanov M., Churazov E., Sunyaev R., 2006, A&A, 452, 169
- Sazonov et al. (2006) Sazonov S., Revnivtsev M., Gilfanov M., Churazov E., Sunyaev R., 2006, A&A, 450, 117
- Schmitt et al. (1990) Schmitt J. H. M. M., Collura A., Sciortino S., Vaiana G. S., Harnden F. R., Rosner R., 1990, ApJ, 365, 704
- Tanaka (2002) Tanaka Y., 2002, A&A, 382, 1052
- Vikhlinin et al. (2005) Vikhlinin, A., Markevitch, M., Murray, S. S., Jones, C., Forman, W., & Van Speybroeck, L. 2005, ApJ, 628, 655
- Vikhlinin et al. (1995) Vikhlinin A., Forman W., Jones C., Murray S., 1995, ApJ, 451, 542
- Vikhlinin et al. (1998) Vikhlinin A., McNamara B. R., Forman W., Jones C., Quintana H., Hornstrup A., 1998, ApJ, 502, 558
- Worrall et al. (1982) Worrall D. M., Marshall F. E., Boldt E. A., Swank J. H., 1982, ApJ, 255, 111
- Worrall & Marshall (1983) Worrall D. M., Marshall F. E., 1983, ApJ, 267, 691
- Walter & Bowyer (1981) Walter F. M., Bowyer S., 1981, ApJ, 245, 671
- Warwick et al. (1985) Warwick R. S., Turner M. J. L., Watson M. G., Willingale R., 1985, Natur, 317, 218
- Yamauchi & Koyama (1993) Yamauchi S., Koyama K., 1993, ApJ, 404, 620